

Key Points
A 23-SNP MM-PRS is validated as a risk factor for MM in an independent MM case-control study, and is also associated with MGUS risk.
MM and MGUS have a shared common genetic susceptibility and heritability.

Abstract
So far, 23 germline susceptibility loci have been associated with multiple myeloma (MM) risk. It is unclear whether the genetic variation associated with MM susceptibility also predisposes to its precursor, monoclonal gammopathy of undetermined significance (MGUS). Leveraging 2434 MM cases, 754 MGUS cases, and 2 independent sets of controls (2567/879), we investigated potential shared genetic susceptibility of MM and MGUS by (1) performing MM and MGUS genome-wide association studies (GWAS); (2) validating the association of a polygenic risk score (PRS) based on 23 established MM loci (MM-PRS) with risk of MM, and for the first time with MGUS; and (3) examining genetic correlation of MM and MGUS. Heritability and genetic estimates yielded 17% (standard error [SE] ±0.04) and 15% (SE ±0.11) for MM and MGUS risk, respectively, and a 55% (SE ±0.30) genetic correlation. The MM-PRS was associated with risk of MM when assessed continuously (odds ratio [OR], 1.17 per SD; 95% confidence interval [CI], 1.13-1.21) or categorically (OR, 1.70; 95% CI, 1.38-2.09 for highest; OR, 0.71; 95% CI, 0.55-0.90 for lowest compared with middle quintile). The MM-PRS was similarly associated with MGUS (OR, 1.19 per SD; 95% CI, 1.14-1.26 as a continuous measure, OR, 1.77, 95%CI: 1.29-2.43 for highest and OR, 0.70, 95%CI: 0.50-0.98 for lowest compared with middle quintile). MM and MGUS associations did not differ by age, sex, or MM immunoglobulin isotype. We validated a 23-SNP MM-PRS in an independent series of MM cases and provide evidence for its association with MGUS. Our results suggest shared common genetic susceptibility to MM and MGUS.
Introduction
Multiple myeloma (MM) is a hematologic malignancy in which malignant plasma cells accumulate in the bone marrow. MM is preceded by the presence of an asymptomatic clonal plasma cell expansion, a condition referred to as monoclonal gammopathy of undetermined significance (MGUS), which progresses to symptomatic MM at a rate of 1% per year.1,2
Epidemiologic and family studies suggest a shared genetic susceptibility underlying risk of MM and its precursor disease, MGUS.3-19 Family history is one of the few known and confirmed risk factors for MM and MGUS,3,18-23 with a two- to fourfold increased risk of MM in first-degree relatives of individuals with MM and a two- to threefold increased risk of MGUS in first-degree relatives of MM or MGUS cases.3,18-23
Genome-wide association studies (GWASs) conducted in subjects of European ancestry (EA) have been used to identify 23 germline MM susceptibility loci, with odds ratios (ORs) ranging from 1.10 to 1.40.24-28 An additional variant is associated with increased risk of MM in cases with the t(11;14) translocation.29 Because the effect sizes of single-nucleotide polymorphisms (SNPs) at these loci are small, individual SNPs are not strong predictors of MM risk, but their combination into a single summary measure, known as a polygenic risk score (PRS), may provide improved risk stratification.30-35
It is unclear whether the genetic variation associated with MM susceptibility also predisposes to MGUS as some, but not all, of the MM-SNPs have been associated with MGUS, with results varying across studies.36-38 We evaluated the association of a MM-PRS comprising the 23 MM loci with both MM and MGUS risk. We also used GWAS of MM and MGUS to validate known risk loci, identify novel MM and MGUS risk loci, and examine shared heritability between the 2 traits. Together, these studies provide insight into shared genetic susceptibility between MM and MGUS.
Materials and methods
Study samples
The International Lymphoma Epidemiology Consortium (InterLymph) is a scientific consortium for epidemiologic research on non-Hodgkin lymphoma and MM (http://epi.grants.cancer.gov/InterLymph). Through the InterLymph Multiple Myeloma Working Group, we identified 10 GWASs of MM of people of EA comprising 2434 MM cases and 3446 controls. The controls consisted of 2 independent sets referred to as InterLymph (n = 2567) or OncoArray Controls (n = 879) (supplemental Table 1). Additionally, 754 MGUS cases from Mayo Clinic and MD Anderson with available GWAS data were included. MGUS diagnoses were determined using standard clinical criteria.39 Contributing studies were approved by local ethics review committees, and all participants provided written informed consent.
Details and descriptions of each of these GWASs are available elsewhere40-42 and in the supplemental material (supplemental Table 1; supplemental Figure 1). Briefly, samples were genotyped using multiple platforms (Affymetrix, Human660W-quad Beadchip, and Illumina arrays 610 Quad, Omni5, OmniExpress Beadchip, and OncoArray). Each of the GWASs was subjected to rigorous standard quality control independently (supplemental Table 1; supplemental Figure 1) prior to imputation using the Michigan imputation server based on the Haplotype Reference Consortium.43 After imputation, each site was filtered to include only high-quality imputed variants (information score >0.8), and further quality-control checks were implemented (supplemental material). The data were then combined and final quality control was performed on the combined GWAS set including checks for missingness, duplicates, sex mismatch, abnormal heterozygosity, cryptic relatedness, population outliers (evaluated by principal components analyses using Eigenstrat software44 ), and genomic inflation (λ = 1.00) (supplemental Figure 1).
PRS
In the above equation, nij = {0,1,2) is the number of risk alleles carried at the ith SNP by the jth individual, and ORi is the per-allele OR45 from the largest GWAS of MM.24 Of the 23 MM risk loci, 22q12:rs138747 was not available on the Haplotype Reference Consortium platform; therefore, we used 22q12:rs138740, which was in high linkage disequilibrium (r2 = 0.96), based on EA population (Utah residents from Northern and Western Europe [CEU]).46 All 23 SNPs had an imputation quality information score >0.9 across platforms (supplemental Table 2) with 1 exception, SNP 6p21:rs3132535 on the Mayo Clinic’s Affymetrix 6.0 array, which had poor imputation quality (information score = 0.007); for this SNP, study participants from Mayo Clinic Affymetrix GWAS (n = 170 cases/295 controls) were assigned the reference genotype (common allele homozygote). The previously identified variant specific to MM cases with t(11;14) translocation29 was not included in the 23-SNP MM-PRS.
Statistical analyses
Differences in the distributions of age and sex between cases and controls were assessed using 2-sided χ2 tests or Student t tests, where appropriate. Allele frequencies were compared with those reported by previous GWASs (supplemental Table 3).
Multivariable logistic regression, assuming an additive model, was implemented in PLINK v1.9 to perform standard GWAS analyses adjusted for age, sex, and study. The control sample for the MGUS GWAS consisted of a subset (n = 879) of the control sample with OncoArray genotyping. Associations of the 23 known MM risk loci with MM and MGUS risk were evaluated overall and by study. Associations were considered replicated when effect estimates were in the same direction and values of P < .05. Heterogeneity between studies was tested by meta-analysis using the Cochran Q method and I2.47 In addition, we evaluated 20 previously identified SNPs associated (P values ranging from 9.0 × 10⁻⁷ to 3.7 × 10⁻³) with MGUS from 2 previous GWASs (Thomsen et al36,48 ). Given the range of allele frequencies (3% to 50%), assuming a replication P = .05, we had 80% power to detect ORs of magnitude 1.1 to 1.4 for MM and 1.2 to 1.3 for MGUS.
Multivariable logistic regression was used to assess the association of MM-PRS with MM or MGUS risk separately, adjusted for age, sex, and study. ORs and 95% confidence intervals (CIs) were estimated. Independent sets of controls were used for models testing MM risk and MGUS risk to avoid biasing the results. The MM-PRS was evaluated both as a continuous variable, per standard deviation (SD), and as a categorical variable (quintiles, based on the MM-PRS distribution in the controls). We also examined percentiles of the MM-PRS distribution, including the extremes (<5% or >95%). Models were stratified by age (<60 years and ≥60 years) and sex. In the MM GWAS, stratified analysis by isotype (immunoglobulin [Ig]G, IgA, IgD, and light-chain MM) was also performed for the subset of cases with these data. Model comparisons were performed using analysis of variance and based on the Wald test; differences in effect estimates were tested based on the absolute difference between log ORs using Z scores. Sensitivity analysis of the association between MM-PRS and MGUS risk removing known MGUS progressors (to MM) was performed to ensure these MGUS progressors (MM) were not driving the association.
Secondary analyses of MGUS cases were performed for MGUS participants from Mayo Clinic who had progression information available (follow-up time and date of progression). Follow-up time was defined from the date of MGUS detection to date of MM diagnosis (progressors) or date of last known follow-up or death (nonprogressors). MM events were identified from linkage to the Mayo Clinic tumor registry. We performed analyses restricted to MGUS with at least 10 years of follow-up. We first compared median differences in the MM-PRS distributions between progressors and nonprogressors using the Wilcoxon rank-sum test. Next, we examined the association of MM-PRS with progressing and nonprogressing MGUS by comparing each of these case groups with controls.
Heritability was estimated for MM and MGUS by the proportion of phenotypic variance explained by all common SNPs using the genome-based restricted maximum likelihood (GREML) method performed with GCTA (genome-wide complex trait analysis) software.49-51 We also estimated the genetic correlation between MM and MGUS GWAS using a bivariate GREML analysis.50,52,53 In this way, we estimated the genetic variance for MM and MGUS independently (captured by all common SNPs) and the genetic covariance between them.50 Independent sets of controls were used for MM and MGUS. As previously suggested by Mitchell et al when calculating the heritability of a cancer, such as a MM, we used lifetime risk (0.00734) rather than prevalence to transform data to the liability scale.54-56 Sensitivity analyses removing known MGUS progressors were also performed.
Results
After exclusions (see supplemental Methods), the combined data consisted of 2434 MM cases, 754 MGUS cases, and 2 independent sets of EA controls (InterLymph: n = 2567; OncoArray: n = 879) (Table 1; supplemental Table 1). Sixty percent of MM cases and MGUS cases were male. The median age was 61 and 66 for MM and MGUS cases, respectively. Isotype was available for 37% of MM cases; of these, 67% were IgG. The percent male in the InterLymph and OncoArray control groups was 57% and 46%, respectively, and the median age was similar, 62-63 years.
Characteristics of MM and MGUS cases and controls (European Americans)
| Characteristics | Cases | InterLymph controls (n = 2567) | OncoArray controls (n = 879) | |
|---|---|---|---|---|
| MM (n = 2434) | MGUS (n = 754) | |||
| Male sex | 1472 (60) | 437 (58) | 1455 (57) | 400 (46) |
| Age, median (range), y | 61 (22-90) | 66 (21-97) | 63 (20-92) | 62 (28-92) |
| Study institution/genotyping array | ||||
| Mayo Clinic/Affymetrix | 170 (7) | — | 295 (11) | — |
| Mayo Clinic/Illumina OncoArray | 513 (21) | 700 (93) | — | 377 (43) |
| MD Anderson/Illumina OncoArray | 449 (19) | 54 (7) | — | 502 (57) |
| BC Cancer (British Columbia)/Illumina Omni Express BeadChip | 133 (5) | — | 109 (4) | — |
| Prostate, Lung, Colorectal and Ovarian Cancer, Screening Trial/Illumina Omni Express BeadChip | 146 (6) | — | 222 (9) | — |
| UCSF 1/Human660W-Quad BeadChip | 70 (3) | — | 295 (11) | — |
| UCSF 2/Illumina Omni5 | 286 (12) | — | 741 (29) | — |
| USC*/Illumina OmniExpress BeadChip | 322 (13) | — | 502 (20) | — |
| University of Utah Huntsman Cancer Institute and Utah Cancer Registry/Illumina 610 Quad Array | 345 (14) | — | 403 (16) | — |
| MM isotype | ||||
| IgG | 594 (24) | — | — | — |
| IgA | 214 (9) | — | — | — |
| IgD | 32 (1) | — | — | — |
| IgM | 3 (<1) | — | — | — |
| Light chain | 51 (2) | — | — | — |
| Not available | 1540 | — | — | — |
Values are reported as n (%) of patients unless otherwise indicated.
UCSF, University of California, San Francisco; USC, University of Southern California.
USC includes Cancer Council of Victoria (Melbourne, VIC, Australia), Fred Hutchinson Cancer Center, SEER-Detroit/LA, and University of Alabama at Birmingham Molecular and Genetic Epidemiology (iMAGE) Study.
Genome-wide associations with MM and MGUS risk
The GWAS of MM and MGUS consisted of 5 864 648 high-quality imputed SNPs (information score >0.8). Quantile-quantile plots for MM GWAS and MGUS GWASs were generated to assess genomic inflation due to cryptic population structure. Principal components 1 to 20 were also estimated and included in associations of risk (supplemental Figure 2). One MM study (UCSF-660) was excluded from the combined MM GWAS analyses due to excessive heterogeneity. Risk allele frequencies for 23 MM SNPs included in the MM-PRS were similar to those reported by previous GWASs (supplemental Table 3), and associations with 17 of the 23 known MM risk loci were replicated in the pooled MM GWAS. However, no new loci for MM risk were observed (supplemental Figure 2 and supplemental Table 4), but 7 suggestive loci for MM risk (P < 5.0 × 10⁻⁶) were identified on chromosomes 1p31:rs12410914, 2p22:rs446538, 3q25:rs34792862, 7q11:rs937678, 8q24:rs6989575, 9q21:rs3927559, and 11q21:rs12222713. No genome-wide significant associations were found in the MGUS GWAS (754 MGUS cases and 879 controls), but we identified 5 suggestive loci (P < 5.0 × 10⁻⁶) on chromosomes (1p35:rs7547385, 9q31:rs9695887, 13q31:rs72640691, 18q21:rs10469126, and 19p13:rs197142) (supplemental Figure 2). Fourteen of the known 23 MM risk SNPs were associated with MGUS (P < .05) (supplemental Table 4), but only 1 of the 20 previously reported MGUS risk loci36,48 was associated (3p22:rs9848754, P < .05) with MGUS in our study (supplemental Table 5).
Heritability and genetic correlation
The estimated proportion of variance in MM and MGUS explained by all SNPs (ie, the SNP-based GWAS heritability) was 17% (SE ±0.04) and 15% (SE ±0.11), respectively (Table 2) and the estimated genetic correlation between MM and MGUS was 0.55 (SE ±0.30). Removing the known MGUS that progressed to MM (n = 128) resulted in similar estimates (SNP-based heritability for MGUS increased to 17% [SE ±0.12], and genetic correlation was unchanged).
Heritability estimates for MM and MGUS GWAS (GCTA)
| Within sample prevalence | Specified prevalence/lifetime risk of MM* (0.00734) | |
|---|---|---|
| MM, estimate (SE) | ||
| Heritability V(G)/Vp | 0.33 (0.07) | 0.17 (0.04) |
| Genetic variance V(G) | 0.08 (0.02) | |
| Phenotypic variance Vp | 0.25 (0.005) | |
| MGUS, estimate (SE) | ||
| Heritability V(G)/Vp | 0.29 (0.23) | 0.15 (0.11) |
| Genetic variance V(G) | 0.07 (0.05) | |
| Phenotypic variance Vp | 0.24 (0.01) |
GCTA, genome-wide complex trait analysis; V(G), genetic variance; Vp, phenotypic variance.
MM-PRS associations with MM and MGUS risk
We calculated the MM-PRS for the MM, MGUS, and control groups and found a higher median and mean unadjusted MM-PRS for the MM (median, 3.21; mean, 3.23; SD, 0.48; interquartile range [IQR], 0.66) and MGUS (median, 3.19; mean, 3.19; SD, 0.50; IQR, 0.66) cases compared with controls (InterLymph: median, 3.06; mean, 3.06; SD, 0.47; IQR, 0.60; OncoArray: median, 3.03; mean, 3.02; SD, 0.47; IQR, 0.65) (Table 3; Figure 1).
Association between PRS composed of 23 SNPs and risk of MM or MGUS
| PRS (range), % | Counts | MM risk | Counts | MGUS risk | ||||
|---|---|---|---|---|---|---|---|---|
| MM (n = 2434) | InterLymph controls (n = 2567) | OR (95% CI) | P | MGUS (n = 754) | OncoArray Controls (n = 879) | OR (95% CI) | P | |
| Q1 (<20) | 288 | 496 | 0.71 (0.55-0.90) | .005 | 109 | 202 | 0.70 (0.50-0.98) | .04 |
| Q2 (20-40) | 374 | 506 | 0.84 (0.67-1.06) | .14 | 126 | 165 | 0.98 (0.70-1.38) | .92 |
| Q3 (40-60) | 452 | 527 | Reference | 121 | 158 | Reference | ||
| Q4 (60-80) | 502 | 524 | 1.14 (0.92-1.42) | .23 | 162 | 172 | 1.21 (0.88-1.69) | .24 |
| Q5 (80-100) | 818 | 515 | 1.70 (1.38-2.09) | 5.2 × 10−07 | 236 | 182 | 1.77 (1.29-2.43) | .0004 |
| Continuous (per SD) | 1.17 (1.13-1.21) | 2.2 × 10⁻¹⁶ | 1.19 (1.14-1.26) | 2.77 × 10⁻¹² | ||||
| Mean PRS (SD) | 3.23 (0.48) | 3.06 (0.47) | 3.19 (0.50) | 3.02 (0.47) | ||||
| Median PRS (range) | 3.21 (1.63-4.91) | 3.06 (1.61-4.70) | 3.19 (1.69-4.64) | 3.03 (1.52-4.63) | ||||
Risk of MM was adjusted for age, sex, and study. Risk of MGUS was adjusted for age and sex. Combined controls quintile ranges: Q1 = (1.52-1.66), Q2 = (1.66-2.93), Q3 = (2.93-3.16), Q4 = (3.16-3.43), Q5 = (3.43-4.91). Bold text indicates statistically significant estimates.
Q, quintile.
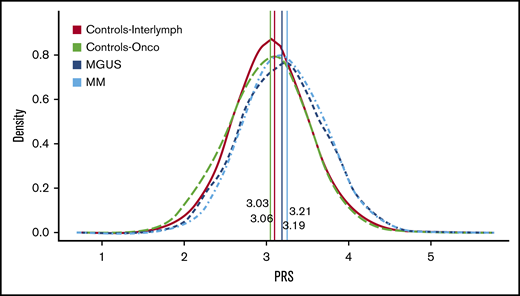
PRS distribution by MM, MGUS, and controls. This figure shows the PRS distribution by case-control status while indicating the median PRS for each group. InterLymph controls (median, 3.Array controls (median, 3.03) are in green, MGUS (median, 3.19) is in dark blue, and MM (median, 3.21) is in light blue. The distribution for both MM and MGUS are shifted to the right compared with the controls, and both have a higher median PRS score. There is no difference in the distribution of PRS for MGUS vs the MM cases (P > .05, Wilcoxon-rank-sum test).
PRS distribution by MM, MGUS, and controls. This figure shows the PRS distribution by case-control status while indicating the median PRS for each group. InterLymph controls (median, 3.Array controls (median, 3.03) are in green, MGUS (median, 3.19) is in dark blue, and MM (median, 3.21) is in light blue. The distribution for both MM and MGUS are shifted to the right compared with the controls, and both have a higher median PRS score. There is no difference in the distribution of PRS for MGUS vs the MM cases (P > .05, Wilcoxon-rank-sum test).
Adjusted for age, sex, study, and principal components, the MM-PRS was associated with MM risk when assessed as continuous (OR, 1.17 per SD; 95% CI, 1.13-2.21; P = 2.2 × 10⁻¹⁶) and categorical variable. Compared with the middle quintile (Q3), individuals in the highest quintile (Q5) had an estimated 70% increased MM risk (OR, 1.70; 95% CI, 1.38-2.09; P = 5.2 × 10⁻⁷) and those in the lowest quintile (Q1) had a 29% decreased MM risk (OR, 0.71; 95% CI, 0.55-0.90; P = .005). The MM-PRS was also associated with MGUS (OR, 1.19 per SD; 95% CI, 1.14-1.26;P = 2.8 × 10⁻¹²). Individuals with the highest MM-PRS (Q5) had an estimated 77% increased risk of MGUS (OR, 1.77; 95% CI, 1.29-2.43; P = 4.0 × 10⁻⁴), and those with lowest MM-PRS (Q1) had 30% decreased risk (OR, 0.70; 95% CI, 0.50-0.98; P = .04), compared with those in Q3. No difference was observed in the association of the MM-PRS with MM compared with MGUS (Wald test: P = .99). Analyses of the extremes of the MM-PRS distribution showed similar but larger effects sizes for associations with both MM and MGUS at the tails of the MM-PRS distribution (supplemental Table 6).
When stratified by age and sex, similar associations were found for MM-PRS with risk of MM and MGUS (Figure 2; supplemental Tables 7 and 8). Of the 891 MM cases with available isotype, MM-PRS was significantly associated with risk of IgG-MM, IgA-MM, and IgD-MM. Specifically, there was an estimated 23%, 25%, and 34% increased risk of IgG (OR, 1.23; 95% CI, 1.18-1.29; n = 594 cases), IgA (OR, 1.25; 95% CI, 1.16-1.33; n = 214 cases), and IgD (OR, 1.34; 95% CI, 1.13-1.58; n = 32 cases), respectively, when compared with controls. These effects did not vary across isotype group (P > .05). No significant association was observed for light-chain MM (OR, 1.10; 95% CI, 0.96-1.27; n = 51 cases). IgM cases were excluded due to small numbers (2%, n = 3) (supplemental Figure 3).
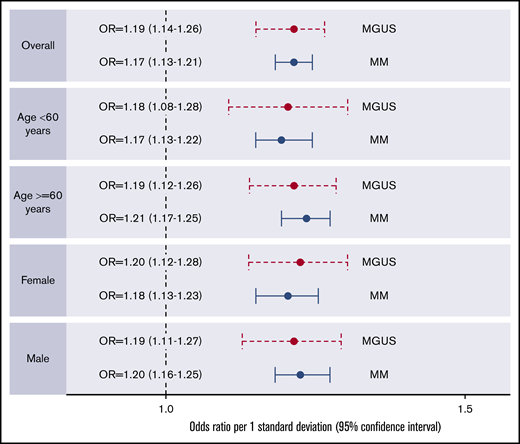
Forest plots of associations between PRS (composed of 23 MM SNPs) and MM or MGUS by age and sex.
Forest plots of associations between PRS (composed of 23 MM SNPs) and MM or MGUS by age and sex.
Of the 589 MGUS cases with follow-up information from the Mayo Clinic, 128 progressed to MM (progressors) and 461 did not (nonprogressors) (supplemental Table 9), with median follow-up times of 6.36 years (range, 0-33.5) and 8.05 years (range, 0-29.0), respectively. A sensitivity analysis removing the 128 known progressors resulted in similar associations between the MM-PRS and MGUS risk (supplemental Table 10). Further analyses of the 223 MGUS cases with ≥10 years of follow-up (41 progressors and 182 nonprogressors) (supplemental Table 9) resulted in similar mean MM-PRS for progressors (3.3) and nonprogressors (3.2) (P = .73) (supplemental Figure 4) and no statistically significant difference in the association of MM-PRS with MGUS risk by progression status, adjusted for age and sex (OR, 1.19 per SD; 95% CI, 1.03-1.3 for progressors vs OR, 1.14 per SD; 95% CI, 1.06-1.22 for nonprogressors; P = .33) (supplemental Table 11).
Discussion
Our study is the first independent validation of the association of the 23-SNP MM-PRS with MM risk and the first to examine differential associations by MM specific criteria (age, sex, and isotype). We further demonstrate the MM-PRS association with increased risk of MGUS and coheritability of MGUS and MM. These results suggest that the PRS comprised of MM loci may also predispose to the initiation of MGUS.
The MM-PRS has been examined in both familial and sporadic MM. Halvarsson et al57 examined the contribution of a PRS comprised of 17 MM risk variants to familial MM and provided evidence for a polygenic etiology in a familial hematologic malignancy. Using 38 familial cases, they linked Swedish nationwide registries and demonstrated an enrichment of common MM risk alleles in familial compared with 1530 sporadic MM cases and 10 171 population-based controls.
Went et al24 conducted the largest MM GWAS to date and constructed the first 23-SNP MM-PRS using data from the same GWAS. They found a threefold increased risk of MM in the top 1% of PRS compared with median genetic risk, and similar to Halvarsson et al.57 , they also observed enrichment of risk variants among familial MM compared with both sporadic MM cases and population-based controls. This study of the MM-PRS, however, had complete overlap with studies used to identify 6 of the MM risk SNPs and develop the PRS. This could have led to some overestimation of the risk gradient for the PRS. Our study is the first independent validation of the 23-SNP MM-PRS.
Our GWAS also replicated 17 of the previously reported 23 MM risk loci (supplemental Table 4) with risk of MM. The other 6 risk loci (rs4325816/SP3, rs34229995/JARID2, rs3132535/CCHCR1, rs58618031/POT1, rs6066835/PREX1, and rs138740/TOM1) were not replicated, but 4 of these SNPs had effect estimates in the same direction as previously reported. The other 2 SNPs (rs4325816/SP3 on chromosome 2 and rs138740/TOM1 on chromosome 22) were in the opposite direction in our MM (OR, 0.96 and 0.95) and MGUS (OR, 0.93 and 0.99) GWASs compared with Went et al24 (OR, 1.24 and 1.18, respectively).
Interestingly, 12 (rs7577599/DNTB, rs6599192/ULK4, rs10936600/LRRC34, rs6595443/CEP120, rs9372120/ATG5, rs7781265/SMARCD3, rs1948915/CCAT1, rs2790457/WAC, rs13338946/PRR14, rs7193541/RFWD3, rs34562254/TNFRSF13B, and rs139402/CBX7) of the 23 MM risk loci were associated with both MM and MGUS risk (P < .05) (supplemental Tables 4 and 12). In 10 of these 12 SNPs, the effect sizes were larger in the MGUS association compared with MM, except rs6599192/ULK4 and rs1948915/CCAT1, which had larger effect sizes in MM association. This could suggest that these SNPs influence MM through their association with MGUS and not necessarily MGUS progression. However, to understand whether these 10 SNPs are predictive of progression requires larger prospective MGUS studies.
Five of the MM loci were only associated with MM and not MGUS (rs1423269/ELL2, rs4487645/CDCA7L, rs17507636/CCDC71L, rs2811710/CDKN2A, and rs11086029/KLF2). We might have been underpowered to see these associations, or these 5 loci may be associated with progression from MGUS to MM and not MGUS initiation. Further, 2 MM risk loci were associated with only MGUS risk (rs3132535/CCHR1 and rs6066835/PREX1). The biological pathways underpinning the contribution to MM or MGUS susceptibility require further studies.
We report heritability estimates for MGUS of 15% to 17%, which are similar to that of MM. Additionally, the estimated genetic correlation (the proportion of variance that MM and MGUS share due to common genetic causes) was 55%. This supports a strong overlap between the common genetic influences on MM and MGUS. At the same time, coheritability between MM and MGUS is not complete, suggesting some common variants may be unique to MGUS and allow for distinguishing between the 2 disease states. If such variants can be identified, it could be biologically interesting and potentially clinically useful, especially in terms of MGUS progression.
MGUS progresses to symptomatic MM are a rate of 1% per year.1,2 Our secondary analyses assessed possible differences in common genetic susceptibility between MGUS cases that progressed to MM compared with those that did not. Although power and sample size was limited for these comparisons, we observed similar MM-PRS in progressors (MM) compared with nonprogressors and a 6% (albeit nonsignificant) increased MM risk per SD of MM-PRS when comparing progressors with non-progressors. We could not fully evaluate the effect of MM-PRS on progression because of the limited number of progression events. Additionally, MGUS is extremely heterogeneous, and our convenience sample of clinical MGUS cases in this study had a higher rate of progression than what is known for the general population.
Larger studies of more representative samples of MGUS, including those that follow up for progression, will be better positioned to assess the importance of the MM-PRS to MGUS and MGUS progression to MM.
A few studies have examined the association of known MM risk SNPs with MGUS. Associations differed by SNP tested, effect size, and association significance (supplemental Table 12).36-38,48 These data are consistent with a polygenic model of disease susceptibility to MGUS and provide support for shared genetic variation influencing MM through predisposition to MGUS.38 Specifically, as suggested by Thomsen et al48 and now our data, a higher OR for a SNP in MGUS compared with MM may imply that the underlying biology predisposes to the onset of MGUS, but not progression to MM, and if the OR for the SNP is equal for MGUS and MM, then the SNP/gene is likely predisposing to MGUS and progression to MM.36-38,48
Two MGUS GWAS studies were previously published in EA populations. In the first study (243 cases/1285 controls from Germany), Thomsen et al36 identified 10 loci for MGUS at P value threshold of <10−5. Three of these replicated in an independent set of Czech MGUS cases (6q26:rs6933936, 7p21:rs10251201, and 8p23:rs974120).36 SNP rs974120 was also associated with MM. In a follow-up MGUS GWAS, 10 new loci were identified for MGUS risk in a large meta-analysis of German (243 cases/1285 controls), Czech (288 cases/600 controls), and Swedish GWASs (461 cases/1025 controls) (P < 10−5). Only 1 of these loci was found to also be associated with MM (ULK4; 3p22:rs9848754).48
Of the 20 MGUS SNPs identified in the studies above, only ULK4 (rs9848754) replicated in our MGUS (OR, 1.23; P = .05) and MM GWAS (OR, 1.19; P = .0006). Like Thomsen et al,36 we observed this variant as the most significant in our MGUS GWAS with a higher effect size in MGUS compared with MM. Larger MGUS data sets are needed to delineate other common germline variants contributing to MGUS susceptibility and progression to MM. Lack of replication of the other MGUS variants in our GWAS could be due to the underlying population stratification within EA or small numbers included in our MGUS GWAS.58-62 Also, MGUS cases are heterogeneous, and the rates of progression were higher in our clinical sample of MGUS with available DNA. These differences between studies could affect the ability to replicate prior findings.
The largest MM GWAS to date reported the GWAS heritability of MM ascribable to all common risk loci as 15.6% (±4.7),24 similar to our estimate of 17%. A large proportion of the heritability of MM risk, therefore, remains unaccounted for, and it has been reported that to identify SNPs explaining 80% of the heritability due to common variants, sample sizes in excess of ∼50 000 are required.24 Some of the missing heritability may be accounted for by less common and/or rare variants. Studies have suggested rare variants contributing to MM susceptibility63-67 in genes including LSD1/KDM1A,63 KIF18A,64 USP45,65 ARID1A,65 CDKN2A,66 and DIS3.67 However, these results require further validation. Therefore, identifying the remaining common and rare variants that contribute to heritability will be important to add to a PRS model for risk prediction.
MGUS is a genetically advanced lesion.68 Cytogenetics and gene expression profiling have found that cytogenetic changes detected in MM cells can also be detected in MGUS cells, and the genetic profile of MGUS cells is more similar to MM cells than normal plasma cells.68 Our work confirms the importance of common genetic variation contributing to MM risk and suggests the MM variants identified to date may predispose to MGUS acting as the precursor event to MM risk through a polygenic model. Further studies are needed to understand the underlying susceptibility of MGUS progression.
For data sharing, e-mail the corresponding author, Celine M. Vachon (e-mail: vachon.celine@mayo.edu).
Acknowledgments
The authors thank all site investigators that contributed to the studies within the Multiple Myeloma Working Group (InterLymph Consortium), staff involved at each site, and most importantly, the study participants for their contributions that made this study possible.
This work was supported in part by the National Institutes of Health, National Cancer Institute (R25 CA092049, P30 CA016672, R01 CA134674, P30 CA042014, R01 CA186646, R21 CA155951, U54 CA118948, P30 CA13148, R25 CA47888, R01 CA235026, R01 CA107476, R01 CA168762, P50 CA186781, and the National Cancer Institute Intramural Research Program), the Leukemia Lymphoma Society (6067-09), Huntsman Cancer Institute pilot funds, the Utah Population Database, the Utah Cancer Registry, a Huntsman Cancer Center support grant, the Utah State Department of Health, the University of Utah, the Canadian Institutes of Health Research (81274), VicHealth, Cancer Council Victoria, the Australian National Health and Medical Research Council (209057, 396414, and 1074383), the Victorian Cancer Registry, the Australian Institute of Health and Welfare, the Australian National Death Index, the Australian Cancer Database, and the Mayo Clinic Cancer Center.
Authorship
Contribution: C.M.V. and S.L.S. conceived and designed the analysis; M.A.T.H., E.E.B., J.N.H., J.J.S., G.G.G., W.C., P.B., X.W., S.V.R., S.K.K., R.L.M., N.J.C., E.Z., C.M.V., and S.L.S. collected and contributed the data; A.I.C.-G. performed the analysis; A.I.C.-G., C.M.C., and S.L.S. wrote the paper; and all authors reviewed, edited, and critiqued the manuscript.
Conflict-of-interest disclosure: The authors declare no competing financial interests.
Correspondence: Celine M. Vachon, Division of Epidemiology, Department of Health Sciences Research, Mayo Clinic, 200 First St SW, Rochester, MN 55905; e-mail: vachon.celine@mayo.edu.

