

Key Points
Ex vivo drug screening defined distinct drug sensitivity patterns and informed personalized therapy selection in treatment-refractory MDS.
Ex vivo drug screening was performed within a clinically actionable time frame (median 15 days) and predicted clinical responses in vivo.

Abstract
Precision medicine approaches such as ex vivo drug sensitivity screening (DSS) are appealing to inform rational drug selection in myelodysplastic syndromes (MDSs) and acute myeloid leukemia, given their marked biologic heterogeneity. We evaluated a novel, fully automated ex vivo DSS platform that uses high-throughput flow cytometry in 54 patients with newly diagnosed or treatment-refractory myeloid neoplasms to evaluate sensitivity (blast cytotoxicity and differentiation) to 74 US Food and Drug Administration–approved or investigational drugs and 36 drug combinations. After piloting the platform in 33 patients, we conducted a prospective feasibility study enrolling 21 patients refractory to hypomethylating agents (HMAs) to determine whether this assay could be performed within a clinically actionable time frame and could accurately predict clinical responses in vivo. When assayed for cytotoxicity, ex vivo drug sensitivity patterns were heterogeneous, but they defined distinct patient clusters with differential sensitivity to HMAs, anthracyclines, histone deacetylase inhibitors, and kinase inhibitors (P < .001 among clusters) and demonstrated synergy between HMAs and venetoclax (P < .01 for combinations vs single agents). In our feasibility study, ex vivo DSS results were available at a median of 15 days after bone marrow biopsy, and they informed personalized therapy, which frequently included venetoclax combinations, kinase inhibitors, differentiative agents, and androgens. In 21 patients with available ex vivo and in vivo clinical response data, the DSS platform had a positive predictive value of 0.92, negative predictive value of 0.82, and overall accuracy of 0.85. These data demonstrate the utility of this approach for identifying potentially useful and often novel therapeutic drugs for patients with myeloid neoplasms refractory to standard therapies.
Introduction
Myelodysplastic syndromes (MDSs) and acute myeloid leukemia (AML) are heterogeneous myeloid neoplasms characterized by impaired maturation and/or excessive proliferation of dysfunctional hematopoietic stem and progenitor cells, leading to ineffective hematopoiesis and peripheral blood cytopenias.1 Approximately one-third of patients with MDS will progress to AML, and the risk will vary by the percentage of bone marrow blasts, depth of cytopenias, and cytogenetic abnormalities as defined by the International Prognostic Scoring System-Revised (IPSS-R).2 Advances in next-generation sequencing (NGS) over the past decade have led to the identification of more than 40 recurrent somatic mutations, which are present in more than 90% of patients with MDS and AML and have implicated novel pathways in disease pathogenesis, including epigenetic regulation, RNA splicing, histone modification, transcription, growth factor signaling, the cohesin complex, and DNA repair.3-5 Somatic mutations may also strongly influence prognosis and responsiveness to various drugs and allogeneic hematopoietic cell transplantation (allo-HCT).6-10
The hypomethylating agents (HMAs) azacitidine and decitabine are the standard first-line therapy for most patients with higher-risk MDS and older adults with AML who are ineligible for intensive chemotherapy. Approximately half of MDS patients respond to HMAs, but the median duration of response is suboptimal at 10 to 14 months.11-13 Limited treatment options are available for patients with HMA-refractory MDS, and the prognosis is poor with median overall survival (OS) of less than 6 months.14,15 Much of the challenge in treating MDS and AML relates to marked biologic heterogeneity with different cytogenetic abnormalities and somatic mutations associated with distinct clinical phenotypes.7 Numerous preclinical studies and clinical trials have sought to target specific biologic pathways such as the spliceosome complex, epigenetic regulation, histone modification, growth factor signaling, and others.16 However, most cases of MDS and AML are genomically complex with multiple cooperating mutations, which may limit the effectiveness of therapies that target a single pathway.17
A precision medicine approach is appealing in MDS and AML, given the heterogeneity of these diseases, the limited number of conventional treatment options available (particularly for MDS), and the ease of access to peripheral blood and bone marrow aspirate samples. Ex vivo drug sensitivity screening (DSS) represents one such approach, in which viable blasts from the peripheral blood or bone marrow are incubated with various therapeutic compounds as single agents or in combination. Ex vivo responses are then assessed by different measures of cell viability, cell cycle arrest, apoptosis, and/or differentiation. Newer fully automated techniques that use high-throughput flow cytometry have improved upon older methods and can now identify potentially active drugs in refractory AML patients.18-20 Multiple studies in patients with refractory acute leukemia or multiply relapsed lymphomas have demonstrated the ability of ex vivo DSS to predict clinical therapeutic responses in vivo.21-23
We report our experience using a novel, fully automated ex vivo DSS platform in 54 patients with newly diagnosed or treatment-refractory myeloid neoplasms (predominantly MDSs) to evaluate sensitivity to a large panel of US Food and Drug Administration–approved or investigational drugs and drug combinations. After piloting the platform in 33 primary patient specimens, we conducted a prospective feasibility study enrolling 21 patients with HMA-refractory myeloid neoplasms to determine whether the assay results could be returned within a clinically actionable time frame and identify potentially useful therapies. Finally, we evaluated the ability of this platform to accurately predict clinical therapeutic responses in vivo.
Methods
Patients
All patients were evaluated at the Stanford University Medical Center between September 2016 and March 2019 and had a diagnosis of MDS, MDS/myeloproliferative neoplasm (MPN), or AML per the 2016 World Health Organization classification for myeloid neoplasms.1 All patients provided informed consent in accordance with the Declaration of Helsinki and were enrolled in protocols approved by the Stanford University Institutional Review Board.
Ex vivo DSS
Ex vivo DSS was performed at Notable Labs (Foster City, CA) using a fully automated platform. Fresh bone marrow aspirates and/or peripheral blood specimens were red blood cell lysed and resuspended in StemSpan SFEM II serum-free media (STEMCELL Technologies, Vancouver, BC, Canada) with the following cytokines: rhIL-7, rhG-CSF, rhFLT-3, rhSCF, rhTPO (Miltenyi Biotec); rhGM-CSF, rhIL-3, rhIL-6 (R&D Systems) and penicillin and streptomycin (Corning Life Sciences). The samples were then plated in 384-well microtiter plates (15 000 cells per well) and screened against a collection of up to 74 single agents and 36 drug combinations in triplicate. For paucicellular specimens, not all drugs were screened; the most clinically relevant agents and combinations were prioritized according to an established drug priority shown in supplemental Table 1. Specimens were treated for 72 hours and assayed using high-throughput, multi-parametric flow cytometry for blast cytotoxicity and differentiation.
Flow cytometry analysis and cell procurement
Hematopoietic cells were stained with the following antibodies to identify blasts, as well as other immune components: CD19 PACBLUE, CD3 PACBLUE, CD38 BV785 (BioLegend), CD33 BV510, CD34 BV605, CD11B APC-CY7 (BD Bioscience), CD45 FITC, CD14 PE, CD66B PE-CY7, HLA-DR APC (eBioscience), and DAPI (Sigma). Cells were then incubated for 20 minutes at 4°C and analyzed on an iQue Plus flow cytometer. The total blast population was defined by CD45, blast markers (CD34, CD33, and/or HLA-DR, using a Boolean OR gate), and by forward and side scatter. Viability of total blasts, normalized to vehicle control (dimethyl sulfoxide) was used to evaluate cytotoxicity. Differentiation was evaluated by identifying blast cells that expressed one of the following phenotypic markers of differentiation: CD11B, CD14, and/or CD38 (high) (using a Boolean OR gate) (supplemental Figure 1).
Data preprocessing
Computational analyses were performed in Python v.3.7.3 unless otherwise noted. Normalized blast counts were calculated for each patient and drug combination by dividing the mean blast count (of triplicates) in wells treated with a drug by the mean of vehicle control wells. Normalized blast counts were then log2 transformed for downstream analysis.
Clustering patients and drugs
Both patients and drugs were grouped using hierarchical clustering as implemented in the scipy (v.1.3.1) package.24 Dendrograms were generated with the Euclidean distance metric and the Ward minimum variance method for linkage.25 Missing log2-transformed normalized total blast values were imputed using matrix completion via nuclear norm minimization using the cvxpy (v.1.0.25) package (see supplemental Methods).26,27 The resulting linkage matrices and the log2-transformed normalized blast counts were supplied to seaborn (v.0.9.0) to generate heat maps. For plotting, values for each drug or combination were z-score transformed across patients. A 1-way analysis of variance (ANOVA) was used to identify drug classes with variable sensitivity across clusters and to identify associations between cluster and clinical variables. Significant associations found via ANOVA were then followed by post hoc pairwise Tukey’s honest significant difference tests.28 For the heat map that evaluated blast differentiation, linkage matrices from normalized blast counts (as above) were used to generate the same clustering for reference. Values plotted were normalized differentiated blast counts (and were not z-score transformed).
Prospective feasibility study
After piloting the platform, we conducted a prospective feasibility study that enrolled 21 patients with HMA-refractory myeloid neoplasms to determine whether ex vivo DSS could be performed accurately, reproducibly, and effectively for identifying potentially useful drugs within a clinically actionable time frame. Eligible patients had a diagnosis of MDS or MDS/MPN and previous HMA therapy with persistent or progressive disease. During the screening visit, peripheral blood and bone marrow aspirate samples were collected and analyzed for morphology, cytogenetics, gene mutation abnormalities by NGS (596-gene panel; Tempus, Chicago, IL) and were procured for ex vivo DSS.
For each patient, once the gene panel and ex vivo DSS results were available, we (M.A.S., A.A., J.L.Z., and P.L.G.) met as a tumor board (TB) to review the clinical, genomic, and functional data for making recommendations for personalized treatment. The TB deliberation process is illustrated in supplemental Figure 2. Three treatment regimens were selected for each patient, and they considered a combination of (1) ex vivo drug sensitivity (cytotoxicity and differentiation), (2) patient factors (age, performance status, comorbidities), (3) disease factors (cytogenetics, mutations, blast count), and (4) previous treatment and response history. Ex vivo cytotoxicity results were prioritized for patients with ≥5% blasts for whom the primary goal of therapy was to reduce the risk of leukemic transformation, whereas ex vivo differentiation was prioritized for patients with <5% blasts for whom the primary goal was to improve cytopenias. Patients who were found to have potentially actionable mutations by NGS were also considered for available targeted therapies or investigational agents on active clinical trials. Because this was primarily a feasibility study, patients were not required to follow TB recommendations.
The primary end point was the feasibility of selecting personalized treatment regimens within a clinically actionable time frame (defined as ≤30 days after bone marrow biopsy). Secondary end points included the response rate to the next line of therapy, progression-free survival (PFS), and OS for the patients receiving TB-guided treatment. Responses were defined by the 2006 International Working Group response criteria for MDS.29 The Kaplan-Meier method was used for PFS and OS estimates, censoring patients at the time of transplantation for those who underwent allo-HCT.
Clinical outcome correlation statistical analysis
The association between ex vivo and in vivo responses was evaluated for patients who were treated with drugs or combinations that were tested in the ex vivo assay and who were clinically evaluable for response per the 2006 International Working Group criteria. For each drug or combination analyzed, an outlier-robust drug sensitivity score was calculated by subtracting the biweight location (across all values in the study for a particular drug or drug combination) from the normalized count and dividing by the biweight scale.30 Each patient was then assigned the drug sensitivity score corresponding to the drug the patient received. This score was compared with the actual clinical response (responder or nonresponder) by creating a receiver operating characteristic curve and calculating the area under the curve. To set a cut point for the drug sensitivity score, Youden’s J statistic was maximized over all of the drug sensitivity score values of the data.31 Positive predictive value (PPV), negative predictive value (NPV), and accuracy were calculated using the determined cut point. Then, 1000 bootstrap replicates were used to calculate confidence intervals (CIs) for each metric.32
Results
Patient characteristics
Ex vivo DSS was performed in a total of 54 patients with myeloid neoplasms, including pilot and feasibility cohorts of 33 and 21 patients, respectively (supplemental Figure 3). The baseline patient characteristics are summarized in Table 1. The median age was 75 years (range, 23-90 years), and 76% of patients were male. In all, 61% had MDS (mostly higher risk by IPSS-R), 20% had an MDS/MPN overlap disorder, and 19% had AML (mostly secondary AML with antecedent MDS). A total of 59% of patients had previously been treated with an HMA. Bone marrow aspirates were used for ex vivo DSS in 78% of the patients, and peripheral blood specimens were used for the remaining 22%, mainly for patients with paucicellular marrow aspirates, a dry tap, or AML patients with high circulating blast counts. A high level of concordance was observed between ex vivo sensitivity evaluated from marrow aspirate and peripheral blood specimens in patients who had testing performed on both cell sources (correlation between bone marrow and peripheral blood for 7 patients: 0.58, 0.72, 0.73, 0.95, 0.96, 0.98, 0.99; combined Pearson correlation P = 2.5 × 10−210 [Stouffer’s method]).
Patient characteristics
| Characteristic | All patients (N = 54) | Feasibility cohort (n = 21) | ||||||
|---|---|---|---|---|---|---|---|---|
| No. | % | Median | Range | No. | % | Median | Range | |
| Age, y | 75 | 23-90 | 76 | 55-87 | ||||
| Sex | ||||||||
| Male | 41 | 76 | 15 | 71 | ||||
| Female | 13 | 24 | 6 | 29 | ||||
| Diagnosis | ||||||||
| AML | 10 | 19 | 1 | 5 | ||||
| De novo AML | 4 | 7 | 0 | 0 | ||||
| Secondary AML* | 6 | 11 | 1 | 5 | ||||
| MDS | 33 | 61 | 17 | 81 | ||||
| Lower-risk MDS (IPSS-R <4) | 12 | 22 | 5 | 24 | ||||
| Higher-risk MDS (IPSS-R ≥4) | 21 | 39 | 12 | 57 | ||||
| MDS/MPN | 11 | 20 | 3 | 14 | ||||
| CMML | 4 | 7 | 1 | 5 | ||||
| Other MDS/MPN | 7 | 13 | 2 | 9 | ||||
| Prognostic factor | ||||||||
| Adverse cytogenetics or mutations† | 28 | 52 | 11 | 52 | ||||
| Bone marrow blast percent | 8 | 1-90 | 5 | 1-31 | ||||
| No. of mutations‡ | 2 | 0-6 | 2 | 0-6 | ||||
| Frequent mutations | ||||||||
| TET2 | 12 | 22 | 5 | 24 | ||||
| ASXL1 | 11 | 20 | 5 | 24 | ||||
| DNMT3A | 10 | 19 | 4 | 19 | ||||
| STAG2 | 9 | 17 | 5 | 24 | ||||
| SF3B1 | 9 | 17 | 2 | 10 | ||||
| RUNX1 | 8 | 15 | 4 | 19 | ||||
| BCOR | 8 | 15 | 2 | 10 | ||||
| NRAS | 8 | 15 | 1 | 5 | ||||
| SRSF2 | 7 | 13 | 4 | 19 | ||||
| KRAS | 7 | 13 | 2 | 10 | ||||
| TP53 | 6 | 11 | 1 | 5 | ||||
| EZH2 | 5 | 9 | 2 | 10 | ||||
| CEBPA | 5 | 9 | 2 | 10 | ||||
| U2AF1 | 4 | 7 | 2 | 10 | ||||
| JAK2 V617F | 3 | 6 | 1 | 5 | ||||
| FLT3-ITD | 3 | 6 | 0 | 0 | ||||
| Previous HMA therapy | ||||||||
| Yes | 32 | 59 | 21 | 100 | ||||
| No | 22 | 41 | 0 | 0 | ||||
CMML, chronic myelomonocytic leukemia.
Includes patients with an antecedent myeloid neoplasm or therapy-related AML.
For MDS and MDS/MPNs, adverse cytogenetics were defined by IPSS-R and adverse mutations included TP53, EZH2, ETV6, RUNX1, and ASXL1; for AML, adverse cytogenetics and mutations were defined by the 2017 European LeukemiaNet criteria.
Includes pathogenic and likely pathogenic mutations and excludes variants of unknown significance.
Ex vivo DSS defined novel drug sensitivity patterns in myeloid neoplasms
Excluding patients with greater than 50% of drugs not tested (n = 9) or HMA-venetoclax combinations not tested (n = 8), 37 patients had complete ex vivo DSS performed for 31 different drugs and drug combinations (supplemental Figure 3). Thirty-four of these patients had MDS and the remaining 3 had MDS/MPN. When assayed for cytotoxicity, drug sensitivity patterns were heterogeneous but were clustered into 3 clinically distinct groups (Figure 1). Cluster 1 demonstrated a more resistant signature, particularly for cytotoxic chemotherapy, HMAs, and HMA-venetoclax combinations. In contrast, clusters 2 and 3 demonstrated significantly greater sensitivity to HMAs, anthracyclines, tyrosine kinase inhibitors (TKIs), and mammalian target of rapamycin (mTOR) inhibitors (P < .001 for all comparisons; Tukey’s honest significant difference) (Figure 2). Clusters 2 and 3 were distinguished primarily by the significant difference in sensitivity to histone deacetylase (HDAC) inhibitors (P < .001). Importantly, even among the more resistant cluster 1, nearly all evaluated patients demonstrated sensitivity to multiple drugs. For example, a small subgroup of patients in cluster 1 demonstrated marked ex vivo sensitivity to rucaparib, a poly (ADP ribose) polymerase (PARP) inhibitor, and bortezomib, a proteasome inhibitor. Several clinical and biologic variables correlated with specific clusters, with a higher frequency of ASXL1 mutations (χ2 test P = .009) and higher IPSS-R scores (P = .028) observed in cluster 2 (supplemental Table 2). Previous exposure to HMAs did not correlate with cluster, but a trend toward greater ex vivo HMA resistance was observed among patients with clinically HMA-refractory disease compared with patients who were responsive to HMAs (supplemental Figure 4). When assayed for differentiation, 3 evaluated drugs (tretinoin, calcitriol, and dexamethasone) consistently demonstrated the greatest impact on blast differentiation (supplemental Figure 5).

Distinct patient clusters defined by differential ex vivo drug sensitivity. Heat map shows ex vivo drug sensitivity (red) or resistance (blue) to a panel of 31 unique drugs or drug combinations (rows) in 37 patients with myeloid neoplasms (columns), including 34 patients with MDS and 3 patients with MDS/MPN. Patients were clustered on the basis of differential ex vivo drug sensitivity when assayed for cytotoxicity and blast viability using hierarchical clustering (Euclidean distance metric, Ward linkage criterion). Cell color indicates normalized blast percentage (z-score transformed) compared with vehicle control. Rows above the heat map indicate relevant clinical and biologic variables and the 3 distinct patient clusters. A higher incidence of ASXL1 mutations (P = .008) and higher IPSS-R scores (P = .02) were observed in cluster 2. IDH, isocitrate dehydrogenase; PARP, poly (ADP ribose) polymerase.
Distinct patient clusters defined by differential ex vivo drug sensitivity. Heat map shows ex vivo drug sensitivity (red) or resistance (blue) to a panel of 31 unique drugs or drug combinations (rows) in 37 patients with myeloid neoplasms (columns), including 34 patients with MDS and 3 patients with MDS/MPN. Patients were clustered on the basis of differential ex vivo drug sensitivity when assayed for cytotoxicity and blast viability using hierarchical clustering (Euclidean distance metric, Ward linkage criterion). Cell color indicates normalized blast percentage (z-score transformed) compared with vehicle control. Rows above the heat map indicate relevant clinical and biologic variables and the 3 distinct patient clusters. A higher incidence of ASXL1 mutations (P = .008) and higher IPSS-R scores (P = .02) were observed in cluster 2. IDH, isocitrate dehydrogenase; PARP, poly (ADP ribose) polymerase.

Patient clusters are associated with distinct ex vivo drug sensitivity profiles. (A) Box-and-whisker plots indicate ex vivo sensitivity to various drug classes for the 3 patient clusters defined in the heat map. Boxes indicate the interquartile range (IQR), whiskers show 1.5 × IQR, and the diamonds outside of this range are considered outliers. (B) Heat map depicting –log10 false discovery rate for cluster mean comparisons. *Adjusted P < .05; **adjusted P < .01; ***adjusted P < .001.
Patient clusters are associated with distinct ex vivo drug sensitivity profiles. (A) Box-and-whisker plots indicate ex vivo sensitivity to various drug classes for the 3 patient clusters defined in the heat map. Boxes indicate the interquartile range (IQR), whiskers show 1.5 × IQR, and the diamonds outside of this range are considered outliers. (B) Heat map depicting –log10 false discovery rate for cluster mean comparisons. *Adjusted P < .05; **adjusted P < .01; ***adjusted P < .001.
Ex vivo DSS demonstrated synergy between HMAs and venetoclax
All 54 patients had ex vivo DSS performed for HMAs and venetoclax as single agents, and HMA-venetoclax combinations were tested in 46 patients. Ex vivo DSS demonstrated synergy between HMAs and venetoclax with both azacitidine-venetoclax and decitabine-venetoclax combinations yielding a significantly greater reduction in blast count than either azacitidine or decitabine alone (P < .01 for both comparisons) (Figure 3). As a single agent, venetoclax had modest to no clinical activity for the majority of patients tested. Ex vivo DSS identified significant variation in sensitivity to HMAs and HMA-venetoclax combinations, with subgroups of patients demonstrating more robust ex vivo sensitivity whereas others had only modest or no sensitivity.
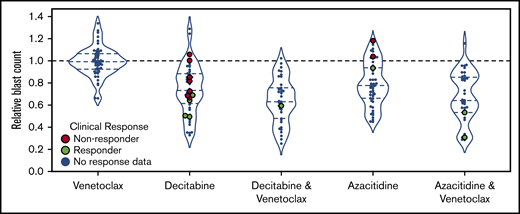
Ex vivo drug screening demonstrates synergy between HMAs and venetoclax. Ex vivo drug sensitivity is shown for 54 patients tested with azacitidine, decitabine, and venetoclax as single agents and for 46 patients tested with venetoclax in combination with azacitidine or decitabine. HMA-venetoclax combinations yielded a greater reduction in blast count compared with single agent therapy with an HMA or venetoclax (P < .01 for all combinations vs single agents; mixed effects linear model). Patients who were treated with 1 of these agents or combinations and who were evaluable for clinical response are highlighted in green (indicating clinical responders; n = 8) or in red (indicating nonresponders; n = 9). The remaining patients are indicated in blue.
Ex vivo drug screening demonstrates synergy between HMAs and venetoclax. Ex vivo drug sensitivity is shown for 54 patients tested with azacitidine, decitabine, and venetoclax as single agents and for 46 patients tested with venetoclax in combination with azacitidine or decitabine. HMA-venetoclax combinations yielded a greater reduction in blast count compared with single agent therapy with an HMA or venetoclax (P < .01 for all combinations vs single agents; mixed effects linear model). Patients who were treated with 1 of these agents or combinations and who were evaluable for clinical response are highlighted in green (indicating clinical responders; n = 8) or in red (indicating nonresponders; n = 9). The remaining patients are indicated in blue.
Feasibility study of personalized therapy guided by ex vivo DSS
After initially piloting the ex vivo DSS assay in 33 primary patient specimens, we conducted a prospective feasibility study enrolling 21 patients with HMA-refractory myeloid neoplasms to determine whether ex vivo DSS could be performed within a clinically actionable time frame and whether this approach could guide personalized therapy and enhance treatment recommendations. Baseline characteristics of patients in the feasibility study are summarized in Table 1. The median age was 76 years (range, 55-87 years), and 71% of patients were male. Seventeen patients had MDSs, 3 had MDS/MPN, and 1 had progressed from MDS to AML. In all, 76% had higher-risk disease by IPSS-R, 57% had excess blasts, and 52% had adverse cytogenetics or mutations.
Ex vivo DSS results were available at a median of 15 days (range, 13-24 days) after the initial study bone marrow aspirate (Table 2). NGS results were available at a median of 14.5 days (range, 5-30 days). TB review was conducted within 2 days after the ex vivo DSS and NGS testing results were available. TB recommendations varied among patients and encompassed numerous drug classes, including targeted therapies, cytotoxic chemotherapy, differentiative agents, HMAs, and androgens as single agents or in combination. For higher-risk patients, the most common TB recommendations included venetoclax in combination with HMAs or low-dose cytarabine, or TKIs such as sorafenib, ruxolitinib, or midostaurin as single agents or in combination. For lower-risk patients, common TB recommendations included differentiative agents (eg, calcitriol and tretinoin), lenalidomide, and danazol.
Assay turnaround time and tumor board recommendations for feasibility cohort
| No. | % | Median | Range | |
|---|---|---|---|---|
| Turnaround time from study bone marrow biopsy, d | ||||
| NGS panel (596 genes) | 14.5 | 8-30 | ||
| Ex vivo drug sensitivity screen | 15 | 13-24 | ||
| Drug recommendations from tumor board* | ||||
| HMA + venetoclax | 10 | 48 | ||
| Calcitriol (single agent or in combination) | 8 | 38 | ||
| Sorafenib (single agent or in combination) | 5 | 24 | ||
| Tretinoin (single agent or in combination) | 5 | 24 | ||
| Cytarabine + venetoclax | 4 | 19 | ||
| Lenalidomide | 4 | 19 | ||
| Ruxolitinib (single agent or in combination) | 3 | 14 | ||
| Danazol (in combination with tretinoin or calcitriol) | 3 | 14 | ||
| Panobinostat (single agent or in combination) | 3 | 14 | ||
| Ixazomib + dexamethasone | 2 | 10 | ||
| Midostaurin (single agent or in combination) | 2 | 10 | ||
| Everolimus | 2 | 10 |
Includes drugs or drug combinations recommended as first-, second-, or third-line therapy by the tumor board (a complete list of tumor board recommendations for each patient is provided in supplemental Table 3).
Eight patients in our feasibility study received subsequent therapy informed by our TB recommendations (Table 3). Of these 8 patients, 6 (75%) responded to the recommended therapy, including 3 patients with a complete response (CR), 2 with a partial response, and 1 with hematologic improvement. The other 2 patients had stable disease. One patient who achieved a CR after low-dose cytarabine and venetoclax subsequently underwent allo-HCT and remained in CR for more than 1 year after receiving a transplant. For the patients receiving TB-guided therapy, at a median follow-up of 13 months (range, 4-20 months), the 1-year PFS and OS estimates were 73% and 88%, respectively (supplemental Figure 6). The 13 patients who did not receive TB-guided therapy elected best supportive care (n = 5), hospice (n = 3), other approved therapies (n = 3), a clinical trial of the spliceosome modulator H3B-8800 (n = 1), or allo-HCT without bridging therapy (n = 1). TB recommendations and outcomes for all 21 feasibility study patients are summarized in supplemental Table 3. Representative ex vivo DSS results for 2 patients on the feasibility study are shown in supplemental Figure 7. The clinical history and TB review process for a representative patient in our feasibility cohort are illustrated in supplemental Figure 8.
Characteristics and outcomes of feasibility study patients who received tumor board-guided therapy
| Age, y | Sex | Diagnosis | Cytogenetic abnormalities and mutations | IPSS-R score | Tumor board recommendations and next line of therapy (bold) | Response to next line of therapy |
|---|---|---|---|---|---|---|
| 77 | F | MDS/MPN | +1q, +1p, ASXL1, STAG2, SF3B1, KRAS, NRAS, CEBPA | 5.5 | 1. Azacitidine-venetoclax | CR |
| 2. Bortezomib-dexamethasone | ||||||
| 3. Sorafenib-dexamethasone | ||||||
| 67 | M | MDS-EB2 | TET2 | 4.0 | 1. Cytarabine-venetoclax | CR |
| 2. Sorafenib-venetoclax | ||||||
| 3. Azacitidine-sorafenib | ||||||
| 79 | M | MDS-MLD | t(6;21), +15, -Y, PBRM1 | 4.0 | 1. Azacitidine-venetoclax | CR |
| 2. Cytarabine-venetoclax | ||||||
| 3. Mivebresib | ||||||
| 62 | M | MDS-EB1 | −20q, U2AF1, TET2 | 5.0 | 1. Decitabine | PR |
| 2. Panobinostat | ||||||
| 3. Belinostat | ||||||
| 78 | M | MDS-EB1 | −7q, DNMT3A, DDX41 | 6.5 | 1. Danazol-tretinoin | SD |
| 2. Fostamatinib | ||||||
| 3. Azacitidine-venetoclax | ||||||
| 59 | M | MDS-EB1 | CBL | 4.0 | 1. Azacitidine | SD |
| 2. Azacitidine-venetoclax | ||||||
| 3. Everolimus | ||||||
| 75 | M | MDS-MLD | inv(3p) | 2.5 | 1. Calcitriol-eltrombopag | HI |
| 2. Calcitriol-panobinostat | ||||||
| 3. Olaparib | ||||||
| 80 | M | MDS-EB1 | inv(9p), −20q, BCOR, U2AF1, DNMT3A, RUNX1, WT1 | 4.5 | 1. Azacitidine | PR |
| 2. Azacitidine-venetoclax | ||||||
| 3. Lenalidomide |
EB, excess blasts; F, female; HI, hematologic improvement; M, male; MLD, multilineage dysplasia; PR, partial response; SD, stable disease.
Ex vivo DSS predicted clinical therapeutic responses in vivo
Twenty-one patients (including 8 patients on the feasibility study) were treated with 1 of the drugs or combinations tested which allowed for an assessment of the association between ex vivo and in vivo responses (Figure 4). Most of these patients were treated with HMAs (n = 14) or HMA-venetoclax combinations (n = 3), and the remaining patients were treated with low-dose cytarabine-venetoclax (n = 2), cytarabine-clofarabine (n = 1), or bortezomib-dexamethasone (n = 1). Correlating ex vivo drug sensitivity scores with in vivo responses, a receiver operating characteristic curve was generated that demonstrated an area under the curve of 0.87 (95% CI, 0.72-0.98). Using an optimal cut point as determined by maximizing Youden’s J statistic (z-score of −0.3), 10 of 10 patients were correctly identified as nonresponders, whereas 7 of 11 patients were correctly identified as responders. Four of 11 responding patients were incorrectly predicted to be nonresponders (false negatives). Overall, in this discovery cohort, ex vivo DSS had a PPV of 0.92 (95% CI, 0.69-1.00), NPV of 0.82 (95% CI, 0.58-1.00), and overall accuracy of 0.85 (95% CI, 0.71-0.95).

Performance of ex vivo drug screen in predicting clinical responses in vivo. The association between ex vivo and in vivo responses are shown for 21 patients with available clinical response data. Ex vivo normalized blast counts corresponding to each patient’s administered drugs were transformed using a robust z score to produce a drug sensitivity score. (A) A receiver operating characteristic (ROC) curve showing performance of score in predicting response after treatment. Area under the curve, 0.87 (95% CI, 0.72-0.98). (B) Optimal cut point as determined by maximizing Youden’s J statistic. (C) Violin plots comparing drug sensitivity scores between clinical responders (orange) and nonresponders (blue). Concordance (light gray) or discordance (dark gray) between ex vivo and in vivo responses are indicated. Dashed line represents optimal cut point determined in panel B. (D) Violin plots comparing normalized blast counts (without z-score transformation) between clinical responders (orange) and nonresponders (blue). Concordance (light gray) or discordance (dark gray) between ex vivo and in vivo responses indicated are based on predictions from panel C. Performance metrics for discovery data set: mean PPV, 0.92 (95% CI, 0.69-1.00); mean NPV, 0.82 (95% CI, 0.58-1.0); mean accuracy, 0.85 (95% CI, 0.71-0.95).
Performance of ex vivo drug screen in predicting clinical responses in vivo. The association between ex vivo and in vivo responses are shown for 21 patients with available clinical response data. Ex vivo normalized blast counts corresponding to each patient’s administered drugs were transformed using a robust z score to produce a drug sensitivity score. (A) A receiver operating characteristic (ROC) curve showing performance of score in predicting response after treatment. Area under the curve, 0.87 (95% CI, 0.72-0.98). (B) Optimal cut point as determined by maximizing Youden’s J statistic. (C) Violin plots comparing drug sensitivity scores between clinical responders (orange) and nonresponders (blue). Concordance (light gray) or discordance (dark gray) between ex vivo and in vivo responses are indicated. Dashed line represents optimal cut point determined in panel B. (D) Violin plots comparing normalized blast counts (without z-score transformation) between clinical responders (orange) and nonresponders (blue). Concordance (light gray) or discordance (dark gray) between ex vivo and in vivo responses indicated are based on predictions from panel C. Performance metrics for discovery data set: mean PPV, 0.92 (95% CI, 0.69-1.00); mean NPV, 0.82 (95% CI, 0.58-1.0); mean accuracy, 0.85 (95% CI, 0.71-0.95).
Serial ex vivo DSS demonstrated dynamic changes in drug sensitivity after treatment
Nine patients had ex vivo DSS performed on serial peripheral blood and/or marrow aspirate specimens. Dynamic changes in ex vivo drug sensitivity were observed in several patients after treatment and at the time of relapse. For example, a 77-year-old woman with high-risk MDS/MPN, 17% circulating blasts, and progressive disease after 6 cycles of decitabine demonstrated marked ex vivo sensitivity to azacitidine-venetoclax on her initial marrow aspirate specimen after enrolling on our feasibility study. She subsequently received 2 cycles of azacitidine-venetoclax with clearance of circulating blasts and a repeat bone marrow biopsy demonstrating a CR. Nine months later, she relapsed with progressive cytopenias and a rising blast count with a repeat marrow aspirate specimen that demonstrated new ex vivo resistance to azacitidine-venetoclax but persistent sensitivity to other agents such as fluorouracil (supplemental Figure 9).
Discussion
This study demonstrated the feasibility of a novel ex vivo DSS platform using high-throughput flow cytometry to inform personalized therapy for patients with myeloid neoplasms, predominantly higher-risk MDS. Previous studies have evaluated various ex vivo DSS methodologies in hematologic malignancies, including AML,33-35 acute lymphoblastic leukemia,22 chronic lymphocytic leukemia,36 non-Hodgkin lymphoma,23 and multiple myeloma,37 but to our knowledge, this is the first study focused primarily on patients with MDS. In contrast to previous studies that used bulk cytotoxicity assays, our flow cytometry-based platform allowed for an assessment of both cytotoxicity and differentiation with specificity for the myeloid blast population.
Our ex vivo assay identified distinct patient clusters with differential sensitivity to various drug classes, including HMAs, HMA-venetoclax combinations, cytotoxic chemotherapy, TKIs, mTOR inhibitors, and other small molecules. Importantly, even among patients with the most resistant ex vivo signatures (as observed in cluster 1), nearly all evaluated patients demonstrated sensitivity to multiple tested drugs. Patient clusters defined by ex vivo DSS were associated with specific clinical and biologic variables, including IPSS-R score and ASXL1 mutation status. In general, there was an association between higher IPSS-R scores and greater sensitivity to cytotoxic agents, which may indicate the more proliferative nature of MDS blasts in higher-risk patients, who frequently had higher blast counts in this study. It is particularly notable that ASXL1 mutations were enriched in cluster 2, which demonstrated significantly greater ex vivo sensitivity to HDAC inhibitors than clusters 1 or 3. This association between ASXL1 mutations and ex vivo sensitivity to HDAC inhibitors is consistent with previous studies such as a landmark analysis from the Beat AML trial.38 That trial also identified associations between RUNX1 mutations and ex vivo sensitivity to mTOR inhibitors, RAS pathway mutations and sensitivity to MAP kinase inhibitors, and TP53 mutations associated with a broad pattern of resistance, suggesting an important relationship between genomics and drug sensitivity.38 Our ex vivo assay also recapitulated synergy between HMAs and venetoclax, as previously described in both preclinical studies and clinical trials in MDS and AML.39-43
Our prospective feasibility study demonstrated that ex vivo DSS can be performed within a clinically actionable time frame (median 15 days), and these data informed recommendations by the TB for personalized treatment. Six (75%) of 8 evaluable patients responded to TB-guided therapy, including 3 patients who achieved a CR, and the observed 1-year PFS and OS estimates of 73% and 88%, respectively, compare favorably to historical patients with HMA-refractory MDS (median OS, <6 months).14 In general, the ex vivo DSS results were most clinically valuable for higher-risk MDS patients with excess blasts to identify drugs or combinations to reduce the blast count. Several patients on our feasibility study were correctly identified as responders to HMA-venetoclax or cytarabine-venetoclax combinations, achieving a CR and allowing 1 of our high-risk HMA-refractory MDS patients to be bridged to allo-HCT. In our cohort of 21 patients with available clinical response data, ex vivo responses accurately predicted in vivo responses with an overall accuracy of 85%.
Ex vivo DSS results seemed to be less clinically valuable for MDS patients with low blast counts in our study. For this patient population in whom the primary goal of therapy was improving cytopenias rather than reducing the blast count, the TB frequently recommended differentiative agents such as tretinoin and calcitriol, often in combination with danazol and/or hematopoietic growth factors. Although tretinoin and calcitriol consistently demonstrated evidence of ex vivo differentiation, we did not observe clinically significant improvements in cytopenias in patients treated with these agents. The differentiation-inducing properties of calcitriol are well described in MDS and AML, but a clinically meaningful benefit may be limited by failure to achieve therapeutic concentrations of calcitriol, which may induce clinically significant hypercalcemia.44,45 Greater ex vivo differentiation with calcitriol has been reported for patients with monosomy 7 and del(7q), whereas greater differentiation with tretinoin has been reported in FLT3 wild-type NPM1-mutated AML patients, again suggesting an important relationship between genotype and drug sensitivity.45,46
In patients with serial blood or marrow aspirate specimens, we observed dynamic changes in ex vivo drug sensitivity patterns after treatment and particularly at the time of relapse. Obtaining serial specimens for ex vivo DSS may allow clinicians to adapt treatment regimens in response to changing ex vivo drug resistance patterns. Serial ex vivo drug sensitivity analysis may also provide important insights into mechanisms whereby treatment with 1 drug class may impact sensitivity or resistance to other agents. The observation of emerging resistance patterns after treatment highlights the need for effective drug combinations capable of overcoming drug resistance.
This study has several limitations. In our cohort of 21 patients with available ex vivo and in vivo response data, the majority received treatment with HMAs or HMA-venetoclax combinations, and thus these results should not be extrapolated to other drugs or combinations without further investigation. We are currently accruing additional patients to validate the PPV, NPV, and accuracy of the ex vivo DSS platform and identify the optimal z-score cut point to discriminate between ex vivo responders and nonresponders. The relatively small number of patients in the feasibility study who received TB-guided therapy limits our ability to draw conclusions about the potential clinical benefit of this approach. To further evaluate the clinical utility of this approach, a multicenter randomized trial is planned comparing TB-guided therapy using Notable’s ex vivo DSS platform to a standard of care arm (clinician’s choice of therapy) for patients with HMA-refractory myeloid neoplasms.
In conclusion, we demonstrated the feasibility of using a novel ex vivo DSS platform to identify potentially active drugs and drug combinations and to inform personalized therapy in patients with treatment-refractory myeloid neoplasms. Ex vivo drug sensitivity data were available within a clinically actionable time frame and accurately predicted clinical therapeutic responses in vivo. Ex vivo DSS will likely synergize with genomic data and emerging precision medicine approaches such as in silico computational biology modeling.47,48 Combining both genomics-based and ex vivo functional data may further refine precision therapy, enhance the selection of rational drug combinations, and ultimately improve outcomes for patients with myeloid neoplasms.
Presented in abstract form at the 24th Congress of the European Hematology Association, Amsterdam, The Netherlands, 14 June 2019.
The authors agree to share all publication-related data including deidentified patient data sets and protocols. Please contact Peter L. Greenberg via e-mail at peterg@stanford.edu.
Acknowledgments
The authors thank Jeffrey Sanders and George Yam for helpful technical assistance, and Gabriel Mannis for his helpful comments and review of the manuscript. M.A.S. and A.A. gratefully acknowledge support from the American Society of Hematology Clinical Research Training Institute in developing the pilot and feasibility study protocol.
The study was funded by Notable Labs.
Authorship
Contribution: M.A.S. and P.L.G. wrote the manuscript; S.A.S. and D.H. wrote the methods; M.T.S. ran the ex vivo assay; A.A., M.A.S., P.L.G., M.T.S., A.S.P., and C.G. helped collect and preprocess data; S.A.S. conducted statistical analyses and created the figures; A.A. and P.L.G. designed the feasibility study protocol; M.A.S., A.A., J.L.Z., and P.L.G. met as a tumor board to provide treatment recommendations; and all authors reviewed and approved the final manuscript.
Conflict-of-interest disclosures: M.T.S., S.A.S., A.S.P., C.G., and D.H. are employees of Notable Labs. A.A. served as a consultant for Notable Labs. P.L.G. received research funds for the feasibility study from Notable Labs. The remaining authors declare no competing financial interests.
Correspondence: Peter L. Greenberg, Stanford University Cancer Center, 875 Blake Wilbur Dr, Room 2335, Stanford, CA 94305-5821, e-mail: peterg@stanford.edu.

