

Key Points
Development of anti-FVIII immunoglobulin G is affected by the bacterial composition of the gut microbiota.
Oral supplementation with butyrate, an immunologically active bacterial metabolite, attenuates the FVIII immune response.

Abstract
The development of neutralizing FVIII antibodies is the most serious complication of hemophilia A treatment. The currently known patient- and treatment-related risk factors for inhibitor development do not accurately predict this adverse event in all patients. The composition of the gut microbiota has been shown to influence immune-mediated diseases at distant anatomical sites (eg, lungs, brain, and joints). We demonstrate that a disrupted gut microbiota can be created in a mouse model of hemophilia A using a broad-spectrum antibiotic. Under controlled conditions, this sustained dysbiosis was associated with an increase in splenic B cells and the development of higher titer, FVIII-specific immunoglobulin G antibodies after FVIII challenge. Splenic and mesenteric lymph node cytokines, T cells, and dendritic cells were unaffected before administration of FVIII. However, the immune transcriptome of both aforementioned secondary lymphoid organs was significantly modified. Short-chain fatty acids (SCFAs), which are immunomodulatory microbial metabolites, were depleted in cecal contents of the dysbiotic mice. Furthermore, supplementation of the drinking water with butyrate, the most immunologically active SCFA, successfully achieved attenuation of the FVIII immune response. Collectively, data from this exploratory study suggest that the composition of the gut microbiota alters the FVIII immune response via the action of specific microbial metabolites on the immune cell transcriptome and that oral supplementation with butyrate effectively reduces the FVIII immune response.
Introduction
Hemophilia A (HA) is an X-linked bleeding disorder resulting from deficiency of coagulation factor VIII (FVIII).1 It affects 1 in 5000 male births worldwide,2 and individuals with a severe phenotype require prophylactic treatment with intravenous administration of FVIII to prevent spontaneous bleeding.3 The most serious complication of replacement therapy is the development of neutralizing FVIII antibodies, termed inhibitors, which occur in ∼30% of severe HA cases.4 Inhibitors render factor treatment ineffective and are associated with significant morbidity and cost.5,6 Eradication of inhibitors is practically challenging, expensive, and not always successful.7,8 Thus, preventing inhibitors is very desirable. Although some patient- and treatment-related risk factors for inhibitor development have been identified, they do not accurately predict inhibitor development in all patients.1 Identifying novel, modifiable risk factors may provide strategies to reduce the risk of inhibitor development.
The healthy human gut microbiota harbors ∼1012 cells per gram of intestinal content and is made up of >500 different bacterial species.9 Dysbiosis of the gut microbiota is defined as an imbalance in the expected flora: species that dominate in health become depleted and the usually lesser represented species therefore increase beyond expected levels.10,11 Dysbiosis can lead to pathology at distant anatomical sites, such as the brain, lungs, and joints.12,13 A causal relationship between the gut microbiota and the adaptive immune response to subcutaneously administered immunization has recently been identified in a prospective human study.14 To our knowledge, the gut microbiota in HA patients has not been investigated in the context of alloantibody formation toward FVIII. Therefore, it is feasible that dysbiosis is a contributing factor to this process.
In addition, the gut microbiota is highly variable and vulnerable during the first 2 years of life and is influenced by a variety of external factors (eg, mode of delivery at birth, the environment, diet, microbial exposure, and medications).15-18 This life period also corresponds to the most frequent time of inhibitor development, further supporting the rationale for investigating the microbiota as a potential risk factor.19
We hypothesize that dysbiosis of the gut microbiota is a novel risk factor for inhibitor development in HA. To investigate this, we used a mouse model of HA and induced prolonged gut dysbiosis. After administration of oral antibiotics, mice were housed in isolation to prevent subsequent recovery of the microbiota. Using this model, we showed in this exploratory study that dysbiosis and altered microbial metabolites influence the immune response to FVIII.
Methods
Murine model of HA
C57BL/6 F8 Exon 16 knockout (HA) mice were used in all experiments.20 All mouse experiments were reviewed and approved by the Queen’s University Animal Care Committee.
Gut microbiota modification and treatment protocol
Manipulation of the gut microbiota in HA mice was achieved by administration of the broad-spectrum antibiotic ampicillin by gastric gavage of 0.5 mg (50 mg/kg) every 12 hours for 7 days, beginning at 3 weeks of age. The mice were isolated in sex-matched, individually ventilated, air-filtered cages on the Techniplast IsoCageP-Bioexclusion System positive-pressure rack located in a positive-pressure room throughout the study. All chow and water were autoclaved.
Mouse manipulations were performed in a level 2 biosafety cabinet after sterilization of airtight cages in hydrogen peroxide. Mice were anesthetized with isoflurane, and FVIII was infused via the retroorbital plexus twice a week for 2 weeks with 0.5 IU recombinant FVIII (rFVIII; 0.05 μg or 20 IU/kg in 100 μL volume; Advate; Takeda). The study end point was 2 weeks after the last infusion of FVIII. Blood was collected by inferior vena cava venipuncture into syringes containing 3.2% sodium citrate (.1 volume). Plasma was isolated by centrifugation at 11 500g then stored at −80°C until analysis.
Cecal content sampling and DNA extraction
Mice were euthanized, the cecum dissected, and the contents collected under sterile conditions at 6 weeks of age and at the study end point. Samples were immediately frozen and stored at −80°C until analysis. DNA from 50 mg of cecal contents was isolated from each mouse with the DNeasy PowerSoil Kit (Qiagen).
DNA sequencing of the 16s RNA bacterial ribosomal subunit gene
DNA sequencing was performed by the Centre for the Analysis of Genome Evolution and Function (Toronto, ON, Canada). The V4 hypervariable region of the 16s rRNA gene was amplified with a universal forward-sequencing primer and a uniquely barcoded reverse-sequencing primer, to allow for multiplexing.21 All amplification reactions were performed in triplicate, checked on a 1% agarose Tris-borate-EDTA gel and then pooled. The final library was purified using 0.8X magnetic Ampure XP beads, selecting for the bacterial V4 amplified band. The purified library was quantified and loaded onto a MiSeq system for sequencing, according to the manufacturer’s instructions (Illumina, San Diego, CA). Sequencing was performed using the V2 (150 bp × 2) chemistry.
Analysis of the bacterial microbiome
Bacterial microbiome data were preprocessed with the QIIME 2 (Quantitative Insights Into Microbial Ecology, version 2019.4) pipeline.22 Raw paired-end data were manually imported into QIIME 2 in the PairedEndFastqManifestPhred33 format for Illumina 2.0 and consequently merged using the q2-vsearch plugin (via vsearch join-pairs).23 Quality filtering and trimming of sequence reads was performed via the quality-filter, q-score–joined function, with default settings. Sequences were denoised, and chimeras were removed with the Deblur plugin (via denoise-16S, p-trim-length set at 233).24 Open-reference OTU (operational taxonomic unit) picking and taxonomy assignment was performed against Greengenes 13_8 at 99% identity.25 The taxonomy classification was performed with the naive Bayes classifier (via fit-classifier-naive-Bayes for training and classify-sklearn for application).26 The phylogenetic diversity metrics were generated using the align-to-tree-mafft-fasttree pipeline from the q2-phylogeny plugin.27 Finally, the α- and β-diversity analyses were performed, using the q2‐diversity plugin (see https://github.com/qiime2/q2-diversity/blob/master/q2_diversity/citations.bib). Filtering, cumulative sum scaling normalization, and creation of microbiome visualizations were performed with MicrobiomeAnalyst.28 Cumulative sum scaling normalization was performed to account for slight variability in bacterial load between microbiome samples. Additional plots were made in R Studio using ggplot2 and ComplexHeatMap packages.
Anti-FVIII antibodies and FVIII inhibitor assays
The enzyme-linked immunosorbent assay (ELISA) was used to quantify total FVIII-specific immunoglobulin G (IgG) titers, as previously described.29 In brief, a 96-well plate (Nunc Polysorp) was coated with rFVIII (10 μg/mL). After the samples were blocked with 1% gelatin, they were incubated for 2 hours. Horseradish peroxidase–conjugated goat anti-mouse IgG (Southern Biotech) was used to detect total FVIII-specific IgG. Plates were analyzed after a 30-minute incubation with o-phenylenediamine dihydrochloride (Sigma). Sample results were defined as positive at an optical density >0.3 above the blank sample and the titer reported was the highest dilution at which a given sample was positive. FVIII-specific IgG isotypes were assessed with a standard curve generated with mouse reference serum (Bethyl Laboratories) by using similar techniques.
FVIII inhibitors were measured by a 1-stage, clot-based assay on an automated coagulometer (Siemens BCS XP) after preincubation at 56°C for 30 minutes. Samples were diluted with FVIII-deficient human plasma (Affinity Biologicals) and incubated at 37°C for 2 hours with normal pooled plasma (Affinity Biologicals).
Immune cell phenotyping
Spleens and mesenteric lymph nodes (MLNs) were dissected manually and mechanically dissociated through a 70-μm filter. Spleen cells and MLNs (1 × 10⁶ and 0.5 × 10⁶ cells for spleen and MLNs) were used per sample test, respectively. Samples were blocked with anti-CD16/32 before being stained for extracellular markers. FoxP3 Staining Kit (eBioscience) was used for intracellular staining. Washed cells were analyzed on a MACSQuant Analyzer (Miltenyi) with a minimum of 20 000 events captured per sample. Antibodies to CD4, CD25, FOXP3+, CD25, LAP, CD86, CD103, and B220 were used, along with isotype controls. All reagents and antibodies were purchased from Invitrogen. Data were analyzed with FlowJo (Tree Star).
Cytokine analysis
Spleens were homogenized within a protease inhibitor cocktail (Sigma). Lysates were centrifuged (10 000g for 10 minutes) before being quantified via the Bradford reagent (Bio-Rad). Samples were normalized for protein concentration and analyzed by a multiplex bead-based system (Mouse High Sensitivity T-Cell Discovery Array 18-plex [MDHSTC18] and TGF-β1-3[TGFB1-3]; Eve Technologies). Lipopolysaccharide (LPS) was quantified by Limulus amebocyte lysate (LAL) chromogenic ELISA (Thermo Scientific) and TNF-α via a murine ELISA kit (Invitrogen).
mRNA expression analysis
Spleen and MLNs where manually dissected and stored in RNAlater (Invitrogen). RNA was isolated from whole organs by using the RNeasy Plus Mini Kit (Qiagen), and messenger RNA (mRNA) was analyzed with the NanoString Mouse Immunology panel (NanoString Technologies Inc, Seattle, WA). All data were normalized to 14 housekeeping genes (nSolver). Up- and downregulated genes defined as transcript fold change >1.25 with α = 0.05. Expression data were standardized by calculating z-scores and visualized in a heat map using squared Pearson distance metric with Ward’s clustering method. All figures were created with R Studio V1.2.1335 using the ggplot2 package.
Bacterial metabolite quantification
A cecal slurry was made by mixing cecal contents with sterile phosphate-buffered saline (25% w/v) before homogenization by vortexing for 10 minutes and then centrifugation at 4°C for 10 minutes at 10 000g, to remove the debris. Supernatant was harvested and combined with an internal standard (IS-2; Chenomx) to a concentration of 10% standard to sample. Prepared samples were then analyzed via nuclear magnetic resonance (NMR) at the University of Guelph NMR Centre. Raw data were analyzed and short-chain fatty acids (SCFAs) quantified using Chenomx NMR Suite (Chenomx).
Statistics
Statistical analyses and assumptions were checked and performed using R Studio or GraphPad Prism 7.0, where applicable.
Results
Ampicillin treatment results in sustained dysbiosis and altered FVIII immune response
To produce sustained gut dysbiosis in HA mice, we administered a course of ampicillin at 3 weeks of age followed by maintenance in continuous sterile housing conditions (Figure 1A). We assessed the gut microbiota at 6 weeks of age and at the study end point, to ensure that the observed changes were sustained and not just associated with active antibiotic treatment. Analysis of the bacterial taxa identified by 16s ribosomal RNA revealed marked changes between the 2 cohorts of mice and also between the 6- and 10-week time points that is confirmed by a cluster analysis dendrogram (Figure 1B). Principal coordinates analysis of only 4 to 5 gut microbiota samples per group demonstrated dissimilarities of the microbiota between the ampicillin-treated and control mice, using weighted UniFrac distances as the distance metric (Figure 1C). Each cohort clusters separately with further separation into 4 groups based on sampling at 6 or 10 weeks of age. Thus, ampicillin treatment led to a significant and sustained alteration of the gut flora that persisted throughout FVIII challenging and was still prominent at the study end point. α-Diversity, a metric that measures the intravariability of gut bacteria within a single microbiome sample, was lower for antibiotic-treated mice. Although this diversity increased in these same mice by week 10, suggesting some regrowth, it remained significantly lower than controls (Figure 1D). At the phylum level, there was a sustained depletion in Bacteroides in the ampicillin-treated mice with a corresponding increase in Firmicutes (Figure 1E). Proteobacteria and Deferribacteres were also depleted at 6 weeks of age, although regrowth of Proteobacteria was seen by week 10. Most of the increased Firmicutes are of the Clostridia class. These data show that the ampicillin-induced dysbiosis was successfully achieved and the microbiota in these mice remained significantly dysbiotic in terms of both composition and diversity when compared with controls.
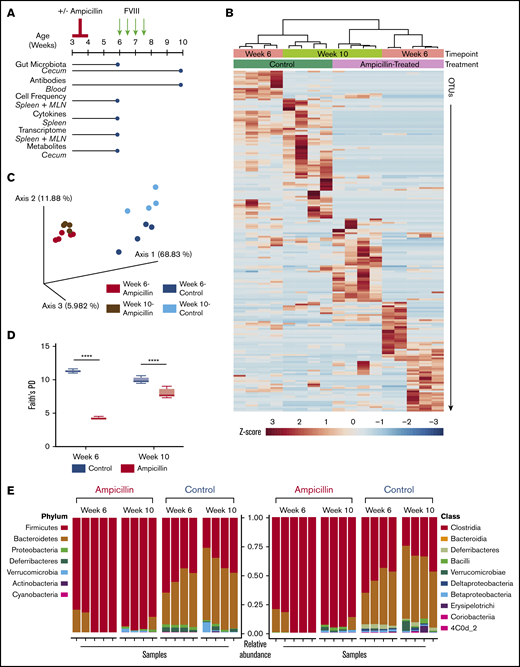
Study overview and effects of ampicillin on the gut microbiome. (A) Study overview. Mice aged 3 weeks were weaned and then immediately commenced treatment with ampicillin, administered every 12 hours by gastric gavage for 7 days (n = 15) or not (n = 14). After a 2-week rest period, mice remaining in the study were challenged with 50 ng IV-administered FVIII. The mice were euthanized and samples collected (blue circles) for analyses at 6 weeks of age, immediately before the FVIII challenge began and at the study end point (10 weeks of age). (B) Differences in the gut microbiota between ampicillin-treated and control mice derived from a heat map of calculated z-scores. Bacterial 16s rRNA was sequenced, and samples were clustered based on study time point (6 weeks vs 10 weeks) and treatment (ampicillin vs control), using Pearson’s distance and Ward’s clustering methods. (C) Principal coordinate analysis based on weighted UniFrac distances of each microbiome sample. (D) α-Diversity was measured by using Faith’s phylogenetic diversity (PD) metric (means compared by unpaired, 2-tailed Student t test). Standard deviations are shown. (E) Relative abundance of bacterial phyla (left) and class (right). Each vertical bar corresponds to an individual sample. Sample size for all microbiome analyses remain consistent (n = 4-5). ****P < .0001.
Study overview and effects of ampicillin on the gut microbiome. (A) Study overview. Mice aged 3 weeks were weaned and then immediately commenced treatment with ampicillin, administered every 12 hours by gastric gavage for 7 days (n = 15) or not (n = 14). After a 2-week rest period, mice remaining in the study were challenged with 50 ng IV-administered FVIII. The mice were euthanized and samples collected (blue circles) for analyses at 6 weeks of age, immediately before the FVIII challenge began and at the study end point (10 weeks of age). (B) Differences in the gut microbiota between ampicillin-treated and control mice derived from a heat map of calculated z-scores. Bacterial 16s rRNA was sequenced, and samples were clustered based on study time point (6 weeks vs 10 weeks) and treatment (ampicillin vs control), using Pearson’s distance and Ward’s clustering methods. (C) Principal coordinate analysis based on weighted UniFrac distances of each microbiome sample. (D) α-Diversity was measured by using Faith’s phylogenetic diversity (PD) metric (means compared by unpaired, 2-tailed Student t test). Standard deviations are shown. (E) Relative abundance of bacterial phyla (left) and class (right). Each vertical bar corresponds to an individual sample. Sample size for all microbiome analyses remain consistent (n = 4-5). ****P < .0001.
To determine whether the dysbiotic microbiota affects the anti-FVIII immune response, we treated both cohorts of mice with 2 biweekly infusions of FVIII and measured anti-FVIII antibodies 2 weeks after the last infusion (Figure 1A). FVIII-specific total-IgG titer was significantly increased in the dysbiotic mice compared with the controls at the study end point (P = .0023; Figure 2A). Although no difference in the incidence of FVIII inhibitory antibodies was observed, significantly higher levels of FVIII inhibitors were also observed in the dysbiotic mice (Figure 2B). It should be noted that by intentional experimental design (selected FVIII dose and route of administration), all mice in this study developed inhibitors. However, a pilot study using the same low dose of FVIII given via tail vein, as opposed to retroorbital delivery, revealed that dysbiosis may also affect the incidence of inhibitors (supplemental Figure 1A-B). End point concentrations of IgG1, IgG2a, and IgG2b were significantly elevated in the dysbiotic group (P = .002; P = .0003; and P < .0001, respectively), with no difference in IgG3 (Figure 2C). Collectively, these results clearly demonstrate that gut dysbiosis is associated with an enhanced anti-FVIII immune response.
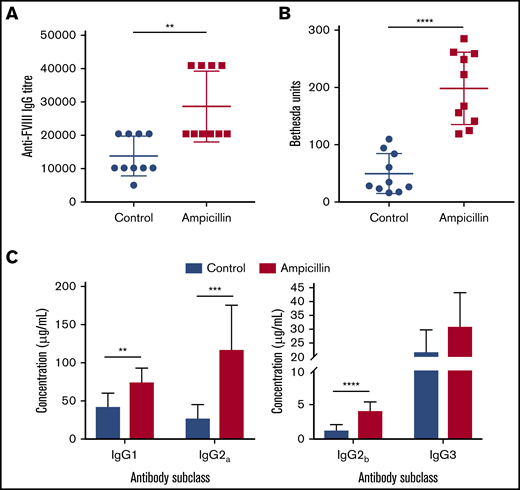
Dysbiosis enhances the immune response to FVIII. (A) Plasma was assessed at the study end point (10 weeks of age) for FVIII-specific IgG and was quantified by the highest titer or dilution at which the ELISA was positive. (B) The magnitude of inhibitory activity was assessed by Bethesda assay. (C) FVIII-specific IgG was quantified based on IgG subclass using a mouse reference serum standard curve. The means and standard deviations were compared using Mann-Whitney U test for total FVIII-specific IgG and an unpaired, 2-tailed Student t test for all other analyses (n = 10). **P < .01; ***P < .001; ****P < .0001.
Dysbiosis enhances the immune response to FVIII. (A) Plasma was assessed at the study end point (10 weeks of age) for FVIII-specific IgG and was quantified by the highest titer or dilution at which the ELISA was positive. (B) The magnitude of inhibitory activity was assessed by Bethesda assay. (C) FVIII-specific IgG was quantified based on IgG subclass using a mouse reference serum standard curve. The means and standard deviations were compared using Mann-Whitney U test for total FVIII-specific IgG and an unpaired, 2-tailed Student t test for all other analyses (n = 10). **P < .01; ***P < .001; ****P < .0001.
Dysbiosis influences total splenic B cells but not cytokine levels
To assess whether gut dysbiosis directly affected the number of naive immune cells in our HA model, total cells from the spleen and MLNs were characterized by flow cytometry at 6 weeks of age, before FVIII administration. The relative frequency of total B cells was significantly higher in the spleens of the dysbiotic mice (P = .0183; Figure 3A). No significant differences were found at this same time point in total CD4+ T cells, CD4+CD25+FoxP3+ Tregs, CD4+CD25−FoxP3+ Tregs, CD11c+ dendritic cells (DCs), or CD103+ DCs (Figure 3B-F). The relative frequency of CD86+ DCs did not change, whereas trends in the absolute numbers of all cell types, including CD25−LAP+ Th3 cells, which were undetectable, reflected trends seen in their relative frequency (data not shown).
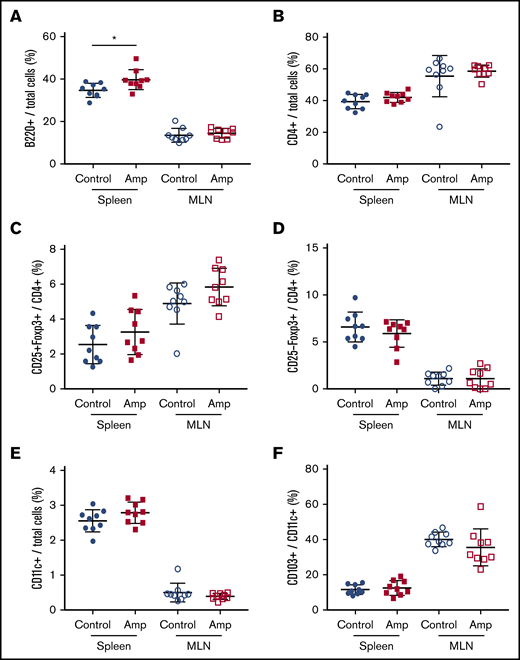
Dysbiosis affects the total number of B cells in spleen cells but not in MLNs. Cell enumeration by flow cytometry was performed on whole-cell isolates from dissected spleen and MLNs of control and ampicillin-treated mice at 6 weeks of age, before FVIII infusion (n = 9 for each cohort). B220+ B cells (A) and CD4+ T cells (B) as a proportion of total cells. Other cells analyzed include: CD25+FoxP3+ (C) and CD25−Foxp3+ (D) T cells represented as a proportion of total CD4+ cells, and CD11c+ DCs (E) as a proportion of total immune cells, and CD103+ cells (F) as a proportion of total CD11c+ DCs. The means and standard deviations within each immunological organ were compared by using an unpaired, 2-tailed Student t test. *P < .05.
Dysbiosis affects the total number of B cells in spleen cells but not in MLNs. Cell enumeration by flow cytometry was performed on whole-cell isolates from dissected spleen and MLNs of control and ampicillin-treated mice at 6 weeks of age, before FVIII infusion (n = 9 for each cohort). B220+ B cells (A) and CD4+ T cells (B) as a proportion of total cells. Other cells analyzed include: CD25+FoxP3+ (C) and CD25−Foxp3+ (D) T cells represented as a proportion of total CD4+ cells, and CD11c+ DCs (E) as a proportion of total immune cells, and CD103+ cells (F) as a proportion of total CD11c+ DCs. The means and standard deviations within each immunological organ were compared by using an unpaired, 2-tailed Student t test. *P < .05.
To assess whether gut dysbiosis influenced steady-state cytokine production present in the local splenic microenvironment immediately before FVIII dosing, splenocyte lysates were analyzed at 6 weeks of age. IL-1β and TGF-β1 were downregulated in mice with dysbiosis, although this significance was not maintained after multiple test corrections (Figure 4). In addition, no detectable concentrations of circulating TNF-α or LPS were observed (data not shown). Overall, these observations indicate that dysbiosis does not cause alterations in levels of splenic cytokines in unchallenged mice.
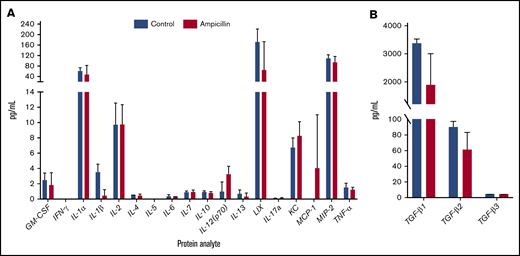
Dysbiosis does not affect homeostatic splenic cytokine levels before FVIII challenge. Spleens were isolated before FVIII challenge in ampicillin-treated (n = 3) and control (n = 4) mice. The protein content of splenic lysate was normalized and then analyzed on an 18-plex cytokine array (A) in addition to a TGF-β panel (B). The means and standard deviations in the cohorts were compared with the unpaired, 2-tailed Student t test. Multiple test corrections were made by the Holm-Šidák method.
Dysbiosis does not affect homeostatic splenic cytokine levels before FVIII challenge. Spleens were isolated before FVIII challenge in ampicillin-treated (n = 3) and control (n = 4) mice. The protein content of splenic lysate was normalized and then analyzed on an 18-plex cytokine array (A) in addition to a TGF-β panel (B). The means and standard deviations in the cohorts were compared with the unpaired, 2-tailed Student t test. Multiple test corrections were made by the Holm-Šidák method.
Dysbiosis influences the transcriptome of the spleen and MLNs
We investigated whether there was any difference in the gene expression profiles within the spleen and MLNs of 3 dysbiotic mice compared to 3 control mice at 6 weeks of age, before FVIII infusions. We filtered for genes that have at least a 1.25-fold change difference in expression and meet standard significance thresholds (α = 0.05), in an attempt to focus on a small subset of immunological genes that may be relevant. Dysbiosis significantly affected the expression of 52 genes in the spleen and 40 genes in the MLNs (supplemental Table 1), 8 of which were shared between these lymphoid organs (Table 1). In the spleen, expression of almost all genes was downregulated in contrast to the MLNs, where there was an approximately equal spread of up- and downregulated genes (Figure 5A). Heat maps show that samples from each cohort (ampicillin-treated and control) cluster together in both the spleen and MLNs, suggesting that gut dysbiosis induces a unique transcriptomic environment compared with controls (Figure 5B). These results indicate that gene expression in naive immune cells in the spleen and MLNs are influenced by gut dysbiosis.
Dysregulated genes in dysbiotic mice, common to both spleen and MLNs
| Gene name | Protein role | Fold change | P |
|---|---|---|---|
| Cd22 | Localization of B cells; regulates B-cell antigen receptor signaling | Spleen: −1.418 | Spleen: .024 |
| MLN: −1.264 | MLN: .048 | ||
| Cd5 | Scavenger receptor found mainly on T lymphocytes. May regulate T-cell proliferation. | Spleen: −1.533 | Spleen: .050 |
| MLN: −1.337 | MLN: .008 | ||
| Cd6 | Signaling cascade triggered by activation of TCR/CD3 complex, Cell adhesion and costimulatory molecule, PRR that bind LPS and lipoteichoic acid of Gram negative and positive bacteria, respectively. | Spleen: −1.615 | Spleen: .047 |
| MLN: −1.316 | MLN: .006 | ||
| Cd79a | Initiation of signal transduction after antigen binding B-cell antigen receptor | Spleen: −1.448 | Spleen: .008 |
| MLN: −1.394 | MLN: .015 | ||
| Map4k2 | B-cell differentiation in germinal centers | Spleen: −1.321 | Spleen: .002 |
| MLN: −1.384 | MLN: .001 | ||
| Nfatc2 | Induces T-cell cytokines IL-2, -3, and -4; TNF-α; and GM-CSF | Spleen: −1.351 | Spleen: .028 |
| MLN: −1.274 | MLN: .026 | ||
| Tap1 | Transport antigens to the endoplasmic reticulum for association with major histocompatibility complex-1 | Spleen: −1.477 | Spleen: .004 |
| MLN: −1.356 | MLN: .034 | ||
| Tlr1 | Innate immune response to microbial lipopeptides | Spleen: −1.291 | Spleen: .036 |
| MLN: −1.291 | MLN: .025 |
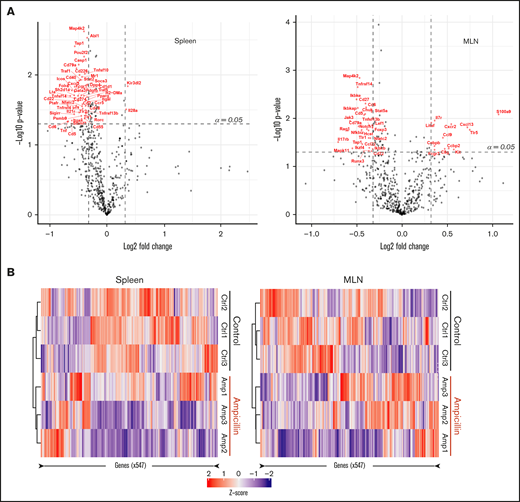
Dysbiosis alters the mRNA transcript profile in both spleen and MLNs. RNA was isolated from whole-cell isolates of the spleen and MLNs of ampicillin-treated compared to control mice at 6 weeks of age, before FVIII infusion (n = 3 in each). RNA was analyzed using a Nanostring murine immunology panel of 547 genes. (A) Differences in gene expression within the spleen (left) and MLNs (right) as a result of ampicillin-treatment is visualized on a volcano plot. An arbitrary fold-change cutoff of ±1.25 and an α = 0.05 was applied to focus on potentially significant genes, and those that met criteria are highlighted in red. Significance was calculated using the Welch t test for unequal variances. (B) Differences in gene expression between both cohorts are represented through their respective z-scores on a heat map. Clustering was completed by using the Pearson squared distance metric of z-scores with Ward’s clustering method.
Dysbiosis alters the mRNA transcript profile in both spleen and MLNs. RNA was isolated from whole-cell isolates of the spleen and MLNs of ampicillin-treated compared to control mice at 6 weeks of age, before FVIII infusion (n = 3 in each). RNA was analyzed using a Nanostring murine immunology panel of 547 genes. (A) Differences in gene expression within the spleen (left) and MLNs (right) as a result of ampicillin-treatment is visualized on a volcano plot. An arbitrary fold-change cutoff of ±1.25 and an α = 0.05 was applied to focus on potentially significant genes, and those that met criteria are highlighted in red. Significance was calculated using the Welch t test for unequal variances. (B) Differences in gene expression between both cohorts are represented through their respective z-scores on a heat map. Clustering was completed by using the Pearson squared distance metric of z-scores with Ward’s clustering method.
Commensal gut microbiota produces SCFAs that act to suppress FVIII inhibitor development
To investigate microbial metabolites as a potential mechanism whereby the gut microbiota could be influencing the immune system, we focused our analysis on the production of 3 of the most prominent immunomodulatory SCFAs identified in the literature. In the cecal contents of 6-week-old mice, before FVIII infusions, significant reductions of acetate, butyrate, and propionate were observed in dysbiotic mice compared with controls (Figure 6A). These SCFAs are thus potential candidates that could cause perturbed gene expression in lymphoid organs.
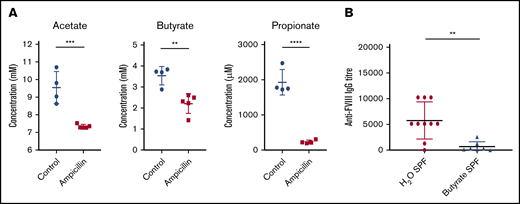
Dysbiosis results in reduced cecal SCFAs and supplementation with butyrate attenuates anti-FVIII immune response. (A) Levels of the cecal SCFAs acetate, butyrate, and propionate were quantified by NMR at 6 weeks of age, before FVIII infusion, and compared between ampicillin-treated (n = 5) and control (n = 4) mice. (B) In a separate experiment, mice were maintained in regular housing conditions and supplemented with 100 mM butyrate in the drinking water starting from 3 weeks of age (n = 7). They were then challenged with FVIII as previoulsy described. Plasma was analyzed for FVIII-specific IgG and compared with plasma of mice receiving only water (n = 10). The means and standard deviations of SCFA levels and FVIII-specific IgG were compared by using the unpaired, 2-tailed Student t test and the Mann-Whitney U test, respectively. **P < .01; ***P < .001; ****P < .0001.
Dysbiosis results in reduced cecal SCFAs and supplementation with butyrate attenuates anti-FVIII immune response. (A) Levels of the cecal SCFAs acetate, butyrate, and propionate were quantified by NMR at 6 weeks of age, before FVIII infusion, and compared between ampicillin-treated (n = 5) and control (n = 4) mice. (B) In a separate experiment, mice were maintained in regular housing conditions and supplemented with 100 mM butyrate in the drinking water starting from 3 weeks of age (n = 7). They were then challenged with FVIII as previoulsy described. Plasma was analyzed for FVIII-specific IgG and compared with plasma of mice receiving only water (n = 10). The means and standard deviations of SCFA levels and FVIII-specific IgG were compared by using the unpaired, 2-tailed Student t test and the Mann-Whitney U test, respectively. **P < .01; ***P < .001; ****P < .0001.
Given the significant decrease in cecal butyrate and the extensive literature demonstrating the immunosuppressive properties of this particular SCFA,30,31 we investigated the effect of supplementing drinking water with butyrate on the FVIII immune response of regularly housed specific-pathogen–free mice. Mice continuously receiving butyrate-supplemented water had significantly lower titers of FVIII-specific antibodies compared with mice receiving plain water (P < .01; Figure 6B). Collectively, these data suggest for the first time that dysbiosis in HA mice reduces SCFA-producing bacteria that, in healthy controls, function to attenuate the development of FVIII antibodies.
Discussion
Gut bacteria are essential for metabolizing dietary substrates into immunologically active metabolites that pass into the gut-associated lymphoid tissue (GALT) and portal circulation.32 The importance of these metabolites in regulating immune responses is becoming increasingly recognized on both the developing and mature immune systems.33,34 SCFAs for instance, regulate the recruitment, activation, and differentiation of immune cells. In general, they have anti-inflammatory effects and induce a T‐lymphocyte tolerogenic profile. Butyrate is one such SCFA that has been shown to be important in reprogramming DCs so that they can promote the differentiation of naive T cells to Tregs. In addition, butyrate acts on T cells directly to reduce their proliferation and facilitate their differentiation to a regulatory phenotype.35 The gut microbiota may also influence the immune system by mimicking common antigens, termed antigenic mimicry, to prime the immune system toward self-antigens.36 Although this study focused on the influence of bacterial metabolite by-products on FVIII immunogenicity, how certain gut microorganisms may mimic FVIII epitopes poses another interesting avenue that should be pursued.
Although fundamental mechanisms of the anti-FVIII immune response are still largely unknown, it is clear that anti-FVIII antibody development is a T-cell–dependent process.37,38 In addition, Tregs are known to be associated with immune tolerance to FVIII.38 Because gut dysbiosis can be associated with a reduction in SCFAs, this environment presents a mechanism by which the regulated differentiation of T cells is disrupted, influencing the risk of inhibitor development in HA.
Germ-free mice have been very informative regarding the connection between the gut microbiota and circulating levels of hemostatic factors including von Willebrand factor and FVIII.39 However, very few such studies have investigated the role the gut microbiota plays in shaping systemic adaptive immune responses to these hemostatic factors, and with reference to the current work, there have been no studies addressing its role in anti-FVIII antibody formation. This is, at least in part, because generating and maintaining germ-free mice is very costly and administering intravenous drug injections in a sterile environment presents significant practical challenges. Therefore, as an alternative to germ-free mice we opted to induce gut dysbiosis in a model of HA using a broad-spectrum antibiotic, ampicillin, which has been shown to significantly alter levels of bacteria-derived metabolites.40
The comparison of bacterial phyla and classes along with the diversity of the cecal microbiota between the ampicillin-treated and the untreated controls in this study clearly shows separate and distinct gut microbiota. It is important to consider, however, the small sample sizes used in this exploratory study of the murine gut microbiota. Nonetheless, the analysis of microbiota dissimilarity within control mice between the midpoint and end of the study, despite no change in housing conditions or feed, is in keeping with murine and human observations that age independently influences microbiota composition.16,41 This diversity in microbial composition with age is less evident in the antibiotic-treated group of mice, even 6 weeks after completing the course of antibiotic, indicating that antibiotics most likely have a greater influence on bacterial diversity than age. The stringently controlled housing conditions are also likely to have contributed to these outcomes. The use of isorack cages was implemented intentionally to prevent recovery of a healthy gut microbiota and to maintain the induced dysbiosis. Our ampicillin-induced model of dysbiosis is not intended to be a direct replication of antibiotic use in humans, rather as a simulation of other causes of sustained gut dysbiosis in children.
The observed immune transcriptome in 3 dysbiotic mice involved many dysregulated immune genes. Of the 8 genes significantly dysregulated in both the spleen and the MLNs, many have a role in adaptive immunity (Table 1). Unfortunately, it is difficult to draw further conclusions from these perturbations in whole organ cellular isolates with a small sample size and should simply guide further investigation into gut-mediated influences on systemic FVIII immunity. However, the significant reduction in foxp3 expression observed in the MLN, that is known to be crucial for the development of Treg cell function, is in keeping with the resultant enhanced adaptive immune response in the dysbiotic cohort. Importantly, antibiotic administration has been shown to influence various aspects of the vascular and hemostatic systems,42 which could account for some of the differences observed in our results.
The spleen is considered the most likely site for the initial immune cell interactions to occur in the FVIII immune response. In support of this, FVIII preferentially accumulates in the murine spleen after IV infusion.43 At the time point chosen for assessment in our experiments, splenic cytokines were not significantly different between control and dysbiotic mice. This result indicates that the dysbiotic gut microbiota did not induce a significant proinflammatory cytokine profile in the unchallenged spleen before FVIII administration. In addition, we observed no detectable increase in circulating LPS, potentially because of the limit of detection for the LAL assay, nor the systemic inflammatory marker TNF-α in the dysbiotic mice. Together with the observed overall equivalent general health between the 2 cohorts (no differences in appearance or weight, data not shown) the findings indicate that although the ampicillin-treated mice had established gut dysbiosis, they were not systemically unwell, yet they still mounted a more robust immune response to FVIII.
SCFAs are produced from dietary resistant starches by bacterial fermentation.44 The data we present are consistent with other studies showing that dysbiosis is associated with depletion of colonic SCFAs and increased immunogenicity.45 Furthermore, our data showing reduction of anti-FVIII antibody titers in HA mice receiving butyrate-supplemented drinking water further supports the role of SCFAs as immunomodulatory metabolites capable of influencing the FVIII immune response. SCFAs, in particular, butyrate, are produced by certain bacteria of the Actinobacteria and Bacteroidetes phylas and some defined groups of the Clostridia class within the Firmicutes phylum.46-49 In addition, certain Clostridium species are typically associated with anti-inflammatory properties and induction of Tregs.30,31 The observation of increased abundance of the Clostridia class in our dysbiotic mice seems to be in conflict with the literature. However, after antibiotic therapy we have observed marked differences in the abundance of various specific species of Clostridia (supplemental Figure 2). This indicates the presence of a more complex dysbiosis occurring at the species level, rather than that described by general class- and phyla-level data. Specifically, strains falling within clusters IV, XIV, and XVIII of Clostridia, lacking prominent toxins and virulence factors, are known to induce Tregs.50 Using our current analysis pipeline (99% identity), it is not feasible to identify specific strains of interest in these samples. Furthermore, it was not our aim to identify individual species of bacteria that are implicated in attenuating the immune response. Even overall observations in trends at the phyla level can be difficult to interpret, as taxonomy does not correspond to metabolic function. However, decreased α- and β-diversity, in combination with overall phylum-level bacterial trends in response to ampicillin treatment, suggest that fluctuations in bacterial communities observed in this study are consistent with the literature and in keeping with the immune responses observed.
The GALT, comprising Peyer’s patches, MLNs, isolated lymphoid follicles, and scattered intraepithelial lymphocytes, is the largest lymphoid organ in the body.51 SCFAs act on immune cells of the GALT by binding to surface G-protein–coupled receptors and also by histone deacetylase inhibition. In the presence of an antigen, butyrate plays a particular role in the maintenance of tolerogenic DCs. Butyrate also induces peripheral maturation of naive T cells into Tregs by inhibition of histone deacetylase activity at the foxp3 locus.52,53 In naive T cells, this has been shown to result in increased foxp3 expression with the subsequent induction of a Treg phenotype when T cells encounter cognate peptides on antigen-presenting cells (APCs) and become activated.54-57 This mechanism of action is consistent with our results that showed no increase in Tregs before FVIII challenge, despite significant differences in the splenic transcriptome.
For naive T-cell activation and maturation, 3 signals are required: signal 1 is the TCR‐MHC‐II peptide interaction, signal 2 is from costimulatory molecules found on the APC, and signal 3 is from cytokines in the microenvironment provided by innate immune cells. In the current study, butyrateprovided a fourth influence on the immune synapse when all 3 of these signals are present. However, capturing and evaluating the immune synapse between the very small number of naive cognate FVIII-specific T cells and the MHC/FVIII on APCs in a pool of nonspecific T cells in our model is not possible. In vitro studies sufficiently sensitive to characterize this immune synapse in the presence of butyrate would require a clonal population of FVIII-specific naive T cells. Unlike T-cell alterations, we observed an increase in the B-cell population before the FVIII challenge. This finding is consistent with increases in nonspecific steady-state B-cell populations reported in response to a lack of SCFAs.58 Further work characterizing this B-cell subset and its subsequent role in the FVIII immune response may elucidate mechanisms by which acetate, butyrate, propionate, or other less well-characterized SCFAs may be working to suppress FVIII immune responses.
Our data in this exploratory study support the proposal that the loss of persistent background tolerogenic signals associated with gut dysbiosis and disruption of immunomodulatory metabolites are novel, identifiable, and potentially modifiable risk factors for the development of FVIII inhibitors in HA mice. In addition, although an antibiotic is used in our dysbiotic murine model, we can infer that other influences on the gut microbiota have the potential for similar effects. Further work identifying particular groups of bacteria, through causal studies, may shed light on an “ideal” gut microbiota for HA patients who are beginning FVIII replacement therapy. Given the relatively low cost of sequencing and reliability of microbiota assessment from noninvasive stool sampling in humans, identifying patients with high-risk microbiota may be achievable. In addition, correction of dysbiosis, termed “rebiosis,”11 could be a feasible intervention that warrants future study in HA. Further investigating the concept via fecal microbiota transplantation into germ-free HA mice can assess the efficacy and translation potential of this therapeutic intervention. Additional strategies that could be used to minimize the likelihood of FVIII inhibitor development may include oral butyrate supplementation, dietary modifications to maximize microbial-accessible carbohydrate intake and pro- and prebiotic supplements. Current work in gut microbiota manipulation is under way to develop and assess the efficacy and safety of these approaches in humans with other pathologies, and appropriate caution should be applied to ensure that unwanted perturbations of the systemic immune system are not overlooked.
The data discussed in this publication have been deposited in the Gene Expression Omnibus database (accession number GSE138332). Original data from the study are available by e-mail request to the corresponding author.
Acknowledgments
The authors thank Kathrin Tyrishkin (Queen’s University) for support with bioinformatics.
D.L. is supported by a Canadian Institutes of Health Research Foundation grant (FDN 154285) and a US National Institutes of Health, National Heart, Lung, and Blood Institute cooperative agreement U54 grant (RFA-HL18-014). D.L. is also the recipient of a Canada Research Chair in Molecular Hemostasis. J.T. is supported in part by a Bayer Hemophilia Awards Clinical Fellowship.
Authorship
Contribution: D.L., J.T., and M.C. conceived and designed the project; J.T. and M.C. designed and performed the experiments and interpreted the research; K.N. and C.D. performed the mouse manipulations; J.T. wrote the manuscript; and J.T., M.C., C.H., and D.L. reviewed and revised the manuscript.
Conflict-of-interest disclosure: D.L. received research support from Bayer, Biogen, Biomarin, CSL-Behring, and Octapharma. The remaining authors declare no competing financial interests.
Correspondence: David Lillicrap, Richardson Laboratory, Queen's University, 88 Stuart St, Kingston, ON K7L 3N6, Canada; e-mail: david.lillicrap@queensu.ca.

