

Key Points
Adapted Genetic Risk is a surrogate cytogenetic-molecular risk assessment dealing with some degree of missing data without losing accuracy.
SAMLS improves AML survival prediction regardless of differences in baseline characteristics and treatment of AML populations.

Abstract
The 2017 European LeukemiaNet 2017 acute myeloid leukemia (AML) risk stratification (ELN2017) is widely used for risk-stratifying patients with AML. However, its applicability in low- and middle-income countries is limited because of a lack of full cytogenetic and molecular information at diagnosis. Here, we propose an alternative for risk stratification (the Adapted Genetic Risk [AGR]), which permits cytogenetic or molecular missing data while retaining prognostic power. We first analyzed 167 intensively treated patients with nonacute promyelocytic leukemia AML enrolled in São Paulo, Brazil (Faculdade de Medicina da Universidade de São Paulo), as our training data set, using ELN2017 as the standard for comparison with our AGR. Next, we combined our AGR with clinical prognostic parameters found in a Cox proportional hazards model to create a novel scoring system (survival AML score, SAMLS) that stratifies patients with newly diagnosed AML. Finally, we have used 2 independent test cohorts, Faculdade de Medicina de Ribeirão Preto (FMRP; Brazil, n = 145) and Oxford University Hospitals (OUH; United Kingdom, n = 157) for validating our findings. AGR was statistically significant for overall survival (OS) in both test cohorts (FMRP, P = .037; OUH, P = .012) and disease-free survival in FMRP (P = .04). The clinical prognostic features in SAMLS were age (>45 years), white blood cell count (<1.5 or >30.0 × 10³/μL), and low albumin levels (<3.8 g/dL), which were associated with worse OS in all 3 cohorts. SAMLS showed a significant difference in OS in the training cohort (P < .001) and test cohorts (FMRP, P = .0018; OUH, P < .001). Therefore, SAMLS, which incorporates the novel AGR evaluation with clinical parameters, is an accurate tool for AML risk assessment.
Introduction
Acute myeloid leukemia (AML) is characterized by clonal expansion of myeloid lineage progenitors and bone marrow failure.1 Risk stratification in AML draws on clinical features and cytogenetic and gene mutation assessment and reflects therapy refractoriness and relapse risk. However, there is no consensus risk scoring that combines clinical and cytogenetic-molecular parameters at AML diagnosis.2 Prognostic scoring systems are useful to determine upfront therapy intensity and choice of consolidation therapy, including allogeneic stem cell transplantation in first complete remission (CR1).3 Refinement of available prognostic scoring systems is currently being addressed in large prospective AML clinical trials that mainly recruit from high-income health care systems.4
Clinical features such as age, white blood cell (WBC) count, and performance status affect clinical outcome.5,6 These were previously incorporated into scoring systems that had either a specific endpoint (eg, 30-day mortality)5 or were applied to specific AML subsets (eg, AML with normal cytogenetics).6 Others have used the hematopoietic cell transplantation comorbidity index, which involves multiple physiological tests, and genetic factors to predict survival in AML.7
Genetic risk classifications have been used to guide therapy escalation or deescalation in high- and low-risk patients, respectively. However, the largest group of patients fall under the intermediate genetic risk (IR) category.8-10 Efforts to refine IR patients have driven increased complexity in genetic risk assessment by adding new molecular markers; for example, in AML European LeukemiaNet 2017 risk classification (ELN2017).8 This reclassified some patients previously in the large IR category as either favorable risk (FR) or adverse risk (AR), and has recently been partially validated in a single-center cohort.11 Another approach, which remains to be prospectively validated, was to generate statistical models using large, complex retrospective data sets including clinical outcome and detailed molecular mutation profiles to provide an individualized prediction of outcome.12,13 These genetic scoring systems are frequently irrelevant for many patients who do not have access to comprehensive molecular genetic testing14 or when testing is not sufficiently timely for clinical decision-making. Based on previous reports in Brazil and Germany, up to a third of the study subjects could not be stratified using a full cytogenetic-molecular model (eg, ELN) in a real-time, real-life setting.15,16 According to the World Bank, up to 85% of the world population lives in low- and middle-income countries.17 Furthermore, lack of access to comprehensive diagnostic workup may exclude patients from study analyses. This data bias may affect the ability of clinicians to offer the best prognostic information and therapy to patients. We therefore need to have an AML prognostic scoring system that is fit for purpose in these health care settings. Here, we set out to create a novel risk score that is applicable in all patients with AML, including those with missing diagnostic data. We first validated ELN2017 in a Brazilian cohort and then built an Adapted Genetic Risk (AGR) assessment designed to risk stratify patients in health care settings in which we lack the full complement of genetic diagnostic data required for ELN2017. In addition, we used this cohort as a training data set to model clinical-pathological prognosis predictors and to build a simple bedside survival score system (survival AML Score, SAMLS) that combines AGR with these clinical parameters. We further validate AGR and SAMLS with 2 additional independent cohorts: 1 each from a middle-income country and a high-income country.
Methods
Patients
The training cohort consisted of 167 consecutive younger adults (range, 18-65 years) diagnosed with AML between January 2007 and September 2017 at Faculdade de Medicina da Universidade de São Paulo (FMUSP) hospitals. Patients with acute promyelocytic leukemia were excluded. Test cohorts comprised 145 and 157 consecutive patients (range, 16-65 years) diagnosed at Faculdade de Medicina de Ribeirão Preto (FMRP) Hospital between October 2001 and February 2018 and Oxford University Hospitals (OUH) between November 2006 and September 2017, respectively. Cohorts are referred to by their hospital acronyms. AML was defined using World Health Organization criteria.18 This study is approved by institutional review board for Brazilian cohorts (CAAE: 80673316.3.0000.0068). Anonymized clinical data collection for the British cohort has been carried out according to local guidelines, and did not require ethical board review.
All patients received intensive induction regimens, typically daunorubicin (60 or 90 mg/m2 for 3 days), and cytarabine (100 or 200 mg/m2 for 7 or 10 days) after local institutional protocols. Most OUH patients received 2 courses of daunorubicin plus cytarabine induction. Consolidation therapy consisted of cytarabine (1.5 g/m2 or 3 g/m2 for 3 days [HiDAC]) and/or allogeneic hematopoietic stem-cell transplantation (HSCT) performed according to clinical judgment and donor availability (Figure 1).
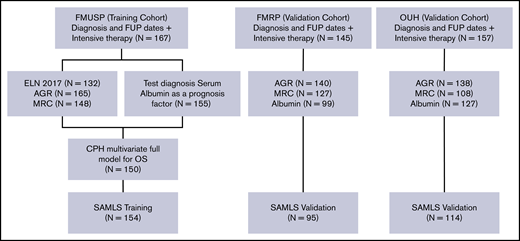
Modeling diagram. Training (FMUSP) and test (FMRP and OUH) cohorts modeled data. FUP, follow-up; MRC, Medical Research Council Cytogenetic Classification.
Modeling diagram. Training (FMUSP) and test (FMRP and OUH) cohorts modeled data. FUP, follow-up; MRC, Medical Research Council Cytogenetic Classification.
Clinicopathological, cytogenetics, molecular data, and devising AGR
Clinical and laboratory data were collected via electronic medical records and databases. Samples for genetic analysis were obtained at diagnosis and processed in reference laboratories of each participating center. Cytogenetic analyses were performed on bone marrow aspirates according to standard techniques for chromosomal banding. Bone marrow (preferentially) or peripheral blood were used for molecular analyses. Polymerase chain reaction techniques followed by standard electrophoresis and fragment analysis methods were performed for detection of FLT3-internal tandem duplication (FLT3-ITD), NPM1, and CEBPA mutations.19-21 We had also performed next-generation sequencing targeted panel analysis (94 genes) in FMUSP samples where there was available diagnostic material for ELN2017 classification8 (supplemental Methods).
In all cohorts, patients were assessed using the Medical Research Council (MRC) evaluation system (cytogenetics only)22 and cytogenetic-molecular AGR. AGR was built using the same biological basis as ELN2010.23 It stratified patients into 3 prognostic categories: FR, IR, or AR. The novelty of AGR is that it allowed for some degree of missing data (Table 2). For example, a patient with mutant NPM1 whose sample failed cytogenetic testing and whose FLT3-ITD status is unknown would be classified as IR (ie, a worst possible scenario is presumed). Alternatively, a patient with AML with deletion of chromosome 5q is considered AR regardless of the presence or absence of other molecular or cytogenetic findings, based on the observation of an association between 5q aneuploidy with complex monosomal karyotype and TP53 mutations in AML.9
SAMLS modeling
The training data set was used to set continuous variables cutoffs by simulating all possibilities,24 followed by inspection of Kaplan-Meier (KM) curves. The same data set was also used for multivariate Cox proportional hazard modeling (CPHM). To determine which variables to include in multivariate CPHM, we performed backward selection to obtain the best-fit model as per Akaike information criteria (AIC). AIC estimate the quality of a model by goodness of fit (assessed by the likelihood function), aiming for the best-fit model with the least number of parameters.25 For the selection procedure, we set the cytogenetic-molecular risk (AGR) as a basis (indispensable) variable. Induction therapy was not included in the multivariate CPHM because of the biased nature of a retrospective, nonrandomized study. However, to determine whether SAMLS variables would be predictive regardless of postremission therapy, we performed a multivariate CPHM having HSCT as a time-dependent variable. In addition, specific mutations or karyotype isolated were not included, as they are already in the AGR. Clinical prognostic features incorporated in SAMLS were those statistically significant in multivariate CPHM. The adjusted (multi-CPHM) hazard ratios (HRs) for the statistically significant variables were then converted into an attributed weight, as follows: adjusted HRs of 1.3 to 1.9 were converted into a weight of 0.5, HRs between 2.0 and 2.9 were converted into a weight of 1.0, and HRs bigger than 3.0 were converted into a weight of 2.0. The sum of the weights provides an individual SAMLS score. We set cutoffs for SAMLS also using simulation24 and KM inspection. We validated the findings using data from testing cohorts (FMRP and OUH). To measure the prediction accuracy for AGR and SAMLS, a receiver operating characteristic (ROC) curve and its respective C-statistic (concordance statistics) were fitted. The C-statistic is equal to the ROC curve area under the curve (AUC). An AUC has a scale of 0.5 to 1.0, where 1.0 indicates perfect prediction and 0.5 indicates no prediction (ie, a 50:50 chance). We calculated the 95% confidence interval (CI) for the AUC associated with each risk tool (SAMLS, AGR, and MRC) in each cohort, using an R implementation of DeLong’s algorithm.26 In addition, to determine whether SAMLS performs better than AGR or MRC, we calculated the difference between AUCs (ΔAUC) as ΔAUC = AUCSAMLS − AUCAGR or AUCSAMLS − AUCMRC. We used 10 000 bootstrap resampling and calculated ΔAUC in each iteration. According to the distribution of this statistic, we estimated 95% CI. When the 95% CI comprised only positive values, we concluded that SAMLS performed better compared with AGR or MRC. As an example, the 95% CIs for AUCs and for ΔAUC using FMRP SAMLS and AGR data are illustrated in supplemental Figure 2. Furthermore, P values for ΔAUC were estimated by repeating the bootstrap procedure under the null hypothesis (by permutation) and analyzing the empirical distribution of ΔAUC statistics.27
Statistical analysis
Continuous variables were described as median and interquartile range, and differences between the groups were assessed using the Kruskal-Wallis test. Categorical variables were presented as counts and proportions and differences among groups assessed with χ2 tests. Overall survival (OS) was calculated as the difference in months between diagnosis and last follow-up date, and disease-free survival (DFS) as the difference between complete hematological remission (CR) date and either relapse or last follow-up date (whichever occurred first). Survival measures and curves were estimated using KM and group comparisons, a log-rank test. We have not censored survival outcomes as for HSCT date, as we are not comparing survival between the different cohorts but, rather, validating the ability of AGR and SAMLS to discriminate between groups with different prognosis in the test cohorts. All P values were 2-sided with a significance level of <.05. For the statistical modeling summary, refer to supplemental Methods. All statistical analysis and modeling were performed in R version 3.6.1 (The CRAN project, www.r-project.org).
Results
Clinical characteristics
We assessed 3 independent cohorts: FMUSP (N = 167), FMRP (N = 145), and OUH (N = 157). Baseline characteristics of all 3 cohorts are summarized in Table 1. Age, albumin levels, hemoglobin levels, platelet counts, de novo versus secondary disease, MRC cytogenetic risk, induction therapy (anthracycline-based versus other), and postremission therapy were heterogeneous among the 3 cohorts (P < .05). HSCT was performed in CR1 for 19.5% of patients in FMUSP, 19% in FMRP, and 60.5% in OUH.
Baseline characteristics among the 3 cohorts
| Characteristic | FMUSP (N = 167) | FMRP (N = 145) | OUH (N = 157) | P* |
|---|---|---|---|---|
| Age, median (IQR), y | 46.7 (32.9-57.3) | 43 (27-52) | 51.4 (42.4-59) | <.001 |
| Albumin, median (IQR), g/dL | 3.5 (3.1-4.0) | 3.7 (3.2-4.0) | 4.1 (3.9-4.4) | <.001 |
| WBC, median (IQR), ×103/μL | 16.9 (2.5-50.7) | 20.6 (6.0-55.9) | 12.4 (6.9-24.6) | .053 |
| Hemoglobin, median (IQR), g/dL | 7.9 (6.4-9.3) | 8.1 (7.0-9.2) | 10.2 (8.4-12.1) | <.001 |
| PLT, median (IQR), ×103/μL | 38.0 (24.0-76.0) | 53.0 (25.0-96.0) | 91.0 (52.5-211.5) | <.001 |
| BM blast, median (IQR), % | 62 (38-81) | 69 (42-87) | 55 (38-80) | .07 |
| LDH, normalized ratio, median (IQR) | 1.7 (1.0-2.9) | 1.8 (0.9-3.4) | 1.6 (1.0-3.0) | .77 |
| Sex, n (%) | ||||
| Female | 92 (55) | 78 (54) | 68 (43) | .07 |
| Male | 75 (45) | 67 (46) | 89 (57) | |
| Diagnosis, n (%) | ||||
| De novo AML | 155 (93) | 143 (98.5) | 137 (88) | <.001 |
| Secondary | 12 (7) | 2 (1.5) | 20 (12) | |
| Cytogenetics, n (%)† | ||||
| Favorable | 26 (17) | 31 (26) | 12 (11) | .03 |
| Intermediate | 97 (64) | 80 (61) | 76 (69) | |
| Adverse | 28 (19) | 16 (23) | 22 (20) | |
| Missing‡ | 16 (—) | 17 (—) | 47 (—) | |
| NPM1 mutation, n (%) | ||||
| Yes | 29 (21) | 19 (19) | 25 (25) | .49 |
| No | 111 (79) | 82 (81) | 73 (75) | |
| Missing‡ | 17 (—) | 44 (—) | 59 (—) | |
| CEBPa-biallelic mutation, n (%) | ||||
| Yes | 3 (3) | 2 (3) | 2 (2) | .91 |
| No | 95 (97) | 58 (97) | 88 (98) | |
| Missing‡ | 69 (—) | 76 (—) | 67 (—) | |
| FLT3-ITD mutation, n (%) | ||||
| Yes | 29 (19) | 36 (26) | 25 (26) | .24 |
| No | 125 (81) | 101 (74) | 71 (74) | |
| Missing‡ | 13 (—) | 8 (—) | 61 (-) | |
| AGR, n (%) | ||||
| Favorable | 44 (26.5) | 48 (34) | 28 (20.5) | .09 |
| Intermediate | 85 (51.5) | 58 (41.5) | 72 (52) | |
| Adverse | 36 (22) | 34 (24.5) | 38 (27.5) | |
| Missing‡ | 2 (—) | 5 (—) | 19 (—) | |
| Induction therapy, n (%)§ | ||||
| Anthracycline-based | 141 (84.5) | 140 (96.5) | 147 (96) | <.001 |
| Other | 26 (15.5) | 4 (3.5) | 6 (4) | |
| HSCT CR1, n (%) | ||||
| Yes | 23 (19.5) | 19 (19) | 88 (60.5) | <.001 |
| No | 96 (80.5) | 80 (82) | 57 (39.5) |
BM, bone marrow; HGB, hemoglobin; IQR, interquartile range; LDH, lactic dehydrogenase; PLT, platelets; USL, upper superior limit.
P value: Kruskal-Wallis and χ2/Fisher's exact tests for intercohort comparisons.
MRC cytogenetic risk.22
Missing data are being considered neither for groups proportions nor for P value calculation.
Anthracycline-based: any regimen containing anthracycline in combination with other agents. Other: regimens not containing anthracycline in their composition (supplemental Table 7).
Median follow-up was 72.3, 45.3, and 72.5 months for FMUSP, FMRP, and OUH, respectively. Median OS for FMUSP, FMRP, and OUH cohorts was 12.4, 12.3, and 48.2 months, and 5-year OS was 29.6%, 28%, and 47.6%, respectively. As for DFS, median was 10.3, 11.0, and 21.0 months, and 5-year DFS was 32.2%, 28.5%, and 34.5%, respectively for FMUSP, FMRP, and OUH cohorts (supplemental Figure 3A-F).
Devising a novel AGR assessment
Because of missing cytogenetic-molecular data, we were unable to apply ELN2017 recommendations in our cohorts except for FMUSP, where we had material on which to carry out additional next-generation sequencing testing. We compared ELN2017 in FMUSP cohort with our novel AGR (Table 2). AGR, which has 3 risk categories (FR, IR, and AR), correlated with significant differences in OS (P < .001) and in DFS (P = .002) in the FMUSP cohort (Table 3). ROC C-statistic was 0.68 (95% CI, 0.58-0.77) and 0.66 (95% CI, 0.58-0.73) for ELN2017 and AGR, respectively. We also estimated sensitivity and specificity for AGR (supplemental Table 2; supplemental Figure 4A-F). When considering the risk categories (supplemental Figure 5), ELN2017 and AGR yielded similar results for median OS with 32.6 and 37.1 months (FR), 7.9 and 10.7 months (IR), and 9.2 and 8.3 months (AR). Median DFS was 17.8 and 22.6 months for FR, 5.8 and 8.8 months for IR, and 6.5 and 5.9 months for AR. Moreover, results for 1-year and 5-year OS and DFS were again similar between ELN2017 and AGR in FMUSP (Table 3; Figure 2A-D).
The AGR
| Genetic risk | Cytogenetic-molecular subsets, based on ELN* | Cytogenetic-molecular subsets adapted for AGR |
|---|---|---|
| Favorable | NPM1 mutated without FLT3-ITD (normal karyotype) | NPM1, which is known to not have FLT3 ITD, and: normal karyotype, or any other aneuploidy or nonrecurrent translocation/inversion, or unknown or inconclusive karyotype.† |
| Biallelic mutated CEBPA (normal karyotype) | Biallelic mutated CEBPA, and normal karyotype, or any other aneuploidy or nonrecurrent translocation/inversion, or unknown or inconclusive karyotype.† | |
| t(8;21)(q22;q22); RUNX1-RUNX1T1 | t(8;21)(q22;q22); RUNX1-RUNX1T1 | |
| inv(16)(p13.1;q22) or t(16;16)(p13.1;q22); CBFB- MYH11 | inv(16)(p13.1;q22) or t(16;16)(p13.1;q22); CBFB-MYH11 | |
| Intermediate‡ | NPM1 mutated with FLT3-ITD mutation (normal karyotype) | NPM1 mutated, where the FLT3 status is unknown, and: normal karyotype, or any other aneuploidy or nonrecurrent translocation/inversion, or unknown or inconclusive karyotype.† |
| t(9;11)(p21.3;q23.3); MLLT3-KMT2A | t(9;11)(p21.3;q23.3); MLLT3-KMT2A | |
| Cytogenetic: normal or not defined as either favorable or adverse | Cytogenetic: normal or not defined as either favorable or adverse | |
| Adverse | inv(3)(q21.3;q26.2) or t(3;3)(q21.2;q26.2); GATA2, MECOM (EVI1) | inv(3)(q21.3;q26.2) or t(3;3)(q21.2;q26.2); GATA2, MECOM (EVI1) |
| t(6;9)(p23;q34.1); DEK-NUP214 | t(6;9)(p23;q34.1); DEK-NUP214 | |
| t(v;11q23.3); KMT2A rearranged | t(v;11q23.3); KMT2A rearranged | |
| t(9;22)(q34.1;q11.2): BCR-ABL1 | t(9;22)(q34.1;q11.2): BCR-ABL1 | |
| −5 or del(5q); –7; abnl(17p); complex, or monosomal karyotype§ | Adverse prognosis aneuploidy or complex/monosomal karyotype, and: NPM1, FLT3-ITD, or CEBPA wild-type, unknown or inconclusive.† | |
| FLT3-ITD mutated with NPM1 wild-type | FLT3-ITD mutated with: NPM1 wild-type, NPM1 status unknown or inconclusive; and: normal karyotype, or any other aneuploidy or nonrecurrent translocation/inversion, or unknown or inconclusive karyotype.† |
ELN2010.23
AGR was trained and tested in cohorts in which up to 30% of cytogenetics-molecular data points were missing. Where possible, we recommend that full cytogenetics/molecular testing be performed.
A sample with absent/inconclusive cytogenetics result, which is NPM1, CEBPA, and FLT3-ITD wild-type, and is transcript negative (by standard quantitative polymerase chain reaction) for RUNX1-RUNX1T1 and CBFB-MYH11, is classified as intermediate risk in AGR.
Complex cytogenetics: 3 or more chromosome abnormalities in the absence of recurring translocations or inversions defined as FR; monosomal karyotype: the presence of 1 single monosomy (excluding loss of X or Y) in association with at least another additional monosomy or structural chromosome abnormality.
Bold indicates deviation from ELN2010.
ELN 2017, MRC, AGR, SAMLS, and albumin survival and comparative accuracy
| FMUSP (N = 167) | FMRP (N = 145) | OUH (N = 157) | ||||||||||
|---|---|---|---|---|---|---|---|---|---|---|---|---|
| 1-y OS, % | 5-y OS, % | P* | AUC | 1-y OS, % | 5-y OS, % | P* | AUC | 1-y OS, % | 5-y OS, % | P* | AUC | |
| ELN2017 (N = FMUSP) | ||||||||||||
| Favorable (N = 49) | 71 (60-85) | 43 (30-62) | <.001 | 0.68 (0.58-0.77) | — | — | — | — | — | — | — | — |
| Intermediate (N = 34) | 28 (16-48) | 21 (11-41) | — | — | — | — | ||||||
| Adverse (N = 49) | 31 (21-48) | 10 (3-26) | — | — | — | — | ||||||
| MRC (N = FMUSP/FMRP/OUH) | ||||||||||||
| Favorable (N = 23/30/11) | 87 (74-100) | 52 (34-80) | <.001 | 0.63 (0.56-0.71) | 60 (45-80) | 42 (28-65) | .2 | 0.54 (0.45-0.63) | 100 (100-100) | 54 (32-93) | .17 | 0.57 (0.49-0.66) |
| Intermediate (N = 97/80/76) | 49 (40-60) | 29 (20-40) | 46 (36-59) | 25 (16-39) | 79 (70-88) | 49 (40-63) | ||||||
| Adverse (N = 28/16/22) | 25 (13-47) | 10 (3-35) | 54 (33-86) | 20 (7-63) | 59 (42-84) | 34 (19-62) | ||||||
| AGR (N = FMUSP/FMRP/OUH) | ||||||||||||
| Favorable (N = 44/48/28) | 75 (63-89) | 46 (32-66) | <.001 | 0.66 (0.58-0.74) | 60 (48-76) | 43 (31-61) | .04 | 0.59 (0.50-0.69) | 92 (83-100) | 57 (41-80) | .01 | 0.63 (0.55-0.72) |
| Intermediate (N = 85/58/72) | 48 (38-59) | 28 (20-41) | 52 (40-67) | 22 (11-41) | 79 (70-89) | 52 (42-66) | ||||||
| Adverse (N = 36/33/38) | 28 (16-47) | 11 (4-30) | 37 (22-59) | 15 (6-39) | 63 (49-80) | 28 (16-49) | ||||||
| SAMLS (N = FMUSP/FMRP/OUH) | ||||||||||||
| LR AML (N = 63/37/68) | 81 (71-91) | 55 (43-71) | <.001 | 0.80 (0.73-0.88) | 67 (53-84) | 37 (23-60) | .001 | 0.74 (0.63-0.84) | 94 (88-100) | 70 (59-82) | <.001 | 0.77 (0.69-0.86) |
| HR AML (N = 91/57/46) | 26 (18-37) | 9 (4-18) | 35 (24-50) | 14 (7-28) | 60 (47-76) | 28 (17-46) | ||||||
| Albumin (N = FMUSP/FMRP/OUH) | ||||||||||||
| Above 3.8g/dL (N = 61/38/100) | 65 (54-78) | 41 (29-57) | <.001 | — | 73 (60-89) | 44 (30-65) | <.001 | — | 88 (82-94) | 64 (54-75) | <.001 | — |
| Below 3.8g/dL (N = 94/61/27) | 37 (28-48) | 18 (11-28) | 35 (25-50) | 13 (6-28) | 54 (38-77) | 39 (24-63) | ||||||
| 1-y DFS, % | 5-y DFS, % | P* | AUC | 1-y DFS, % | 5-y DFS, % | P* | AUC | 1-y DFS, % | 5-y DFS, % | P* | AUC | |
|---|---|---|---|---|---|---|---|---|---|---|---|---|
| ELN 2017 (N = FMUSP) | ||||||||||||
| Favorable (N = 46) | 54 (42-71) | 44 (31-61) | .001 | 0.66 (0.56-0.77) | — | — | — | — | — | — | — | — |
| Intermediate (N = 25) | 29 (16-54) | 21 (10-45) | — | — | — | — | ||||||
| Adverse (N = 29) | 31 (18-55) | 9 (3-33) | — | — | — | — | ||||||
| MRC (N = FMUSP/FMRP/OUH) | ||||||||||||
| Favorable (N = 22/17/11) | 68 (51-90) | 58 (40-83) | .004 | 0.62 (0.53-0.71) | 41 (23-72) | 41 (23-73) | .35 | 0.54 (0.41-0.67) | 82 (62-100) | 36 (17-80) | .9 | 0.51 (0.42-0.60) |
| Intermediate (N = 75/36/73) | 45 (35-58) | 27 (18-41) | 59 (44-79) | 40 (26-63) | 68 (58-80) | 37 (27-51) | ||||||
| Adverse (N = 15/12/16) | 26 (11-61) | 18 (6-56) | 28 (11-73) | 15 (3-76) | 62 (43-91) | 30 (14-65) | ||||||
| AGR (N = FMUSP/FMRP/OUH) | ||||||||||||
| Favorable (N = 41/27/28) | 58 (45-76) | 47 (34-66) | .002 | 0.64 (0.55-0.73) | 54 (38-77) | 50 (34-73) | .04 | 0.60 (0.48-0.66) | 85 (73-100) | 35 (21-60) | .2 | 0.56 (0.47-0.65) |
| Intermediate (N = 63/31/68) | 46 (35-61) | 28 (18-42) | 59 (43-81) | 23 (9-63) | 68 (55-78) | 40 (30-54) | ||||||
| Adverse (N = 21/16/32) | 28 (14-56) | 11 (3-41) | 20 (8-56) | 13 (4-49) | 53 (38-73) | 23 (12-45) | ||||||
| SAMLS (N = FMUSP/FMRP/OUH) | ||||||||||||
| LR AML (N = 60/32/67) | 62 (50-76) | 48 (36-63) | <.001 | 0.70 (0.60-0.79) | 57 (42-78) | 34 (23-58) | .02 | 0.67 (0.54-0.80) | 83 (75-93) | 49 (38-63) | <.001 | 0.65 (0.55-0.75) |
| HR AML (N = 56/36/42) | 28 (18-42) | 13 (7-27) | 31 (19-52) | 9 (2-44) | 49 (36-67) | 20 (11-39) |
The numbers between parentheses represent the 95% CIs.
P value as calculated using log-rank test.
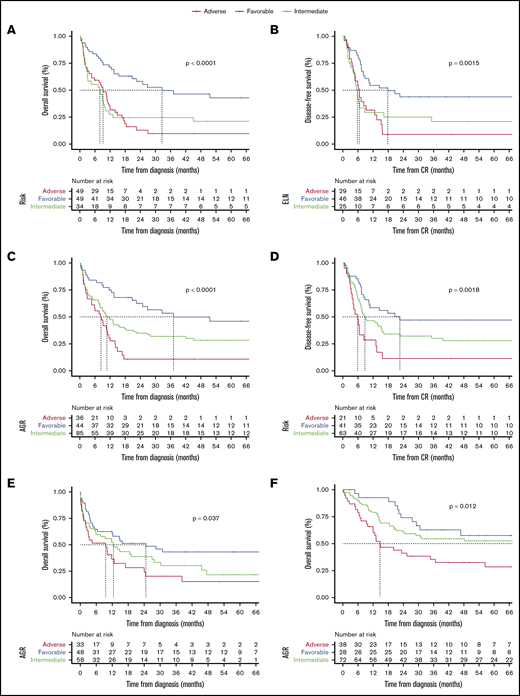
Survival curves as estimated per Kaplan-Meier method. (A) OS for ENL2017 in FMUSP. (B) DFS for ELN2017 in FMUSP. (C) OS for AGR in FMUSP. (D) DFS for AGR in FMUSP. (E) OS for AGR in FMRP. (F) OS for AGR in OUH. The dashed line indicates median survival.
Survival curves as estimated per Kaplan-Meier method. (A) OS for ENL2017 in FMUSP. (B) DFS for ELN2017 in FMUSP. (C) OS for AGR in FMUSP. (D) DFS for AGR in FMUSP. (E) OS for AGR in FMRP. (F) OS for AGR in OUH. The dashed line indicates median survival.
We then validated AGR using test cohorts (FMRP and OUH) and found that it could effectively discriminate between 3 risk groups for OS in both cohorts (FMRP, P = .037; OUH, P = .012) and for DFS in FMRP (P = .04), but not in OUH (P = .2). Median OS for FMRP was 24.6, 12.5, and 9.5 months for FR, IR, and AR, respectively. Median OS for OUH was not reached for FR patients, and was 81 and 14.7 months for IR and AR, respectively. Median DFS for FMRP and OUH were not reached and 26.6 months, 23.1 and 21.2 months, and 8.0 and 13.8 months for FR, IR, and AR, respectively. We thought that AGR may have failed to discriminate for DFS in the OUH cohort because of the high rate of HSCT. We confirmed this hypothesis by performing DFS analysis censoring HSCT in CR1, where we found a significant difference between 3 AGR risk groups (P = .017; Table 3; Figure 2E-F; supplemental Figure 6A-C).
Finding clinical variables to build a new AML survival score
We hypothesized that the addition of clinical variables to AGR may improve accuracy of risk stratification. We performed cutoff simulation outputs for variables that contribute to a new survival score. For each given variable, we chose the number of cutoffs as those that yielded the smallest AIC (ie, most minimalist; see “Methods”), and the cutoff values as those yielding the best-fitting model (supplemental Methods; supplemental Table 3). These were: 45 years for age and 3.8 g/dL for serum albumin. Whenever the simulation suggested more than 1 cutoff was necessary (eg, WBC counts), we proceeded to inspection of Kaplan-Meier curves to evaluate whether a dichotomization would be feasible. For WBC, we observed that individuals with WBC counts lower than 1.5 × 10³/μL and those with more than 30 × 103/μL had similar OS (P = .7; supplemental Figure 7A). We then grouped them into a single high-risk WBC group (<1.5 or >30.0 × 10³/μL; supplemental Figure 7B).
We performed multivariate CPHM for OS in FMUSP, and the model that yielded the smallest AIC (881.07) was: age (>45 years; HR, 1.48; 95% CI, 1.01-2.09; P = .047), serum albumin (<3.8 g/dL; HR, 2.1; 95% CI, 1.42-3.1; P < .001), WBC (<1.5 or >30 × 103/μL; HR, 1.52; 95% CI, 1.02-2.1; P = .045), and AGR IR (HR, 2.1; 95% CI, 1.24-3.5; P = .006) or AR (HR, 3.7; 95% CI, 2.94-6.6; P < .001; Figure 3A; supplemental Methods; supplemental Table 4; supplemental Figure 8). Variables that met SAMLS inclusion criteria for OS were age, albumin, WBC, and AGR (Figure 3B). For each of those variables, we assigned a weight based on their adjusted HR. SAMLS is the sum of the weights and ranges from 0 to 4 in multiples of 0.5. Albumin was an independent predictor for AML OS and validated over the 2 test cohorts (Figure 3A-E; Table 3; supplemental Table 5). Individual variables of SAMLS (ie, age, albumin, WBC, and AGR) were each also predictive of survival independent of allogeneic HSCT as a time-dependent variable in a CPHM for OS (supplemental Figure 9).
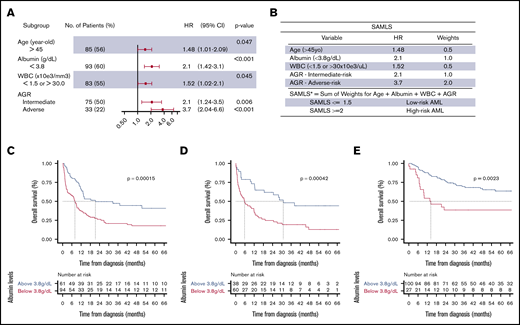
Multivariate CPHM, SAMLS, and albumin OS KM. (A) Multivariate CHPM for OS in FMUSP. (B) SAMLS features attributed weights and scoring. (C-E) OS curves as estimated per Kaplan-Meier method for albumin levels per cohort (C, FMUSP; D, FMRP; and E, OUH). *A patient who is 42 years old with albumin = 3.2, FR AGR, and WBC = 32 × 103/μL would have a SAMLS = 0 (age) + 1.0 (albumin) + 0 (AGR) + 0.5 (WBC) = 1.5; therefore, this patient is a LR SAMLS.
Multivariate CPHM, SAMLS, and albumin OS KM. (A) Multivariate CHPM for OS in FMUSP. (B) SAMLS features attributed weights and scoring. (C-E) OS curves as estimated per Kaplan-Meier method for albumin levels per cohort (C, FMUSP; D, FMRP; and E, OUH). *A patient who is 42 years old with albumin = 3.2, FR AGR, and WBC = 32 × 103/μL would have a SAMLS = 0 (age) + 1.0 (albumin) + 0 (AGR) + 0.5 (WBC) = 1.5; therefore, this patient is a LR SAMLS.
We did not model a survival score specifically for DFS, as none of the clinical variables was significant with multivariate CPHM analysis, and the best-fitted model (AIC, 641.6) only had AGR IR (HR, 2.0; 95% CI, 1.16-3.4; P = .013) and AR (HR, 3.6; 95% CI,1.83-7.0; P < .001) as statistically significant variables (supplemental Figure 10).
SAMLS survival analysis and comparative survival prediction accuracy
SAMLS integrates clinical prognostic parameters (age, albumin, and WBC) with AGR and divides patients with AML into low-risk (LR AML; SAMS ≤1.5) and high-risk AML (HR AML; SAMLS ≥2; supplemental Figure 11A-C). For the training cohort FMUSP, the difference in OS was highly significant (P < .001). Median OS was not reached for LR AML (>50% of LR individuals were alive at the end of follow-up), and was 7.3 months for HR AML. Five-year OS was 55% for LR and 9% for HR AML. ROC concordance statistic (C-statistic) in FMUSP using SAMLS was 0.80 (95% CI, 0.73-0.88), indicating that SAMLS yields a 26% increment in prediction accuracy compared with MRC cytogenetic assessment (ΔAUC, 0.17; 95% CI, 0.07-0.27; P < .001) and 21% when compared with AGR alone (ΔAUC, 0.14; 95% CI, 0.05-0.23; P < .001; Table 3; Figure 4A,D; supplemental Table 2; supplemental Figure 3E-F).
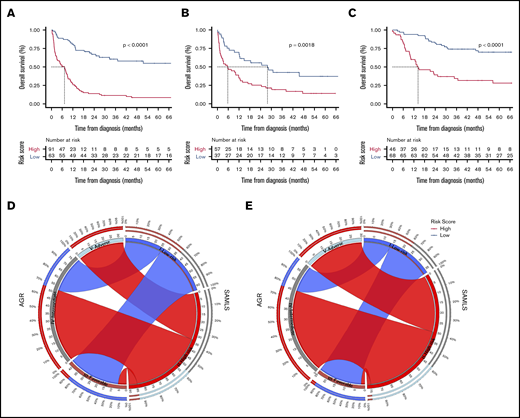
OS Kaplan-Meier curves for SAMLS. (A) FMUSP. (B) FMRP. (C) OUH. Circos table in FMUSP (D) and OUH (E) illustrating the shared information between AGR (left) and SAMLS (right); the inner ring depicts the absolute information within each risk category for AGR (brown, FR; gray, IR; and bright blue, AR) and for SAMLS (blue, LR; red, HR); the outer ring shows the percentage of that information that is shared between the 2 classification systems (eg, 66% of AGR IR become SAMLS HR in FMUSP); the ribbons illustrate the absolute number from AGR that will compose each SAMLS category and from where they come.
OS Kaplan-Meier curves for SAMLS. (A) FMUSP. (B) FMRP. (C) OUH. Circos table in FMUSP (D) and OUH (E) illustrating the shared information between AGR (left) and SAMLS (right); the inner ring depicts the absolute information within each risk category for AGR (brown, FR; gray, IR; and bright blue, AR) and for SAMLS (blue, LR; red, HR); the outer ring shows the percentage of that information that is shared between the 2 classification systems (eg, 66% of AGR IR become SAMLS HR in FMUSP); the ribbons illustrate the absolute number from AGR that will compose each SAMLS category and from where they come.
We applied SAMLS to 2 validation cohorts. For FMRP, SAMLS was significantly discriminatory for OS (P = .0018), even if the P value was slightly higher than for the test cohort. This may be because the number of patients with enough data for analysis was smaller in FMRP (N = 95) compared with FMUSP (N = 154) and OUH (N = 114; Figure 1). SAMLS C-statistic (0.74; 95% CI, 0.63-0.84) was 37% higher than those found for MRC (ΔAUC, 0.20; 95% CI, 0.10-0.31; P = .005) and 25% higher than AGR alone (ΔAUC, 0.15; 95% CI, 0.03-0.26; P = .003). SAMLS LR and HR individuals had a median OS of 28 and 6 months and 5-year OS of 38% and 14%, respectively (Table 3; Figure 4B; supplemental Table 2; supplemental Figure 12A).
Similarly, for OUH, SAMLS was discriminatory for OS (P < .001). C-statistics (0.77; 95% CI, 0.69-0.86) were 35% higher than those found for MRC (ΔAUC, 0.20; 95% CI, 0.10-0.28; P = .001) and 22% higher than for AGR (ΔAUC, 0.14; 95% CI, 0.08-0.22; P = .002). Median OS time for LR patients was not reached, and for HR patients it was 14 months. Five-year OS was 75% and 28% for LR and HR individuals, respectively (Table 3; Figure 4C,E; supplemental Table 2).
Although SAMLS was optimized for OS, we also tested how it would perform for DFS. Again, SAMLS was able to discriminate survival between risk groups, but its performance was not so consistent across all 3 cohorts (Table 3; supplemental Figure 12B-D). Furthermore, the clinical variables used in SAMLS can also be effectively combined with ELN2017 instead of AGR. The SAMLS-ELN2017 improved prediction by ∼20% compared with ELN2017 alone (supplemental Table 6; supplemental Figure 13).
Fewer than 10% of patients had missing SAMLS variables data in the training (FMUSP) cohort. For FMRP and OUH, this percentage was 34.5% and 27%, respectively. Patients who had missing data for SAMLS variables were excluded from analysis for both training and validation. Although we assume that missing data occurs in a random fashion, nonetheless, we wanted to assess whether exclusion of such patients would have biased the performance of SAMLS. Patients with missing data had a similar OS when compared with those with complete data (FMRP, P = .4; OUH, P = .28; supplemental Figure 15). Moreover, there is no significant difference between patients with complete data and those with missing data when measured either qualitatively (ie, which variables were missing in each patient; P = .66; supplemental Figure 16) or quantitatively (ie, the number of missing variables in a patient; P = .65; supplemental Figure 17). We also performed imputation to in-fill missing variables in both test cohorts, but did not find any significant change in SAMLS performance as assessed by the AUC (supplemental Figure 18; compare with AUC values in Table 3).
To assess whether or not HSCT in CR1 would result in survival difference within SAMLS risk groups, we took OUH data (HSCT in CR1 rate of ∼70%) and compared patients who had CR1 HSCT vs those consolidated with HiDAC alone. Patients who are SAMLS LR (CR1 HSCT, 22% AGR FR and 78% IR; HiDAC only, 52% AGR FR and 48% IR) had no statistical difference in OS (P = .5). In HR patients, CR1 HSCT conferred an OS advantage (P = .006) (supplemental Figure 19). We also assessed that SAMLS retained its discriminatory power in an AML population in which all patients were transplanted using OUH cohort HSCT data (P = .015; supplemental Figure 20).
Because age and albumin are continuous variables, we tested whether modeling them as such (as opposed to a single cutoff value) would alter performance of SAMLS in the FMUSP cohort. We found that this alternative continuous variable SAMLS performed in a similar way to categorical SAMLS, but would require more complex score calculation (supplemental Figure 21). In addition, we performed a survival analysis with this continuous alternative SAMLS showing similar results when compared with its categorical version in both the training cohort, FMUSP (supplemental Figure 22), and the test cohorts, FMRP and OUH (supplemental Figure 23). From a practical viewpoint, a categorical SAMLS (Figure 3B) would be easier to use at the bedside.
Discussion
To our knowledge, the current study represents the first attempt to validate ELN2017 in a health care setting with limited financial and infrastructural resources. ELN2017 is often not applicable where there is a lack of comprehensive cytogenetic and molecular diagnostic testing. We therefore propose a novel AGR score, in which patients can be risk-stratified using minimal cytogenetic-molecular information. AGR was as accurate as ELN2017, and more accurate than MRC for 3 independent cohorts in predicting OS, including a UK cohort in which patients had much higher rates of HSCT than the other 2. This indicates that AGR is independent of clinical outcome per se, and is applicable for patients with AML treated with different postremission approaches. Furthermore, AGR can be applied to more patients: it enables inclusion of 25% more patients than ELN2017, and from 10% to 30% more than MRC into our survival analysis. We postulate that AGR can also be applied in other settings (eg, clinical trials) with similar prediction accuracy, as it is based on the same biological concepts as standard cytogenetics and molecular evaluations. As AGR is based on characteristics of disease at diagnosis, its discriminatory power for DFS was affected by a high rate of HSCT in the OUH cohort. Censoring for HSCT restored the predictive performance of AGR.
We found that serum albumin was a strong independent OS predictor for previously untreated AML. Although it is a prognostic factor for several solid tumors,28 its role in AML has been limited to predicting outcomes after salvage therapy29 as a low-rank factor in early death score systems and a secondarily correlated feature with another primary study variable.5,30 A single-center French study recently found that very low albumin levels (<3.0 g/dL) had a negative effect on survival in patients with untreated AML.31 In our study, the cutoff of 3.8 g/dL makes our scoring system also relevant to cohorts in high-income countries in which higher baseline albumin levels are expected.32 The effect of hypoalbuminemia on survival is likely to be a result of its role as a surrogate inflammatory marker28 and a measure of nutritional state and fitness.33 Furthermore, drug binding to albumin makes it an important factor in pharmacokinetics in AML therapy.34 Albumin may serve as an objective surrogate marker of fitness, such that clinicians may be advised to offer attenuated induction therapy to reduce treatment-related mortality. In an age in which novel, nonintensive therapy regimens are yielding high rates of response,35,36 reducing treatment-related mortality becomes a high priority. However, the utility of albumin here would need to be tested in a prospective clinical trial.
We then devised a novel score SAMLS, which combines surrogate measures of patients’ performance status (age, albumin) together with leukemia biology variables (very low or very high WBC) and AGR. SAMLS improved OS prediction by up to 37% compared with genetic risk assessment alone. Our data show that SAMLS could model early (1 year) and late (5 years) survival differences. We have now validated SAMLS in 2 clinically independent cohorts, demonstrating its robustness despite variation in baseline patient characteristics, treatment settings (especially postremission therapy), and the economic conditions in health care delivery. We propose that where ELN2017 cannot be applied, AGR is a valid substitute. Our data suggest that SAMLS, incorporating AGR, can help clinicians decide on therapy. SAMLS would be strengthened by prospective validation for specific therapy inferences and is currently limited to patients younger than 65 years with mainly de novo AML. However, it is proof of principle that missing diagnostic molecular data are not a barrier to effective risk stratification and enable evaluation of patients in studies who would otherwise be excluded because of missing data. We plan to validate SAMLS in a future prospective study and to evaluate its performance in the varied therapeutic settings. We note that some AGR-FR patients will be deemed HR after SAMLS, whereas some AGR-IR patients will be classified as LR, indicating the importance of not relying on cytogenetic-molecular parameters alone (compare with multiple myeloma R-ISS).37 Prospective validation may incorporate additional clinical features into SAMLS, improving its prediction accuracy.
Although current recommendations for AML risk stratification are to move toward ever more complex genetic assessment,38 it will not be useful to the majority of the world’s population in the near- to medium-term future. We therefore propose that SAMLS, using AGR, is an adaptable alternative risk scoring system that can be used in AML clinical trials in which comprehensive cytogenetic-molecular diagnostic is not feasible. Once prospectively validated, we believe the flexibility of SAMLS will be helpful to better risk-stratify patients with AML in countries in which resources are scarce.
An abstract of this material was presented as a poster and won the ASH Abstract Achievement Award at the 61st annual meeting of the American Society of Hematology, Orlando, FL, 8 December 2019.
Data available via e-mail request to the corresponding author, Douglas R. A. Silveira, at douglas.rafaele@usp.br.
Acknowledgments
D.R.A.S. received a grant from Serviço de Hematologia da Faculdade de Medicina da Universidade de São Paulo, J.L.C.-S. and D.A.P.-M. are supported by Fundação de Amparo a Pesquisa do Estado de São Paulo (grants #2016/23191-4 and #2017/23117-1).
Authorship
Contribution: D.R.A.S. conceived and designed the study, collected, updated, and interpreted data, performed the statistical analyses, and drafted the manuscript; L.Q. conceived and designed the study, performed the experiments, collected and interpreted data, and drafted the manuscript; I.S.S. reviewed the statistical analyses, interpreted the data, and drafted the manuscript; A.C. performed the experiments and interpreted the data; J.L.C.-S., D.A.P.-M., B.B., L.N., W.F.S., E.D.R.P.V., A.R.L.-A., and F.T. obtained patient samples and collected, analyzed, updated, and interpreted data; G.V., A.P., and P.V. provided patient data; E.M.R., I.B., and V.R. designed the study; V.R. gave the final approval of the version to be submitted; and all authors reviewed and approved the manuscript before submission.
Conflict-of-interest disclosure: The authors declare no competing financial interests.
Correspondence: Douglas R. A. Silveira, Hospital das Clínicas da Faculdade de Medicina da Universidade de São Paulo, Ave Dr Enéas Carvalho de Aguiar 155, 1° andar, Cerqueira César, São Paulo SP 05403-000, Brazil; e-mail: douglas.rafaele@usp.br.

