

Key Points
We applied MR in a PheWAS to investigate potential MM risk factors.

Abstract
The etiology of multiple myeloma (MM) is poorly understood. Summary data from genome-wide association studies (GWASs) of multiple phenotypes can be exploited in a Mendelian randomization (MR) phenome-wide association study (PheWAS) to search for factors influencing MM risk. We performed an MR-PheWAS analyzing 249 phenotypes, proxied by 10 225 genetic variants, and summary genetic data from a GWAS of 7717 MM cases and 29 304 controls. Odds ratios (ORs) per 1 standard deviation increase in each phenotype were estimated under an inverse variance weighted random effects model. A Bonferroni-corrected threshold of P = 2 × 10⁻⁴ was considered significant, whereas P < .05 was considered suggestive of an association. Although no significant associations with MM risk were observed among the 249 phenotypes, 28 phenotypes showed evidence suggestive of association, including increased levels of serum vitamin B6 and blood carnitine (P = 1.1 × 10⁻³) with greater MM risk and ω-3 fatty acids (P = 5.4 × 10⁻⁴) with reduced MM risk. A suggestive association between increased telomere length and reduced MM risk was also noted; however, this association was primarily driven by the previously identified risk variant rs10936599 at 3q26 (TERC). Although not statistically significant, increased body mass index was associated with increased risk (OR, 1.10; 95% confidence interval, 0.99-1.22), supporting findings from a previous meta-analysis of prospective observational studies. Our study did not provide evidence supporting any modifiable factors examined as having a major influence on MM risk; however, it provides insight into factors for which the evidence has previously been mixed.
Introduction
Multiple myeloma (MM) is a tumor of plasma cells primarily within the bone marrow, which accounts for 20% of deaths in adults diagnosed with a hematological malignancy.1 Although survival for MM has improved markedly over the last decade with the introduction of new therapeutic agents, all patients eventually relapse.2
The global burden of MM has substantially increased in the last 30 years, but its incidence is highly variable among different countries. Although MM is more common in high sociodemographic index countries, the temporal increase in disease incidence has been higher in middle and low-middle sociodemographic index countries.3 These data suggest, although indirectly, that lifestyle factors influence the risk of developing MM.
Identifying etiological risk factors for MM has the potential to inform prevention and intervention strategies to reduce disease burden. Numerous factors have been reported to affect the risk of either MM or its precursor, monoclonal gammopathy of unknown significance, including obesity,4-8 diet,9-11 vitamin D,12,13 immune dysfunction,14 and radiation exposure.15,16 Aside from obesity, studies have either been inconsistent, null, or not independently validated.
These observational epidemiological studies are, however, prone to reverse causation, unmeasured confounding, and recall bias, which can preclude causal inferences.17 Furthermore, the studies conducted to date have had a limited scope of inquiry, examining factors with established associations for other cancers or for which information can be readily collected.
Mendelian randomization (MR) is an analytical method that exploits genetic variants as instrumental variables (IVs) to infer the causal relevance of an exposure to an outcome, such as a disease.18 Because the genetic variants are randomly assigned at conception, they are not influenced by reverse causation, and in the absence of pleiotropy (ie, genetic variants being associated with a disease through alternative pathways), they can provide unconfounded estimates of disease risk (Figure 1).18 So far, the application of MR to study MM etiology has been confined to examining the relationship between obesity19 or immunoglobulin20 level and MM risk. An agnostic strategy to identify causal relationships has, however, recently been proposed, by integrating phenome-wide association study (PheWAS) and MR methodology, termed MR-PheWAS.21
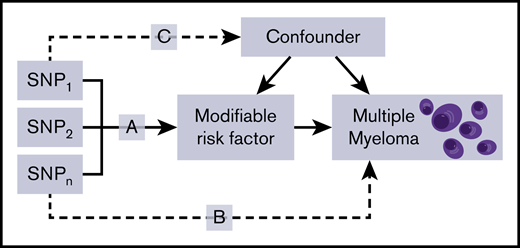
Principles of MR and the assumptions that need to be satisfied to derive unbiased causal effect estimates. Dashed lines represent direct causal and potential pleiotropic effects that would violate MR assumptions. A indicates genetic variants used as IVs are only associated with the modifiable risk factor; B indicates genetic variants only influence the risk of developing MM through the modifiable risk factor; C indicates genetic variants are not associated with any measured or unmeasured confounders. SNP, single-nucleotide polymorphism.
Principles of MR and the assumptions that need to be satisfied to derive unbiased causal effect estimates. Dashed lines represent direct causal and potential pleiotropic effects that would violate MR assumptions. A indicates genetic variants used as IVs are only associated with the modifiable risk factor; B indicates genetic variants only influence the risk of developing MM through the modifiable risk factor; C indicates genetic variants are not associated with any measured or unmeasured confounders. SNP, single-nucleotide polymorphism.
To gain insight into the etiological basis of MM, we conducted an MR-PheWAS to test purported associations and search for novel causal relationships. Specifically, we analyzed 249 phenotypes, proxied by 10 225 genetic variants, and summary genetic data from a genome-wide association study (GWAS) of MM comprising 7717 cases and 29 304 controls.22
Methods
Ethics approval and consent to participate
This MR analysis was undertaken using previously reported GWAS data. Therefore, ethical approval was not required, because these data came from the summary statistics of the published GWAS.22-26
Genetic instruments for phenotypes
Two-sample MR was conducted using the TwoSampleMR R package.27 Individual SNPs identified from recent meta-analyses or large studies published to date or curated by MR-Base27 were considered genetic instruments (supplemental Table 1).27 For each SNP, the chromosome position, the effect estimate expressed in standard deviations (SDs) of the trait per allele, and the corresponding standard errors (SEs) were recovered. SNPs were only considered potential instruments if they were associated with each trait at P < 5 × 10⁻⁸ in a GWAS of European populations and had a minor allele frequency >0.01. To avoid colinearity between SNPs for each trait, correlated SNPs within each trait were excluded (linkage disequilibrium threshold, r2 ≥ 0.01). Only SNPs with the strongest effect on the trait were considered (supplemental Table 2). The proportion of variance explained by the associated SNPs were computed from the association statistics. Traits were only considered if the power to identify ORSD of 0.67 or 1.50 was ≥80% (supplemental Table 1). We considered only continuous traits, because analysis of binary traits (eg, disease status) with binary outcomes in 2-sample MR frameworks can result in inaccurate causal estimates.28
Myeloma data
The association of each genetic instrument with MM risk was examined using a summary statistic from a recent meta-analysis of 6 MM GWASs (supplemental Table 3).22 After imputation, this meta-analysis related >3 million genetic variants to 7717 MM cases and 29 304 controls of European descent (supplemental Table 4). Because some potentially modifiable reproductive risk factors are female specific, where sex data were available, we further computed MM association statistics using 2190 female cases and 9060 female controls. Plasma progesterone association statistics were calculated for both combined sex and female only.
Estimation of study power
MR analysis
The MR methodology assumes that genetic variants, used as instruments for a risk factor, are associated with the risk factor and not with confounders or alternative causal relationships (Figure 1).18 Additionally, associations must be linear and unaffected by interactions.30 For each SNP, causal effects were estimated for MM as an odds ratio (OR) per 1 SD unit increase in the putative risk factor (ORSD), with 95% confidence intervals (CIs), using the Wald ratio. For traits with multiple SNPs as IVs, causal effects were estimated under inverse variance weighted random effects (IVW-RE) and IVW fixed effects models (supplemental Table 5). To assess the robustness of our findings, we also obtained weighted median estimates (WMEs)31 and mode-based estimates (MBEs)32 for results that were suggestively significant and had >2 SNPs included in the analysis (supplemental Table 6). Pleiotropy exists when a single genetic variant influences multiple phenotypes.33 Horizontal pleiotropy refers to a situation where the genetic instrument influences disease outcome via a different pathway that is not under investigation. Where pleiotropic effects are balanced and there exists no systematic bias across a set of genetic instruments, MR estimates remain valid. If horizontal pleiotropy is unbalanced (directional), it may result in a biased MR estimate.34 Directional pleiotropy was therefore assessed using MR-Egger regression (supplemental Table 7).35 A consistent effect across these 4 complementary methods (IVW, MBE, WME, and MR-Egger), which make different assumptions about horizontal pleiotropy, is less likely to be a false positive.36 We examined the potential impact of outlying and pleiotropic SNPs on causal estimates adopting a leave-one-out strategy, under the IVW-RE model (supplemental Table 8).27 This method performs the MR analysis but leaves out each SNP in turn to identify whether a single SNP is driving the association.27 Heterogeneity observed within each trait (I2) was calculated from Cochran’s Q value.
To account for multiple testing, we considered a Bonferroni-corrected P value of 2 × 10⁻⁴ (ie, 0.05/249 putative risk factors) as being statistically significant. A P > 2 × 10⁻⁴ but <.05 was considered to be suggestive evidence of a causal association. Statistical analyses were performed using R (version 3.4.0) and MR-Base.27
Availability of data and material
Results
The median proportion of variance explained by SNPs used as IVs for each of the 249 phenotypes examined as potential risk factors for MM was 5.45% (95% CI, 0.61%-60.43%). The power of our study to demonstrate a causal association for MM is tabulated for each exposure in supplemental Table 1.37
The strength of the association between each of the 249 phenotypes studied and risk of MM under IVW-RE models is shown in Figure 2, with corresponding tabulated data in supplemental Table 5. None of the traits showed a statistically significant association with risk of MM, whereas 28 phenotypes showed suggestive evidence of association (P < .05) with risk of MM (Figure 3).
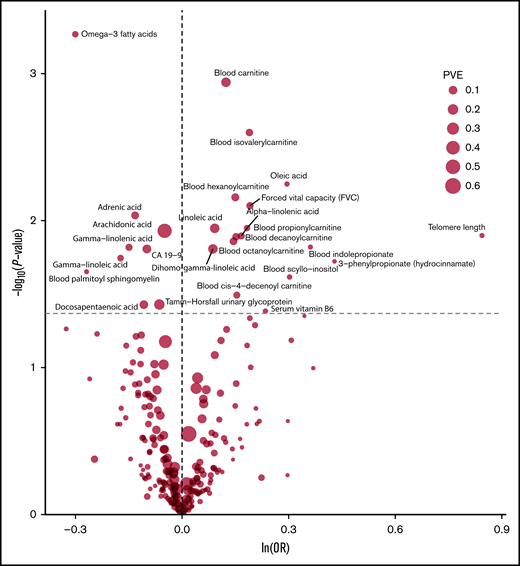
Volcano plot of the ORSD from IVW-RE or Wald ratio MR analysis of 249 phenotypes with risk of MM. Dashed gray line corresponds to P = .05. ln, natural logarithm; PVE, proportion of variance explained.
Volcano plot of the ORSD from IVW-RE or Wald ratio MR analysis of 249 phenotypes with risk of MM. Dashed gray line corresponds to P = .05. ln, natural logarithm; PVE, proportion of variance explained.
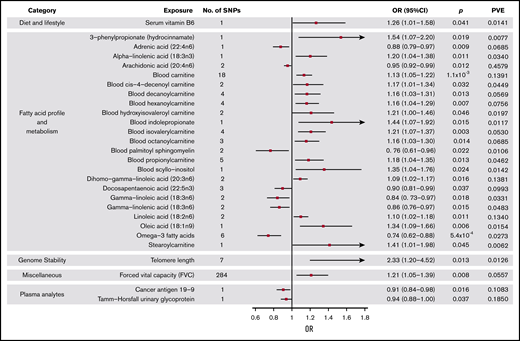
Forest plot of 28 phenotypes suggestively associated with risk of MM. 95% CIs indicated by horizontal lines. Vertical line denotes the null value (ORSD, 1).
Forest plot of 28 phenotypes suggestively associated with risk of MM. 95% CIs indicated by horizontal lines. Vertical line denotes the null value (ORSD, 1).
FAs and metabolism
Genetically predicted increased levels of α-linolenic acid and decreased levels of docosapentaenoic acid, both ω-3 fatty acids (FAs), showed a suggestive association with MM risk (Wald ratio: ORSD, 1.20; 95% CI, 1.04-1.38; P = .011 and IVW-RE: ORSD, 0.90; 95% CI. 0.81-0.99; P = .037, respectively). Overall, genetically predicted higher levels of ω-3 FAs were associated with a decreased risk of MM (IVW-RE: ORSD, 0.74; 95% CI, 0.62-0.88; P = 5.4 × 10⁻⁴), with causal effect estimates similar under WME and MBE approaches. In the ω-6 FA class, decreased levels of adrenic acid, arachidonic acid, and γ-linolenic acid and increased levels of dihomo-γ-linoleic acid and linoleic acid were associated with increased risk of MM (supplemental Table 5). Although FAs within the class were individually significant, overall, the ω-6 FAs as a class were not suggestively associated with increased risk of MM. Similarly, although higher levels of oleic acid were suggestively associated with increased MM risk, overall, ω-7 and ω-9 FA classes were not significant. FA metabolism involves sequential enzymatic conversions, and genes involved in FA processing form parts of numerous FA pathways. As a result, SNPs influencing the metabolism of 1 FA are often associated with circulating concentrations of multiple FAs.38 Leave-one-out analysis showed rs174547 to be a major driver of association across multiple FAs, although ω-3 FAs as a class remained significant after excluding this SNP from the analysis (P = .020; supplemental Table 8). When applying WME and MBE approaches, causal effect estimates for ω-3 FAs remained significant.
Increased levels of genetically predicted blood carnitine showed a suggestive association with increased risk of MM (ORSD, 1.13; 95% CI, 1.05-1.22; P = 1.1 × 10⁻³). MR-Egger analysis did not show evidence of bias in causal estimates (Pintercept > .05), and leave-one-out analysis demonstrated no single SNP as driving the association (supplemental Table 8). Although altered levels of a number of acyl carnitine esters were also suggestively significant for MM risk, including cis-4-decenoyl carnitine, decanoylcarnitine, hexanoylcarnitine, hydroxyisovaleroyl carnitine, isovalerylcarnitine, octanoylcarnitine, propionylcarnitine, and stearoylcarnitine, these acyl carnitines follow similar biosynthetic pathways, and their levels may be influenced by the same underlying SNPs.39
Telomere length
Although genetically increased telomere length was associated with MM risk (IVW-RE: ORSD, 2.33; 95% CI, 1.20-4.52; P = .013), there was marked heterogeneity among the 7 SNPs used as IVs (I2 = 86%). The association was primarily driven by the 3q26 TERC SNP (rs10936599), and after exclusion of this SNP, the association was nonsignificant (P = .161; supplemental Table 8; Figure 4). This SNP was previously shown to be associated with MM.25
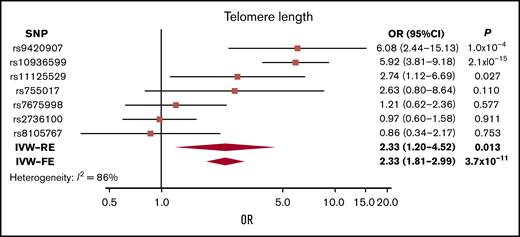
Forest plot showing the effect of alleles associated with longer telomere length on MM risk. 95% CIs indicated by horizontal lines. Diamonds represent overall causal effects estimated using IVW fixed effect (IVW-FE) and IVW-RE models, respectively, with CIs indicated by diamond width. Vertical line denotes the null value (ORSD, 1).
Forest plot showing the effect of alleles associated with longer telomere length on MM risk. 95% CIs indicated by horizontal lines. Diamonds represent overall causal effects estimated using IVW fixed effect (IVW-FE) and IVW-RE models, respectively, with CIs indicated by diamond width. Vertical line denotes the null value (ORSD, 1).
Diet, lifestyle, and other factors
Among the dietary factors considered, an increased level of serum vitamin B6 was suggestively associated with increased risk of MM (ORSD, 1.26; 95% CI, 1.01-1.58; P = .041), whereas vitamin D, which has been suggested as a risk factor for MM,13 was not associated with MM risk in our study (P = .54).
In keeping with previous findings from a meta-analysis of prospective studies that demonstrated an association between obesity and increased risk of MM (relative risk, 1.21; 95% CI, 1.08-1.35),8 increased body mass index was associated with increased MM risk, although nonsignificantly (OR, 1.10; 95% CI, 0.99-1.22; P = .082). All other obesity-related traits, including whole-body water mass, basal metabolic rate, weight, impedance of whole body, whole-body fat mass, body fat percentage, trunk fat percentage, waist circumference, birth weight, hip circumference, waist/hip ratio, and birth weight of first child, demonstrated nonsignificant associations (supplemental Table 5). Furthermore, our analysis showed nonsignificant relationships between interleukin-6 (IL-6) polymorphisms, IL-6 receptors, and MM risk (supplemental Table 5).
Discussion
Despite its comparative rarity, there is an unmet need in the understanding of MM etiology and risk factors, given the significant morbidity and mortality associated with the disease. Incidence of MM limits the power of a conventional cohort study to demonstrate a causal association. As a consequence, little is known about the etiological basis of MM, which is a barrier to developing strategies to reduce disease burden.40 This contrasts markedly to the success of cohort and case-control studies of common cancers, such as breast,41 lung,42 and colorectal cancers,43-45 which have identified major determinants of risk.
MR can circumvent many limitations of a conventional observational study, and the methodology is therefore increasingly being used to examine the impact of interventions on disease risk. The value of MR has been greatly enhanced by the wealth of GWAS data now available on multiple traits, which provide SNPs that can be used as IVs. These data have allowed us to test the relationship between multiple traits and MM risk in a hypothesis-free manner by performing an MR-PheWAS.
After correction for multiple testing, our MR-PheWAS did not provide significant evidence for associations between MM and any of the 249 genetically predicted phenotypes examined, which comprised traits relating to diet, lifestyle, metabolic factors, and anthropometrics. Application of a Bonferroni correction may have been overly stringent, because the exposures studied are likely not independent. Although identified associations are suggestive and require validation, we did find support for a nominal association between 28 exposures and risk of MM at P < .05.
Notably, among the 249 exposures analyzed using IVW-RE, a majority of the suggestively significant results were related to FA transport and FA oxidation (FAO) pathways, including carnitine, acyl carnitines, and ω-3 FAs. Briefly, FAs are transported into the mitochondria, where they are oxidized with concomitant production of nicotinamide adenine dinucleotide, nicotinamide adenine dinucleotide phosphate, flavin adenine dinucleotide, and ATP for energy to sustain cellular metabolism. During this process, carnitine, fatty acids and acyl-CoA are used.46 The metabolic requirement of plasma cells to perform antibody production and how this alters when the cells become malignant, as in MM, are relatively unknown, although studies have shown that B cells are metabolically flexible to support the production and secretion of antibodies.47 This metabolic reprogramming may be mediated by cells in the bone marrow microenvironment, such as bone marrow adipocytes, which store triglycerides and convert them to FAs. The constituents of the microenvironment may shift myeloma cells from aerobic glycolysis to use readily available FAs and produce more energy by FAO. As such, targeting FAO in MM is an area of interest for therapeutic investigation.46 Such metabolic reprogramming, itself a hallmark of cancer,48 is still not fully understood; however, this analysis provides support for aberrant FA and blood carnitine levels influencing MM risk using genetic markers as IVs.
Longer telomere length has been associated with risk of MM49 and other cancers,50 including glioma.51 In our analysis, we found that longer telomere length was nominally associated with increased risk of MM. This was predominantly driven by an SNP in the TERC gene, with other variants showing only limited support for an association (Figure 4; supplemental Table 8).
Additionally, in our analysis, we did not find an association between traits that have previously been considered as potential risk factors for MM, including vitamin D13 and IL-6 polymorphisms.52,53 We did, however, provide some supporting evidence for the reported association between obesity and risk of MM.6-8,40 Intriguingly, observational studies have demonstrated an increased risk of transformation from monoclonal gammopathy of unknown significance to MM in overweight and obese individuals,54,55 suggesting obesity-related pathways may be determinants of tumor progression rather than affecting the early phase of neoplasic development.
Our current analysis has been able to leverage a greater number of SNPs as IVs, thereby increasing study power; for 202 of the exposures, we had at least 80% power to demonstrate an ORSD of 1.33, stipulating a P value of .05. However, we cannot exclude the possibility that the null results we observed were simply a consequence of limited study power, if the true effect of these phenotypes is marginal. Furthermore, the causal effects estimated by MR-Egger were nonsignificant for many phenotypes, although this may have been the result of the reduced power of this test to detect causal effects compared with other MR methodologies.35
The strength of our MR study is the exploitation of large GWAS data sets to examine the relationship between multiple phenotypes and risk of MM, thereby increasing study power and enabling us to demonstrate effects of small magnitude. A central assumption in MR is that the variants used as IVs are associated with the exposure being investigated. To ensure this was the case, we only used SNPs associated with exposure traits at genome-wide significance (P < 5 × 10⁻⁸) from GWASs. Furthermore, only GWASs of European populations were used to limit bias from population stratification. Our analysis does, however, have limitations. Firstly, we were limited to studying phenotypes with genetic instruments available. Secondly, correcting for multiple testing inevitably means the potential for false negatives is not unsubstantial. Thirdly, even though we only considered traits for which we had ≥80% study power at ORSD of 1.50, for a large number of traits, we still had limited power to demonstrate causal associations of small effect.
In conclusion, our study provides further insight into the landscape of MM etiology and sheds light on factors for which the evidence from conventional epidemiological studies has been mixed. Specifically, we provide evidence against any of 249 traits being major risk factors for the development of MM. The advent of larger meta-analyses of MM GWAS data sets and exposures offers the prospect of using MR-based strategies to search for possible causal associations with smaller effect sizes.
Data sharing requests can be e-mailed to the corresponding author, Molly Went (molly.went@icr.ac.uk).
Acknowledgments
This work was supported by grants from Myeloma UK, Bloodwise, and Cancer Research UK (C1298/A8362). M.W. is supported by funding from Ralph Stockwell.
Authorship
Contribution: M.W., A.J.C., and P.J.L. performed statistical analyses; M.W., A.J.C., and R.S.H. drafted the manuscript; and all authors reviewed, read, and approved the final manuscript.
Conflict-of-interest disclosure: The authors declare no competing financial interests.
Correspondence: Molly Went, Division of Genetics and Epidemiology, The Institute of Cancer Research, 15 Cotswold Rd, Sutton, Surrey SM2 5NG, United Kingdom; e-mail: molly.went@icr.ac.uk.

