

Key Points
CTCL patient blood isolates show differential responses to JAK inhibition, with JAK2 expression negatively correlating to IC50.
JAK inhibition potentiates malignant cell killing in combination with BCL2, BET, HDAC, or proteasome inhibition.

Abstract
Cutaneous T-cell lymphoma (CTCL) is a malignancy of skin-homing T lymphocytes that is more likely to involve the peripheral blood in advanced stages. For such patients with advanced disease, there are few available systemic treatment options, and prognosis remains poor. Exome sequencing studies of CTCL have suggested therapeutic targets, including within the JAK/STAT pathway, but JAK inhibition strategies may be limited by patient-specific mutational status. Because our recent research has highlighted the potential roles of single and combination approaches specifically using BCL2, bromodomain and extra-terminal domain (BET), and histone deacetylase (HDAC) inhibition, we aimed to investigate the effects of JAK inhibition on CTCL cells and established CTCL cell lines when paired with these and other targeting agents. Peripheral blood malignant CTCL isolates exhibited differential responses to JAK inhibition, with JAK2 expression levels negatively correlating to 50% inhibitory concentration (IC50) values. Regardless of single-agent sensitivity, JAK inhibition potentiated malignant cell cytotoxicity in combination with BCL2, BET, HDAC, or proteasome inhibition. Combination inhibition of JAK and BCL2 showed the strongest potentiation of CTCL cytotoxicity, driven by both intrinsic and extrinsic apoptosis pathways. JAK inhibition decreased expression of BCL2 in the high-responder samples, suggesting a putative mechanism for this combination activity. These results indicate that JAK inhibition may have major effects on CTCL cells, and that combination strategies using JAK inhibition may allow for more generalized cytotoxic effects against the malignant cells from patients with CTCL. Such preclinical assessments help inform prioritization for combination targeted drug approaches for clinical utilization in the treatment of CTCL.
Introduction
The most common forms of cutaneous T-cell lymphoma (CTCL) exist on a clinical spectrum of mycosis fungoides (MF), presenting with primarily skin involvement, to Sézary syndrome (SS) in which malignant T cells expand to maintain a clonal population in the peripheral blood. Blood involvement in MF/SS has a poorer prognosis due to the associated erythrodermic cutaneous compromise, as well as the resulting immune suppression that increases the risk of secondary malignancies and infections.1,2 More recent advances in the understanding of CTCL biology have resulted in the development of targeted systemic therapies, including the histone deacetylase (HDAC) inhibitors vorinostat and romidepsin, anti-CCR4 monoclonal antibody mogamulizumab, and the anti-CD30 antibody drug conjugate brentuximab vedotin.3,4 Nonetheless, aside from limited therapeutic success with peripheral blood stem cell transplantation, a definitive cure has not yet been achieved, and there remains an unmet medical need for new, more effective treatments.5
Studies using next-generation sequencing, including exome sequencing and expression analysis, have elucidated the mutational landscape of MF/SS to show that genomic copy number alterations (GCNAs) comprise 92% of all driver mutations present within the CTCL cells over single-nucleotide variant (SNV) mutations.6-9 Our previous comparative genomic hybridization array,10,11 and more recent exome sequencing6 of >40 CTCL patient cells, revealed a diverse set of GCNAs and SNVs that do not readily permit a single-targeted precision medicine approach to treatment. Specific common pathways nonetheless seem to drive CTCL behavior across patients: (1) constitutive T-cell activation (eg, JAK/STAT and NF-κB mediated); (2) cell cycle release/apoptosis resistance (driven by, for example, BCL2 and MYC); and (3) chromatin remodeling/gene expression regulation (eg, DNA demethylation, histone acetylation). These data have informed the screening of recently discovered agents targeting these common pathways. We have previously shown that BCL2 inhibition effectively induces apoptosis in CTCL patient–derived malignant cells, and the combination of BCL2 and HDAC inhibition results in synergistic killing of CTCL cells.12 We have also shown that bromodomain and extra-terminal domain (BET) inhibition, alone and in combination with HDAC or BCL2 inhibition, substantially diminished the viability of CTCL cells.13 These approaches reveal synergism against a proportion of CTCL patient cell isolates and raise the possibility of formulating a combination therapy that might be more generally effective, despite the wide genetic diversity represented across patients with CTCL.
Genetic alterations of the JAK/STAT pathway are associated with hematologic malignancies and diseases linked to cytokine activation.14 In CTCL, STAT3 and STAT5 have been commonly reported as amplified,15-17 and our group has described SNVs and GCNAs (∼12.5%) of JAK2 in patient-derived CTCL cells.6 T-cell activation involves a cascade of protein interactions downstream of the T-cell receptor (TCR). In normal T cells, stimulation occurs with antigen presentation; however, in CTCL cells, mutations give rise to heightened activation of this cascade, driving T-cell proliferation and aberrant cytokine production. Although there are US Food and Drug Administration (FDA)–approved therapies and investigational agents enabling inhibition of various elements along this cascade, few have been examined in CTCL. One such agent, ruxolitinib (a JAK inhibitor), has been approved for myeloproliferative disorders and is being investigated for use in lymphomas.18 Ruxolitinib improves clinical well-being of patients and increases survival in myelofibrosis14 and is in phase 2 trials for refractory leukemia.19 Ruxolitinib was previously shown to have antiproliferative and cytotoxic effects on CTCL cell lines; however, the effect of JAK inhibition alone or in combination with other agents on CTCL patient–derived cells has not been previously reported.
We used our exome sequencing data to prioritize 5 candidate agents, FDA approved or in development for other malignancies and/or drug class in development for CTCL: venetoclax (BCL2), mivebresib (BET), bortezomib (proteasome), ruxolitinib (JAK1/2), and talazoparib (poly (ADP-ribose) polymerase [PARP]). We also used these data to prioritize 3 established agents FDA approved for CTCL: vorinostat (HDAC inhibitor), bexarotene (retinoid X receptor [RXR] agonist), and methotrexate (dihydrofolate reductase [DHFR] inhibitor), for efficacy screening against cells from patients with CTCL. Through in vitro preclinical assessment against CTCL patient–derived cells, we herein show the fuller potential of these agents, alone and in combination, as potential treatment modalities for CTCL. In particular, we highlight ruxolitinib by revealing that JAK inhibition is synergistically potentiated by HDAC, BCL2, proteasome, or BET inhibition, with the most substantial synergy observed in combination with BCL2 inhibition. Taken together, our data strongly suggest a potential role for JAK inhibition in the treatment of CTCL and lay the groundwork whereby a strategic combination formulation may move forward for clinical assessment.
Methods
Cell lines
MyLa 2059, HH, Sez4, SeAx, and Hut78 are well established cell lines and were cultured as previously reported.12,13
Patient samples
Blood samples were obtained from patients with CTCL at the Yale Cancer Center. Written informed consent was obtained from all subjects in accordance with the Yale Human Investigational Review Board. Peripheral blood samples from consenting patients and healthy donors were collected in lithium heparin tubes, and peripheral blood mononuclear cells were separated from whole blood as previously reported.12,13 Unfractionated peripheral blood mononuclear cells and isolated malignant T-cell populations were analyzed by using flow cytometry as previously described.
Fluorescence in situ hybridization panel
Purified blood mononuclear cells from patient samples were analyzed by fluorescence in situ hybridization as previously described.20 This method includes a panel of 11 probes designed to capture GCNAs present in 97.5% of patients with leukemic CTCL as elucidated in our previous exome study.6 The panel includes probes for TP53, MYC, RB1, CDKN2A, ATM, STAT3/5B, ARID1A, ZEB1, FAS, CARD11, and DNMT3A.
Cell viability assay
Single-agent and drug combination toxicity studies were performed at the Yale Center for Molecular Discovery using purified malignant cells, normal CD4+ T cells, or CTCL cell lines. Compounds were dissolved in dimethyl sulfoxide (DMSO) to obtain 100 mM stocks and manually diluted in a threefold series directly into 384-well Echo Qualified COC Source Plates (Labcyte, Sunnyvale, CA).
For dose–response toxicity experiments, 4000 to 6000 cells per well were plated into 384-well, black, clear-bottom assay plates (Corning 3764; Corning, Corning, NY) using MultiDrop Combi reagent dispensers (Thermo Fisher Scientific, Waltham, MA). Twenty nanoliters of compound was then transferred into assay plates using Echo 550 acoustic liquid handler (Labcyte). The same compound source plate was used for both single-drug and combination drug additions. Final DMSO concentration in the assay was 0.1%. Eighteen to 24 replicates of negative control (0.1% DMSO) and positive control (20% DMSO) were included in each assay plate. Following 72 hours incubation with the compounds, CellTiter-Glo reagent (Promega, Madison, WI) was added to measure total adenosine triphosphate accumulation as a readout for cell viability. Luminescence measurements were taken on a Synergy Neo2 plate reader (BioTek Instruments, Winooski, VT).
Mean and standard deviation of positive and negative control wells were used to quantify signal-to-background and Z′ values for each screening plate to ensure assay robustness. Drug data were normalized to the mean values of negative control (set as 0% effect) and positive control (set as 100% effect) wells within the plate. These calculations were performed in Microsoft Excel (Microsoft Corporation, Redmond, WA). Data were transferred to GraphPad Prism (GraphPad Software, La Jolla, CA), plotted and fit to models to determine 50% inhibitory concentration (IC50) values.
Statistical analysis
The mean IC50 was determined by using GraphPad Prism version 8.2.0. Combination index values, fold potentiation values, and standard errors were calculated by using the Chou-Talalay method21 in Microsoft Excel.
Quantitative real-time reverse transcription polymerase chain reaction
RNA was extracted and converted to complementary DNA, and TaqMan assays (Thermo Fisher Scientific) were used to examine gene expression differences relative to normal controls as previously reported.12,13
Caspase-3/7 assay and caspase-8 assay
Patient samples were incubated for 4, 12, and 24 hours as described in the “Cell viability assay” section. Following incubation, the Caspase-Glo 3/7 or Caspase-Glo 8 assay (Promega) was used to quantitate caspase activity, as per the manufacturer’s protocol. Plates were read by using a Victor X Light Luminescence Counter (PerkinElmer, Waltham, MA).
Results
CTCL patient population and peripheral blood analysis
To assess the potential of targeted agents for the treatment of CTCL with blood involvement, peripheral blood samples were obtained from 19 patients with MF/SS. Patient treatments included extracorporeal photopheresis with/without adjunct therapies (16 of 19), cytoreductive therapy (1 of 19), HDAC inhibition with romidepsin or vorinostat (4 of 19), or retinoid alone (1 of 19) (Table 1). Each patient was evaluated by using clinical flow cytometry, including TCR-Vβ usage, and for polymerase chain reaction–based TCR gene rearrangement status (Table 2). Seven patients (36.8%) were classified as B1, and 12 (63.2%) were classified as B2 based on the International Society for Cutaneous Lymphomas classification22 and the 2016 criteria of Gibson et al.23
Summary of CTCL patient characteristics
| Patient ID | Sex | Age, y | Therapy during experiment time period | Previous therapy | Experiment time period | Most recent prior treatment | FISH |
|---|---|---|---|---|---|---|---|
| 1 | M | 72 | ECP, IFN-α, BEX | None | 5/2019- | – | Normal for screened genes |
| 10/2019 | |||||||
| 2 | M | 78 | ECP, BEX, N2M | None | 1/2019- | – | Normal for screened genes |
| 8/2019 | |||||||
| 3 | F | 71 | ECP, BEX | ACIT | 2/2019 | – | – |
| 4 | F | 67 | ROMI, BEX | ECP | 11/2018-9/2019 | – | Amp: None |
| Del: TP53, ARID1A, ZEB1, DNMT3A, FAS | |||||||
| 5 | F | 77 | ECP, BEX | MTX, VORI, ROMI | 8/2019 | VORI: 07/2019 | Normal for screened genes |
| MTX, ROMI: 08/2019 | |||||||
| 6 | F | 41 | EPOCH, ROMI, MOGA | ECP, BEX, N2M, IMQ, BRENT | 10/2018- | BEX, N2M: 9/2018 | – |
| 9/2019 | BRENT: 11/2018 | ||||||
| 7 | M | 83 | ECP, BEX | None | 5/2019- | – | Amp: MYC |
| 10/2019 | Del: None | ||||||
| 8 | F | 63 | ROMI | ECP, IFN-α, BEX | 1/2019- | BEX: 04/2017 | Amp: MYC, STAT3 |
| 2/2020 | Del: TP53, ZEB1, DNMT3A | ||||||
| 9 | M | 69 | ECP, NB-UVB | None | 3/2019- | – | Normal for screened genes |
| 10/2019 | |||||||
| 10 | M | 56 | ECP, BEX | DUP, prednisone, topical steroids | 2/2020 | DUP: 01/2020 | Normal for screened genes |
| 11 | M | 75 | BEX | None | 5/2019- | – | Amp: None |
| 10/2019 | Del: DNMT3A, ATM,TP53, RB1, D9Z3, ZEB1, FAS | ||||||
| 12 | F | 83 | ECP, BEX | MTX | 8/2018 | MTX: 03/2018 | Amp: MYC, STAT3 |
| Del: TP53 | |||||||
| 13 | M | 80 | ECP, NB-UVB, IFN-α, BEX | NB-UVB | 6/2018 | ROMI: 2016 | Amp: MYC, STAT3, CARD11 |
| Del: TP53, ZEB1, DNMT3A, FAS | |||||||
| 14 | F | 77 | ECP, BEX | None | 7/2019 | – | Amp: MYC |
| 15 | M | 85 | ECP | None | 2/2020 | – | Amp: ARID1A, STAT3, ZEB1, DNMT3A, CARD11, CDKN2A, D9Z3 |
| 16 | M | 81 | ECP | BRENT, BEX, MTX | 11/2019 | BRENT: 10/2018 | Amp: MYC, CDKN2A, D9Z3 |
| BEX: 03/2019 | Del: DNMT3, FAS, ATM, RB1 | ||||||
| MTX: 07/2019 | |||||||
| 17 | M | 70 | ROMI | ECP, MYCO, ACIT, MTX, DUP, BEX, IFN-α | 12/2018- | MYCO,ACIT, MTX, DUP: 5/2018 | Amp: MYC, STAT3 |
| 10/2019 | BEX: 2/2019 | Del: ARID1A | |||||
| 18 | F | 67 | ECP, BEX, IFN-γ, IFN-α | NB-UVB | 11/2018- | – | Amp: MYC |
| 2/2020 | Del: ZEB1,TP53, CDKN2A, STAT3 | ||||||
| 19 | M | 75 | ECP, IFN-α, BEX | NB-UVB | 9/2019- | – | – |
| 10/2019 |
CTCL subtypes are subtypes at the time of diagnosis. Current therapy is defined as treatment at the time of experiment. Fluorescence in situ hybridization (FISH) panel20 screened genes include: ATM, TP53, RB1, CDKN2A, MYC, ARID1A, ZEB1, STAT3, DNMT3A, CARD11, and FAS. ACIT, acitretin; BEX, bexarotene; BRENT, brentuximab; DUP, dupilumab; ECP, extracorporeal photopheresis; EPOCH, etoposide, prednisone, vincristine, cyclophosphamide, doxorubicin; F, female; ID, identifier; IFN, interferon; IMQ, imiquimod; M, male; MOGA, mogamulizumab; MTX, methotrexate; MYCO, mycophenolic acid; N2M, mechlorethamine; NB-UVB, narrow band UV-B; ROMI, romidepsin; VORI, vorinostat.
Summary of CTCL patients’ peripheral blood flow cytometric parameters
| Patient ID | Sorted abnormal cell population | Vβ gene identified | PCR of TCR | CD4:CD8 ratio | CD4+CD7–, % | CD4+CD26–, % | B stage |
|---|---|---|---|---|---|---|---|
| 1 | CD3–CD4–CD8var+CD7dim/–CD26var+ | ND | + | 1.99 | 4.3 | 6.3 | B2 |
| 2 | CD3dim+CD4+CD7–CD26– | ND | − | 15.9 | 44.4 | 43.6 | B1 |
| 3 | CD3dim+CD4dim+CD7dim+CD26– | ND | + | 2.11 | 1.6 | 21.9 | B1 |
| 4 | CD3+CD4+CD7+CD26– | 20, 8 | + | 31.1 | 17 | 69.7 | B2 |
| 5 | CD3dim+CD4+CD7–CD26– | ND | + | 10.08 | 47.4 | 76.5 | B2 |
| 6 | CD3+CD4+CD7–CD26– | ND | + | 8.36 | 64.4 | 66.3 | B1 |
| 7 | CD3dim+CD4dim+CD7–CD26– | ND | + | 7.14 | 27.3 | 38.5 | B1 |
| 8 | CD3+CD4+CD7–CD26+/− | 13.6 | + | 3.18 | 9.3 | 11.6 | B2 |
| 9 | CD3dim+CD4+CD7+CD26– | 17 | + | 6.06 | 3.8 | 49.7 | B1 |
| 10 | CD3+CD4+CD7+CD26– | 1 | + | 6.48 | 18.3 | 60.1 | B2 |
| 11 | CD3dim+CD4+CD7–CD26– | 13.2 | +/− | 2.61 | 31.5 | 33.6 | B1 |
| 12 | CD3dim+CD4+CD7+CD26– | ND | + | 36.86 | 12.7 | 70.4 | B2 |
| 13 | CD3dim+CD4+CD26-CD7– | 12 | + | 57.4 | 71 | 80.3 | B2 |
| 14 | CD3+CD4+CD7–CD26– | ND | − | 5.32 | 71.6 | 79.5 | B2 |
| 15 | CD3+CD4+CD7–CD26– | ND | − | 1.53 | 31.9 | 37.2 | B2 |
| 16 | CD3+CD4+CD7+CD26– | ND | − | 23.82 | 76.4 | 85.8 | B2 |
| 17 | CD3+CD4+CD7dim/–CD26– | 22 | + | 2.76 | 24.7 | 36.1 | B2 |
| 18 | CD3+CD4+CD7–CD26dim/– | 27 | − | 18.71 | 65.2 | 58.4 | B1 |
| 19 | CD3dim+CD4dim+CD7–CD26– | 13.1 | + | 22.3 | 9.8 | 63.4 | B2 |
Abnormal cell phenotype identified by flow cytometry as phenotypically atypical: TCR-Vβ+ if >50% of the population of atypical cells express a single Vβ, or by indirect evidence, if there is <20% expression of the entire 27 Vβ antibody panel. Polymerase chain reaction positive (PCR+) if ≥1 of 3 PCRs identifies a clone. B stage based on International Society for Cutaneous Lymphomas classification and the 2016 criteria proposed by Gibson et al.23 Patients staged as B2 have elevated absolute CD3+ or CD3+CD4+ cell counts, with the upper limits of normal defined as >2245 cells/μL and >1612 cells/μL, respectively. CD4+CD7– and CD4+CD26– percent specifications are defined as percentage of peripheral blood mononuclear cells (lymphocytes and monocytes). ID, identifier; ND, not distinguished.
CTCL patient–derived samples, CTCL cell lines, and normal control samples exhibit variable sensitivity to JAK, BET, BCL2, HDAC, or proteasome inhibition
Malignant cells were purified from the peripheral blood of patients with MF/SS and exposed to a panel of 8 putative therapies in vitro. Agents tested (and their targets) included ruxolitinib (JAK1/2), mivebresib (BET), venetoclax (BCL2), vorinostat (HDAC), and bortezomib (proteasome), bexarotene (RXR), talazoparib (PARP), or methotrexate (DHFR). These agents were also evaluated in 5 established CTCL cell lines (MyLa 2059, HH, Sez4, Hut78, and SeAx), and in normal control CD4+ T lymphocytes purified from the blood of healthy individuals (Figure 1A).
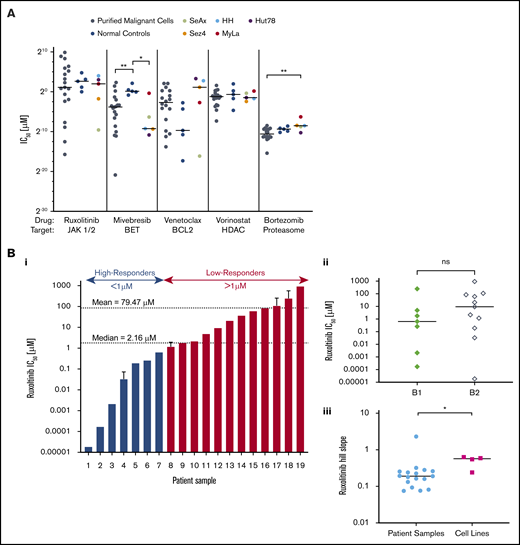
CTCL patient–isolated malignant cells and CTCL cell lines show variable sensitivity to a panel of targeted therapeutic agents. Isolated malignant cells from patient samples (n = 19), control samples (n = 5), and established CTCL cell lines (n = 5) were incubated with a range of concentrations of ruxolitinib, mivebresib, venetoclax, vorinostat, or bortezomib for 72 hours, from which IC50 values and Hill slopes were calculated. (A) Comparison of IC50 values. CTCL patient samples, control samples, and CTCL cell lines revealed statistically significant differences in response to mivebresib and bortezomib. (Bi) CTCL patient samples in order of IC50 of ruxolitinib. Patients were grouped as high-responders and low-responders to ruxolitinib at an a priori cutoff of 1 µM. The median and mean IC50 for patient samples were 2.16 µM and 79.47 µM, respectively. (Bii) IC50 differences for B1 and B2 stage to ruxolitinib were found to be nonsignificant. (Biii) Hill slope differences of CTCL patient samples and CTCL cell lines to ruxolitinib. (C) Dose–response curves for patient samples (C) and CTCL cell lines (D) for ruxolitinib (i), mivebresib (ii), venetoclax (iii), vorinostat (iv), and bortezomib (v). *P < .05; **P < .001. ns, not significant.
CTCL patient–isolated malignant cells and CTCL cell lines show variable sensitivity to a panel of targeted therapeutic agents. Isolated malignant cells from patient samples (n = 19), control samples (n = 5), and established CTCL cell lines (n = 5) were incubated with a range of concentrations of ruxolitinib, mivebresib, venetoclax, vorinostat, or bortezomib for 72 hours, from which IC50 values and Hill slopes were calculated. (A) Comparison of IC50 values. CTCL patient samples, control samples, and CTCL cell lines revealed statistically significant differences in response to mivebresib and bortezomib. (Bi) CTCL patient samples in order of IC50 of ruxolitinib. Patients were grouped as high-responders and low-responders to ruxolitinib at an a priori cutoff of 1 µM. The median and mean IC50 for patient samples were 2.16 µM and 79.47 µM, respectively. (Bii) IC50 differences for B1 and B2 stage to ruxolitinib were found to be nonsignificant. (Biii) Hill slope differences of CTCL patient samples and CTCL cell lines to ruxolitinib. (C) Dose–response curves for patient samples (C) and CTCL cell lines (D) for ruxolitinib (i), mivebresib (ii), venetoclax (iii), vorinostat (iv), and bortezomib (v). *P < .05; **P < .001. ns, not significant.
As shown in Figure 1, CTCL patient–derived malignant cells were more sensitive to BET inhibition with mivebresib than normal control lymphocytes (P = .006). CTCL cell lines were more sensitive to mivebresib than control samples (P = .016) and more resistant to bortezomib than patient-derived malignant cells (P = .011). Dose–response curves show that patient-derived CTCL cells (Figure 1C) and CTCL cell lines (Figure 1D) exhibited a wide range of sensitivities to bortezomib. Sensitivities to mivebresib, venetoclax, and vorinostat reflected results previously published by our group.12,13
At the wide range of concentrations tested, CTCL patient samples and normal control samples showed consistent resistance to cytotoxicity by bexarotene, talazoparib, and methotrexate: they exhibited no decrease in cell viability at any concentration tested in vitro. In contrast, the 5 CTCL cell lines showed variable sensitivity to these 3 agents (supplemental Figure 1).
CTCL patient samples exhibited varied sensitivities to JAK inhibition by ruxolitinib (Figure 1Bi). The IC50 for ruxolitinib ranged widely from 1.85 × 10⁻⁵ µM to 934 µM (median, 2.16 µM; mean, 79.47 µM). To better study the observed variation, we a priori delineated the tested samples into high-responders (IC50 ≤ 1 µM) and low-responders (IC50 > 1 µM). Less than one-half of the CTCL patient samples (7 of 19 [36.8%]) fell into the high-responder category, with a group mean IC50 of 0.16 µM compared with the low-responders (12 of 19 [63.2%]) with a group mean IC50 of 125.7 µM. IC50 values of low-responders were comparable to, and even greater than, those of normal control lymphocytes (mean, 43.02 µM) and CTCL cell lines (mean, 7.107 µM). There was no statistically significant difference in response to ruxolitinib between patients classified as B1 and B2 (Figure 1Bii). The effect of ruxolitinib was also assessed in 5 CTCL cell lines (Figure 1Di). The 5 CTCL cell lines exhibited variable sensitivity to ruxolitinib and showed a significantly higher Hill slope to ruxolitinib treatment than patient samples (P = .031) (Figure 1Biii).
Our results highlight the potential of JAK inhibition by ruxolitinib against patient-derived malignant CTCL cells as a potentially promising agent on preclinical assessment. We also show the lack of consistency of sensitivities of CTCL cell lines to the targeting agents tested, relative to both patient-derived and normal control lymphocytes. These results strongly suggest that preclinical analyses of drug responsivity are of limited value when only CTCL lines are examined.
Baseline JAK2 gene expression predicts in vitro sensitivity to ruxolitinib
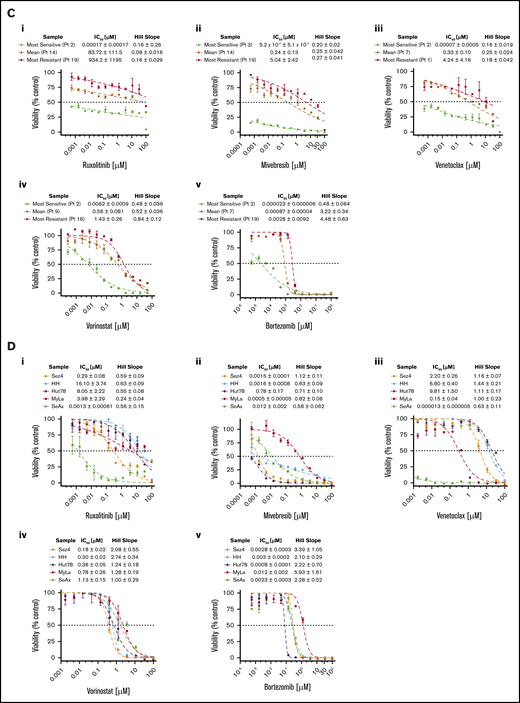
To study the differences in response to ruxolitinib among both primary patient-derived samples and CTCL cell lines, the baseline gene expression of five JAK/STAT family members (JAK1, JAK2, STAT3, STAT5B, and SOCS3) and six BCL2 family members (BCL2, BCL2L1, MCL1, BCL2L11, BCL2L2, and MYC) was measured by using quantitative reverse transcription polymerase chain reaction and evaluated relative to their mean expression in CD4+ T cells from normal control samples (Figure 2A). CTCL patient samples expressed ∼36-fold higher levels of JAK2 (P = .0004). On average, ruxolitinib low-responders expressed 29-fold greater JAK2, and high-responders expressed 45-fold greater JAK2 than normal controls; however, this difference was not statistically significant (P = .25). Patient samples also expressed increased STAT5B (64-fold greater; P = .0002) and BCL2L2 (11.3-fold greater; P = .02). They expressed lower levels of BCL2 (18-fold less, P = .12) than normal controls, consistent with previously published findings.12 Ruxolitinib IC50 values were plotted as a function of relative expression of JAK/STAT and BCL2 family members. A moderate negative correlation was detected between baseline expression of JAK2 and IC50 (Spearman r = −0.66; P = .015) (Figure 2B). IC50 correlation was not seen with mRNA expression levels of other JAK/STAT family members or BCL2 family members (supplemental Figure 2). These results suggest a role for elevated JAK2 expression in the survival of malignant CTCL cells.
Baseline gene expression of JAK-STAT and BCL2 family members and correlation to ruxolitinib IC50. Selected gene expression was measured in CTCL patient samples (n = 11) and normal control samples (n = 5). Results are expressed as a fold change from the mean of normal control samples. (A) Significantly increased JAK2, STAT5B, and BCL2L2 expression and decreased BCL2 expression were noted in CTCL patient samples relative to control samples. (B) JAK2 expression (fold change in malignant patient-derived cells compared with normal lymphocytes) may predict response to ruxolitinib in vitro, with higher JAK2 expression moderately correlated to sensitivity. *P < .05; ***P < .0001.
Baseline gene expression of JAK-STAT and BCL2 family members and correlation to ruxolitinib IC50. Selected gene expression was measured in CTCL patient samples (n = 11) and normal control samples (n = 5). Results are expressed as a fold change from the mean of normal control samples. (A) Significantly increased JAK2, STAT5B, and BCL2L2 expression and decreased BCL2 expression were noted in CTCL patient samples relative to control samples. (B) JAK2 expression (fold change in malignant patient-derived cells compared with normal lymphocytes) may predict response to ruxolitinib in vitro, with higher JAK2 expression moderately correlated to sensitivity. *P < .05; ***P < .0001.
Combination targeted inhibition results in improved killing of patient-derived CTCL cells
To evaluate the efficacy of targeted combination inhibition in vitro, 14 patient-derived malignant CTCL samples and one peripheral T-cell lymphoma sample were exposed to 3 × 3 concentrations (9 dose combinations) of each drug pair. For drugs to which the cells were sensitive to monotherapy, synergy for drug pairs was also calculated by using the Chou-Talalay method,21 with a combination index <1 indicative of a synergistic interaction.21,24 For drugs to which samples were resistant to monotherapy, fold-potentiation for combination drug pairs was determined. Fold-potentiation was calculated as fold improvement in percent kill by the combination drug pair relative to a single agent. Results were plotted as a heatmap of combination indices and fold-potentiation for each patient sample (supplemental Figure 3).
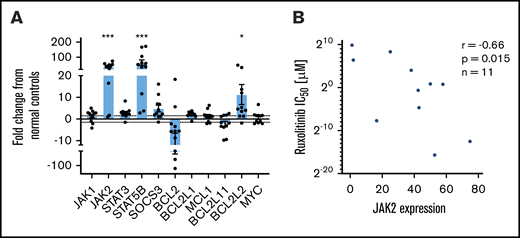
Representative heatmaps are shown for a patient sample that was a high-responder to JAK inhibition (Figure 3Ai) and a low-responder to JAK inhibition (Figure 3Aii). As previously reported by our group,12,13 all CTCL patient samples tested consistently showed synergy with combination inhibition of BCL2 plus HDAC, BCL2 plus BET, and HDAC plus BET. Of note, ruxolitinib in combination with either venetoclax, vorinostat, or bortezomib showed increased cytotoxicity relative to single drug exposure, regardless of single agent sensitivity. Although principally acting as cytostatic agents, bexarotene, methotrexate, and talazoparib exhibited weak to little cytotoxic effects on CTCL cell viability as single agents; nonetheless, these drugs displayed the capacity to potentiate cytotoxicity induced by venetoclax, vorinostat, bortezomib, and mivebresib when used in combination. Combination indices for the highest percent kill achieved with each combination are presented in Figure 3Bi. Ruxolitinib plus venetoclax and mivebresib plus venetoclax consistently showed the strongest synergy, with combination indices significantly better (lower) than 6 of 9 and 8 of 9 other combinations, respectively (P < .05 for each comparison). For comparison, fold-potentiation for these same combinations was also plotted (Figure 3Bii). The highest fold improvement in CTCL cytotoxicity was again seen with ruxolitinib plus venetoclax, on average a ∼45-fold improvement compared with venetoclax alone and significantly greater than 8 of 9 other combinations tested (P < .05 for each comparison).
Preclinical assessment of targeted drug combinations against CTCL patient–derived samples. CTCL patient cells were incubated with each of 5 targeted agents (ruxolitinib, venetoclax, vorinostat, mivebresib, and bortezomib) individually to calculate single-agent IC50 values. Cells were then incubated with combinations of each drug at 3 concentrations, and the combination index (CI) was calculated by using the Chou-Talalay method. Resulting CIs were plotted as heatmaps. (A) Representative heat map of a high-responder to ruxolitinib (i) and a low-responder to ruxolitinib (ii). (Bi) The CI at 1% to 30% viability for patient-derived samples exposed to combinations of ruxolitinib, venetoclax, vorinostat, and mivebresib. Strongest synergy was seen with venetoclax plus ruxolitinib and venetoclax plus mivebresib across patient samples. (Bii) The fold improvement in cytotoxicity for the same concentrations was calculated and plotted for these CTCL patient–derived samples exposed to combinations of ruxolitinib, venetoclax, vorinostat, and mivebresib. The highest fold potentiation was seen with the combination of ruxolitinib and venetoclax. Very strong synergy, CI < 0.1; strong synergy, CI < 0.3; synergy, CI < 0.7; slight to moderate synergy, CI < 0.9; additive effect, 0.9 < CI < 1.1; slight to moderate antagonism, CI < 1.45; antagonism, CI < 3.3; strong antagonism, CI < 10; and very strong antagonism, CI > 10. Adapted from Chou.21 Very strong potentiation, >10-fold; strong potentiation, two- to 10-fold; potentiation, 1.5- to twofold; moderate antagonism, 0.6- to 0.8-fold; antagonism, 0.3- to 0.6-fold; strong antagonism, <0.3-fold.
Preclinical assessment of targeted drug combinations against CTCL patient–derived samples. CTCL patient cells were incubated with each of 5 targeted agents (ruxolitinib, venetoclax, vorinostat, mivebresib, and bortezomib) individually to calculate single-agent IC50 values. Cells were then incubated with combinations of each drug at 3 concentrations, and the combination index (CI) was calculated by using the Chou-Talalay method. Resulting CIs were plotted as heatmaps. (A) Representative heat map of a high-responder to ruxolitinib (i) and a low-responder to ruxolitinib (ii). (Bi) The CI at 1% to 30% viability for patient-derived samples exposed to combinations of ruxolitinib, venetoclax, vorinostat, and mivebresib. Strongest synergy was seen with venetoclax plus ruxolitinib and venetoclax plus mivebresib across patient samples. (Bii) The fold improvement in cytotoxicity for the same concentrations was calculated and plotted for these CTCL patient–derived samples exposed to combinations of ruxolitinib, venetoclax, vorinostat, and mivebresib. The highest fold potentiation was seen with the combination of ruxolitinib and venetoclax. Very strong synergy, CI < 0.1; strong synergy, CI < 0.3; synergy, CI < 0.7; slight to moderate synergy, CI < 0.9; additive effect, 0.9 < CI < 1.1; slight to moderate antagonism, CI < 1.45; antagonism, CI < 3.3; strong antagonism, CI < 10; and very strong antagonism, CI > 10. Adapted from Chou.21 Very strong potentiation, >10-fold; strong potentiation, two- to 10-fold; potentiation, 1.5- to twofold; moderate antagonism, 0.6- to 0.8-fold; antagonism, 0.3- to 0.6-fold; strong antagonism, <0.3-fold.
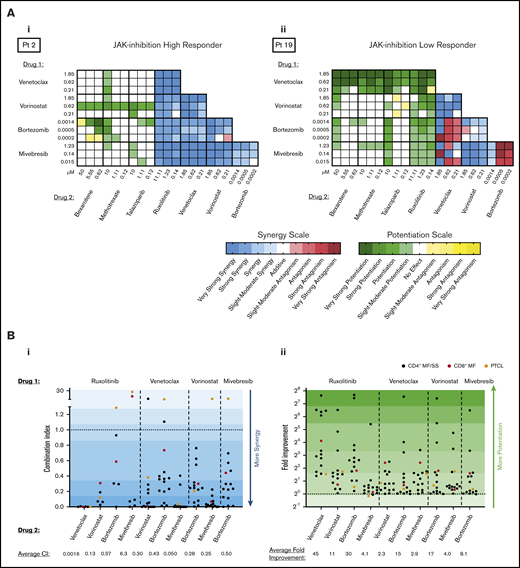
Because JAK inhibition alone resulted in differential responses among patient-derived malignant CTCL cells, we sought to investigate the degree to which combination approaches might overcome this varied responsiveness. To visualize the extent to which JAK1/2 inhibition in combination with BCL2, HDAC, or proteasome inhibition potentiates malignant cell killing across all patient-derived samples and cell lines tested, heatmaps were prepared (Figure 4). Patient-derived CTCL samples that were high-responders to ruxolitinib consistently displayed moderate to very strong synergy at the majority of combination concentrations tested. Of note, those patient samples considered low-responders to ruxolitinib also exhibited consistent potentiation of cytotoxicity by agent pairs that included ruxolitinib, particularly when ruxolitinib was used in combination with venetoclax or bortezomib. Although 2 samples tested exhibited antagonism with ruxolitinib when used in combination with vorinostat, bortezomib, or mivebresib, these samples were notably isolated from 2 atypical cases (peripheral T-cell lymphoma not otherwise specified and CD8+ MF), suggesting a difference in action of these therapies on these isolates compared with the more classic larger set of CD4+ MF/SS isolates. By comparison, the CTCL cell lines were consistently more resistant to all drug combinations tested, once again revealing a major discrepancy between the responses of CTCL cell lines and CTCL patient-derived isolates.
![Synergy and potentiation assessment of targeted agent combinations using ruxolitinib. Patient-derived malignant CTCL samples (n = 14) and CTCL cell lines (n = 5) were incubated in combinations of ruxolitinib with either venetoclax, vorinostat, bortezomib, or mivebresib at 3 concentrations (high [H], medium [M], and low [L]), and combination indices (CIs) were calculated. (A) CIs were plotted as heatmaps for patient-derived samples (i); percent kill plotted for the same concentrations (ii). Very strong synergy was seen with ruxolitinib and venetoclax across all 5 high-responder patients. Strong to very strong potentiation was seen among low-responders. (B) Representative curves of combinations of ruxolitinib with venetoclax (i), vorinostat (ii), bortezomib (iii), and mivebresib (iv) for a high-responder. The most substantial synergy was observed with ruxolitinib and venetoclax.](https://ash.silverchair-cdn.com/ash/content_public/journal/bloodadvances/4/10/10.1182_bloodadvances.2020001756/1/m_advancesadv2020001756f4.png?Expires=1767732183&Signature=VjoUEDca6AUTjyuYtvsi64Epruf5uUjstHG6ieT5luIQcsdSOv~jUC2TSmdO2Ep5ESyeUEkCBdQ1M5iGsJ1i8yfCXxSe~NvsFx1ZkyRNoKGG9TO~bpBwT-VDc5ickiG~Jjut9CiCgpzR7eAcso9QyH1oM~kU8xf9vUpJdWx3v-c2o4FJfdhMn7rZoAVjixSAeTHSmTKth~vv21jJh1Uvyl-Ka8qxwkh~nK-EDg2ivRCK~gqu0D8YT2hSyJpeA5NOlp223-~bqMNszaNV27Xb8Auto5nKOU07AQqr6b4DH~Q0iXepRk9QChmEPv6adJ~MYSpHhw6Ql2BrHLZh74-zZg__&Key-Pair-Id=APKAIE5G5CRDK6RD3PGA)
Synergy and potentiation assessment of targeted agent combinations using ruxolitinib. Patient-derived malignant CTCL samples (n = 14) and CTCL cell lines (n = 5) were incubated in combinations of ruxolitinib with either venetoclax, vorinostat, bortezomib, or mivebresib at 3 concentrations (high [H], medium [M], and low [L]), and combination indices (CIs) were calculated. (A) CIs were plotted as heatmaps for patient-derived samples (i); percent kill plotted for the same concentrations (ii). Very strong synergy was seen with ruxolitinib and venetoclax across all 5 high-responder patients. Strong to very strong potentiation was seen among low-responders. (B) Representative curves of combinations of ruxolitinib with venetoclax (i), vorinostat (ii), bortezomib (iii), and mivebresib (iv) for a high-responder. The most substantial synergy was observed with ruxolitinib and venetoclax.
Synergy and potentiation assessment of targeted agent combinations using ruxolitinib. Patient-derived malignant CTCL samples (n = 14) and CTCL cell lines (n = 5) were incubated in combinations of ruxolitinib with either venetoclax, vorinostat, bortezomib, or mivebresib at 3 concentrations (high [H], medium [M], and low [L]), and combination indices (CIs) were calculated. (A) CIs were plotted as heatmaps for patient-derived samples (i); percent kill plotted for the same concentrations (ii). Very strong synergy was seen with ruxolitinib and venetoclax across all 5 high-responder patients. Strong to very strong potentiation was seen among low-responders. (B) Representative curves of combinations of ruxolitinib with venetoclax (i), vorinostat (ii), bortezomib (iii), and mivebresib (iv) for a high-responder. The most substantial synergy was observed with ruxolitinib and venetoclax.
Representative dose–response curves of the CTCL patient sample that was most sensitive to ruxolitinib are shown in Figure 4B. The strongest synergy was consistently seen at all concentrations tested for ruxolitinib and venetoclax as indicated by markedly low combination index values (in the 10−11 to 10−7 range).
Combination BCL2 and JAK1/2 inhibition leads to marked increases in apoptosis induction
To determine whether the observed dose-dependent decrease in cell viability of CTCL cells exposed to combination therapy with ruxolitinib and venetoclax was due in part to apoptosis induction, caspase-3/7 and caspase-8 activation was measured in patient-derived CTCL samples at 4-, 12-, and 24-hour time points after exposure to ruxolitinib or venetoclax; this testing was conducted alone or in combination across 5 concentrations (Figure 5). Exposure to ruxolitinib or venetoclax alone independently induced total and extrinsic caspase-dependent apoptosis, with a trend toward higher apoptosis observed with venetoclax compared with ruxolitinib. The combination of JAK1/2 inhibition and BCL2 inhibition showed a striking increase in both caspase-3/7– and caspase-8–dependent apoptosis compared with either JAK or BCL2 inhibition alone at each time point and concentration tested (P < .05). At the highest concentration tested at 12 hours, the mean percent induction of caspase-3/7 and caspase-8 activity from control was ∼5000% and ∼1700%, respectively.
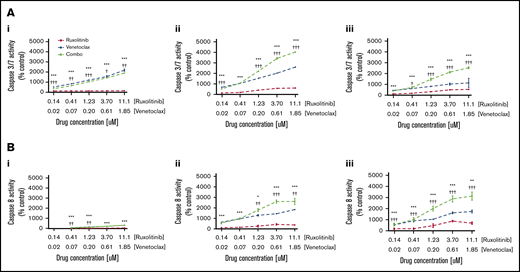
Effects of JAK inhibition and synergy with BCL2 inhibition are mediated in part by induction of apoptosis by caspase-3/7 and caspase-8. (A) Representative curves of caspase 3/7 activity at 4 hours (i), 12 hours (ii), and 24 hours (iii) shown for patient 9 after incubation with ruxolitinib and venetoclax. (B) Caspase-8 activity at 4 hours (i), 12 hours (ii), and 24 hours (iii) shown for patient 9 after incubation with ruxolitinib and venetoclax. Significant increase in caspase-3/7 activity reflecting total apoptosis, and caspase-8 activity reflecting extrinsic apoptosis, was seen with combination therapy compared with either ruxolitinib or venetoclax alone at all concentrations and time points tested. *P < .05; **P < .01; ***P < .001 (P value against ruxolitinib). †P < .05; ††P < .01; †††P < .001 (P value against venetoclax).
Effects of JAK inhibition and synergy with BCL2 inhibition are mediated in part by induction of apoptosis by caspase-3/7 and caspase-8. (A) Representative curves of caspase 3/7 activity at 4 hours (i), 12 hours (ii), and 24 hours (iii) shown for patient 9 after incubation with ruxolitinib and venetoclax. (B) Caspase-8 activity at 4 hours (i), 12 hours (ii), and 24 hours (iii) shown for patient 9 after incubation with ruxolitinib and venetoclax. Significant increase in caspase-3/7 activity reflecting total apoptosis, and caspase-8 activity reflecting extrinsic apoptosis, was seen with combination therapy compared with either ruxolitinib or venetoclax alone at all concentrations and time points tested. *P < .05; **P < .01; ***P < .001 (P value against ruxolitinib). †P < .05; ††P < .01; †††P < .001 (P value against venetoclax).
BCL2 family member gene expression changes in response to JAK1/2 inhibition
To gain insight into the mechanism of action of synergy/potentiation of ruxolitinib and venetoclax, we incubated 9 patient-derived CTCL samples for 24 hours with 1 µM ruxolitinib and 0.2 µM venetoclax before isolation of RNA and measurement of the relative expression of JAK/STAT and BCL2 family members (Figure 6). Four of the CTCL patient–derived samples were high-responders to ruxolitinib, and 5 were low-responders. After exposure to ruxolitinib, there was a marked ∼38-fold decrease in BCL2 expression in high-responders and an average approximately fivefold decrease among low-responders; this difference approached statistical significance (P = .055). Nonetheless, combination exposure to ruxolitinib and venetoclax did not affect gene expression differently than treatment with ruxolitinib alone. Taken together, our findings show that JAK inhibition efficiently induces apoptosis in CTCL patient–derived cells in vitro and is potentiated by BCL2 inhibition regardless of JAK inhibition sensitivity. This scenario suggests that this combination therapy might benefit patients with advanced CTCL, including those refractory to single-agent therapy.

Alterations in JAK-STAT and BCL2 family member gene expression induced by ruxolitinib and venetoclax. Patient-derived malignant CTCL samples of high-responders and low-responders were incubated with 1 µM ruxolitinib, 0.2 µM venetoclax, or combination for 24 hours. Results expressed as fold change from untreated vehicle controls in high-responders (A) and low-responders (B). Notably, high-responders showed an average of ∼38-fold decrease in BCL2 expression when incubated with ruxolitinib alone or in combination, substantially greater than the fold decrease seen in low-responders (approximately fivefold).
Alterations in JAK-STAT and BCL2 family member gene expression induced by ruxolitinib and venetoclax. Patient-derived malignant CTCL samples of high-responders and low-responders were incubated with 1 µM ruxolitinib, 0.2 µM venetoclax, or combination for 24 hours. Results expressed as fold change from untreated vehicle controls in high-responders (A) and low-responders (B). Notably, high-responders showed an average of ∼38-fold decrease in BCL2 expression when incubated with ruxolitinib alone or in combination, substantially greater than the fold decrease seen in low-responders (approximately fivefold).
Discussion
Informed by recent whole-exome sequencing data for CTCL,6 we herein aimed to directly compare and prioritize 8 candidate agents, FDA approved or in development for other malignancies or drug class in development for CTCL, for assessment against CTCL patient–derived cells, alone or in combination. Our group has previously shown that single or combination exposure to BCL2, BET, and HDAC inhibition substantially diminished viability of CTCL cells in vitro.12,13 Our results herein extend these findings to show sensitivity of patient-derived malignant CTCL cells to proteasome and JAK1/2 inhibition, while providing a fuller preclinical analysis of the potential for combination drug therapy to act synergistically and overcome single-agent resistance.
Dysregulation of JAK-STAT signaling has been reported for myeloid and lymphoid malignancies.25 Studies have suggested a role for the JAK-STAT pathway in pathogenesis of CTCL, underscored by the identification of several SNVs and GNCAs in this pathway.6 Further encouraged by the published data showing the antiproliferative and cytotoxic effects of ruxolitinib on CTCL cell lines,26 and our identification herein of significantly elevated expression levels of JAK2, STAT5B, and BCL2L2 in patient-derived malignant CTCL cells, we sought to explore further the potential of JAK inhibition for the treatment of CTCL and revealed a markedly varied response to such by CTCL patient–derived samples. Our data indicate that expression of JAK2 is moderately inversely correlated with sensitivity to ruxolitinib, with higher expression levels portending increased sensitivity. Although such biomarker-response associations have provided justification for personalized medicine approaches to targeted cancer therapy, data have also suggested that combination targeted drug therapy may provide consistent efficacy across a wider variety of patients.27,28 Despite the known genetic diversity among CTCL patient samples, we observed a consistent synergy among combinations of JAK2 inhibition paired with BCL2, HDAC, BET, or proteasome inhibitors. Furthermore, the agents (eg, methotrexate, talazoparib, bexarotene) that showed minimal cytotoxicity when tested alone nonetheless exhibited potentiation of kill by BCL2, HDAC, BET, and proteasome inhibitors when used in combination.
JAK inhibition showed consistent synergistic and/or potentiation effects, regardless of single-agent sensitivity, when used in combination with a BCL2, proteasome, BET, or HDAC inhibitor. Furthermore, JAK inhibition in combination with BCL2 inhibition was found to be consistently the most synergistic combination acting against patient-derived malignant CTCL cells. Synergistic effects were also observed by significantly increased activation of caspase3/7–dependent apoptosis as well as caspase-8–dependent apoptosis in the combination compared with monotherapy. Caspase-8 initiates the extrinsic apoptosis pathway, whereas caspase3/7 activity is a marker of total apoptosis, both extrinsic and intrinsic. These data suggest a role for both FAS and TNF-related apoptosis-inducing ligand–mediated extrinsic apoptosis, as well as intrinsic apoptosis associated with reductions in antiapoptotic factors in combination therapy with ruxolitinib plus venetoclax. The JAK-STAT pathway is reportedly involved in the regulation of BCL2 expression in T lymphocytes as well as hematopoietic stem cells.27,28 We found a decreased expression of BCL2 protein in JAK inhibition high-responders compared with JAK inhibition low-responders. The major function of BCL2 is to inhibit apoptosis via direct binding with BIM. BCL2 is downstream of the JAK/STAT pathway. Upon exposure to ruxolitinib, JAK/STAT pathway inhibition and resultant decreased expression of BCL2 may play a role in increased apoptosis of malignant CTCL cells. Decreased BCL2 expression on exposure of ruxolitinib, combined with direct inhibition of BCL2 protein function by venetoclax, suggests a putative mechanism of cooperative activity of these 2 therapies by decreasing both the levels of BCL2 expression as well as BCL2 activity, resulting in increased apoptosis.
In testing our candidate agents on 5 well-established CTCL cell lines (MyLa 2059, HH, Sez4, Hut78, and SeAx) in vitro, we found consistently divergent responses of these cell lines compared with patient-derived malignant CTCL cells. This scenario was seen in both single-agent and combination studies. These data highlight the limitations of CTCL cell lines in recapitulating the behavior of patient-derived CTCL cells in vitro, as well as their limited applicability as preclinical models. CTCL is a heterogeneous disease, with patient CTCL cells having a wide diversity of genomic and cellular alterations driving their behavior. In contrast, the majority of cell lines have certain driver mutations that may not reflect the true diversity of disease in patients. Furthermore, prolonged cell culture is likely to result in occurrence of genomic and transcriptomic changes that are beneficial to survival in culture.29 Indeed, it has been shown that under prolonged culture, many cell lines, regardless of tissue of origin, behave more like each other than like patient samples.30 Our data add to this literature, showing the differences in response to targeted treatment in CTCL cell lines and patient-derived samples.
A limitation of the current study is that we investigated the effect of these targeted agents on patient-derived malignant CTCL cells from patients who have received previous treatments (Table 1). However, such patients reflect the heterogeneity of treatment backgrounds of patients with advanced CTCL for whom we aim to provide preclinical data. Despite this heterogeneity, the current study nonetheless found combinations of targeted agents that were successful in causing malignant cell apoptosis in vitro in the majority of patient samples tested (ie, regardless of the prior/current treatments of the patients from whom the cells were isolated). These results highlight that our identified combinations may allow for more generalized cytotoxic effects against the malignant cells from patients with CTCL, regardless of their previous therapy. This outcome also suggests that the pathways targeted may be essential to the survival and malignant behavior of CTCL cells.
Taken together, our preclinical findings support the clinical implementation of ruxolitinib as a novel therapy for leukemic CTCL and further show the synergistic potential of combination of ruxolitinib with BCL2, HDAC, BET, or proteasome inhibition. These data also support the use of BCL2, HDAC, BET, or proteasome inhibition, alone and in combination with each other or with RXR, PARP, or DHFR inhibition. Based on our work herein and previous studies,12,13 we note the fundamental intersections of these targetable pathways (Figure 7) to further highlight promising combination drug approaches that warrant clinical assessment in the treatment of patients with advanced CTCL.
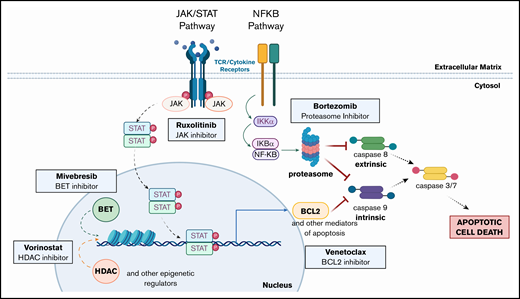
Altered pathways and their intersections within CTCL cells suggest multiple opportunities for single and combination therapeutic intervention. Mutations in the JAK/STAT pathway (JAK1, JAK2, JAK3, STAT3, and STAT5B) and the NF-κB pathway (NFKB2) have been previously described in CTCL. The pathways affected all ultimately inhibit both intrinsic and extrinsic apoptosis pathway activation. Inhibition of these pathways (eg, by the targeted agents assessed) overcomes resistance to apoptosis and drives malignant CTCL cell death. (Created with biorender.com.)
Altered pathways and their intersections within CTCL cells suggest multiple opportunities for single and combination therapeutic intervention. Mutations in the JAK/STAT pathway (JAK1, JAK2, JAK3, STAT3, and STAT5B) and the NF-κB pathway (NFKB2) have been previously described in CTCL. The pathways affected all ultimately inhibit both intrinsic and extrinsic apoptosis pathway activation. Inhibition of these pathways (eg, by the targeted agents assessed) overcomes resistance to apoptosis and drives malignant CTCL cell death. (Created with biorender.com.)
All data requests should be submitted to the corresponding author (Michael Girardi; e-mail: michael.girardi@yale.edu).
Acknowledgments
This work was supported by the R. S. Evans Foundation and the Cutaneous Lymphoma Foundation.
Authorship
Contribution: S.Y., F.N.M., J.M.L., and M.G. designed experiments, analyzed the data, prepared figures, and wrote the manuscript; S.Y., F.N.M., A.L.O.K., S.R.K., S.R.U., and Y.V.S. performed experiments; M.G., F.M.F., and K.R.C. provided patient samples; S.Y., F.N.M., J.M.L., and M.G. participated in discussions of the data; and all authors reviewed and edited the manuscript.
Conflict-of-interest disclosure: Yale School of Medicine has received clinical trial funding from AbbVie for an investigator-initiated (M.G.) clinical trial. The remaining authors declare no competing financial interests.
Correspondence: Michael Girardi, Department of Dermatology, Yale University School of Medicine, 333 Cedar St, PO Box 208059, New Haven, CT 06520-8059; e-mail: michael.girardi@yale.edu.

