

Key Points
The NIH joint/fascia score and total P-ROM score should be used for assessing therapeutic response in joint/fascia chronic GVHD.
A change from 0 to 1 on the NIH joint/fascia score should not be considered as worsening.

Abstract
Implementation of the 2014 National Institutes of Health (NIH) response algorithm for joint/fascia graft-versus-host disease (GVHD) has identified real-world limits to its application. To refine the 2014 NIH response algorithm, we analyzed multicenter prospective observational data from the Chronic GVHD Consortium. The training cohort included 209 patients and the replication cohort included 191 patients with joint/fascia involvement during their course of chronic GVHD. Linear mixed models with random patient effect were used to evaluate correlations between response categories and clinician- or patient-perceived changes in joint status as an anchor of response. Analysis of the training cohort showed that a 2-point change in total photographic range of motion (P-ROM) score was clinically meaningful. The results also suggested that a change from 0 to 1 on the NIH joint/fascia score should not be considered as worsening and suggested that both the NIH joint/fascia score and total P-ROM score, but not individual P-ROM scores, should be used for response assessment. On the basis of these results, we developed an evidence-based refined algorithm, the utility of which was examined in an independent replication cohort. Using the refined algorithm, ∼40% of responses were reclassified, largely mitigating most divergent responses among individual joints and changes from 0 to 1 on the NIH joint/fascia score. The refined algorithm showed robust point estimates and tighter 95% confidence intervals associated with clinician- or patient-perceived changes, compared with the 2014 NIH algorithm. The refined algorithm provides a superior, evidence-based method for measuring therapeutic response in joint/fascia chronic GVHD.
Introduction
Chronic graft-versus-host disease (GVHD) is a systemic immunological complication that occurs in approximately half of allogeneic hematopoietic cell transplantation survivors and is the leading cause of late morbidity and mortality.1 Joint/fascia involvement occurs in 3% to 24% of patients who have chronic GVHD.2-6 Joint/fascia manifestations include joint stiffness, arm or leg tightness, edema, restricted joint range of motion and arthralgia arising from inflammation, and fibrosis of superficial or deep tissues (subcutaneous sclerosis/fasciitis).7 Isolated deep involvement may occur while the overlying skin remains freely mobile.8
The development of National Institutes of Health (NIH) response criteria for chronic GVHD therapy through 2 consensus conferences9,10 led to the first regulatory approval of an agent for the treatment of this devastating complication.11 Currently, numerous new therapeutic targets and agents are being evaluated in prospective clinical trials, and further refinement of existing response scales is imperative for better drug development and benefit for patients.12 Therapeutic response in chronic GVHD with joint/fascia involvement needs to be assessed reliably, simply, and in a clinically meaningful way. The 2014 NIH response criteria paper defined joint/fascia improvement as a decrease in NIH joint/fascia score by at least 1 point or an increase in photographic range of motion (P-ROM) score by at least 1 point at any site, whereas progression was defined as an increase in NIH joint/fascia score by at least 1 point, including a change from 0 to 1, or decrease in P-ROM score by at least 1 point at any site10 ; however, evidence is lacking on the use of a single-site P-ROM score for assessing response. In fact, a prior study demonstrated the utility of a change of at least 1 point in total P-ROM score, derived from summing all joint scores.13
Several problems and contradictions have arisen in the implementation of the 2014 recommendation in clinical practice. First, divergent changes in individual joints (eg, improvement in 1 joint but worsening in another on individual P-ROM scores) are considered overall progression according to the 2014 NIH algorithm. The appropriateness of this recommendation had not been formally examined. Second, a worsening of ≥1 point on the 4-point NIH joint/fascia score (range, 0-3) is considered progression according to the 2014 NIH organ scoring algorithm, but a change from 0 to 1 is not considered progression in most other sites, because this often reflects mild, nonspecific, intermittent, self-limited symptoms or signs that do not warrant a change of therapy.10 This exception currently does not apply to the joint/fascia score based on consensus opinion,10 but evidence is not available to support this definition. Lastly, discrepant responses can occur between NIH joint/fascia score and P-ROM score (eg, NIH joint/fascia score worsens but P-ROM score improves), but there is no evidence-based guidance on adjudicating those cases as overall improvement, stability, or worsening.
We previously examined appropriate scales for assessing therapeutic response in joint/fascia GVHD and reported that the use of both NIH joint/fascia score and total P-ROM score appropriately captured changes in joint/fascia GVHD.13 Specifically, NIH joint/fascia score better captured improvement, whereas total P-ROM score better captured worsening.13 The present study extended our previous analysis to evaluate the performance of the 2014 NIH response algorithm for joint/fascia GVHD, using prospectively collected multicenter observational data of patients with chronic GVHD.14,15
Patients and methods
Study cohort
Adult patients who were at least 18 years of age with systemically treated chronic GVHD were enrolled for a prospective, multicenter, longitudinal, observational study by the Chronic GVHD Consortium.14,15 The consortium collected 2 independent cohorts of patients. The first cohort included 488 patients with 1578 visits who were enrolled from 2007 to 2012, and the second cohort included 357 patients with 1195 visits who were enrolled from 2013 to 2017. Patients with recurrent disease or anticipated survival <6 months were not enrolled. Diagnosis and assessment of chronic GVHD were made according to the 2005 NIH consensus criteria7 in the first cohort and according to the 2014 NIH consensus criteria in the second cohort.16 The 2014 NIH scoring form collected information regarding the attribution of joint/fascia abnormalities; 8 patients (2%) and 93 visits (7%) in the second cohort had joint/fascia abnormalities entirely explained by causes other than GVHD and were excluded from analyses. Among the 488 patients in the first cohort, 209 (43%) had joint/fascia involvement in at least 1 visit and thus comprised a training cohort. Among the 357 patients in the second cohort, 191 (54%) had joint/fascia involvement in at least 1 visit and thus comprised a replication cohort. At enrollment and every 6 months thereafter, clinicians and patients reported standardized information about chronic GVHD organ involvement and manifestations. Incident cases had an additional assessment at 3 months after enrollment. Patients were treated according to institutional practice in compliance with the NIH chronic GVHD consensus guidelines. The study protocol was approved by the institutional review board of each participating center, and all participants or their guardians provided written informed consent in accordance with the Declaration of Helsinki.
Statistical analysis
Joint/fascia involvement was defined as NIH joint/fascia score ≥1 at any study visit. At follow-up visits every 3 to 6 months, as an anchor of response, both clinician and patient separately rated their perception of change in joint/fascia manifestations on the following 8-point scale: 1, completely gone; 2, very much better; 3, moderately better; 4, a little better; 5, about the same; 6, a little worse; 7, moderately worse; and 8, very much worse. Clinicians and patients were asked about symptom changes in joints compared with previous visits in the training cohort and compared with enrollment visits in the replication cohort. Categorical perceptions of clinicians and patients were defined by the collapsed 8-point scale into the following categories: improved (1-3), stable (4-6), or worse (7-8). Longitudinal change scores for scales were calculated by subtracting previous visit values (training cohort) or enrollment values (replication cohort) from current values. Successive visits in the training cohort and enrollment and follow-up visits in the replication cohort were analyzed in pairs. The analysis was limited to paired visits where at least 1 NIH joint/fascia score was >0. To account for within-patient correlation, linear mixed models with random patient effect were used to evaluate correlations between response categories and clinician- or patient-perceived 0-to-8 changes in joint status. Linear mixed models were chosen because the models were not appreciably affected by missing data.17,18 Analysis was stratified by case type (incident [enrollment <3 months after chronic GVHD diagnosis] or prevalent [enrollment ≥3 months after chronic GVHD diagnosis but within 3 years after transplantation]). Clinically meaningful changes were defined by the distribution method (half a standard deviation) and anchor-based methods (changes in the measures that correlated with patient- or clinician-reported changes in joint/fascia involvement).10 Statistical analyses were performed using STATA (version 12.1; StataCorp, College Station, TX). Two-sided P < .05 was considered statistically significant.
Results
Patient characteristics
Patient characteristics at enrollment are listed in Table 1. The training and replication cohorts were balanced regarding sex, race, stem cell source, conditioning intensity, and organ involvement, except that skin, joint/fascia, lung, and genital manifestations were more frequent in the replication cohort. There were more incident cases in the training cohort compared with the replication cohort. NIH global severity scores were more severe in the replication cohort. P-ROM scores were slightly lower in the replication cohort. The values for half a standard deviation in individual P-ROM scores ranged from 0.29 to 0.70, confirming that a 1-point change in individual P-ROM score is clinically meaningful according to the distribution method. One half of a standard deviation in total P-ROM score was 1.17 in the training cohort and 1.49 in the replication cohort, indicating that a 2-point change in total P-ROM score is clinically meaningful.
Characteristics of patients who had joint/fascia involvement during their course of chronic GVHD
| Characteristic | Training | Replication | P |
|---|---|---|---|
| Total, n | 209 | 191 | |
| Time from HCT to enrollment, mo | <.001 | ||
| Median | 13.5 | 25.2 | |
| Range | 3.4-37.3 | 3.4-332 | |
| Case type | <.001 | ||
| Incident | 114 (55) | 59 (31) | |
| Prevalent | 95 (45) | 132 (69) | |
| Patient age at enrollment, y | .18 | ||
| Median | 52 | 55 | |
| Range | 19-79 | 19-77 | |
| Patient sex | .18 | ||
| Male | 119 (57) | 122 (64) | |
| Female | 90 (43) | 69 (36) | |
| Patient race | .91 | ||
| White | 189 (90) | 170 (89) | |
| Nonwhite | 17 (8) | 18 (9) | |
| Unknown | 3 (1) | 3 (2) | |
| Stem cell source | .14 | ||
| Bone marrow | 12 (6) | 8 (4) | |
| Mobilized blood cells | 185 (89) | 179 (94) | |
| Cord blood | 12 (6) | 4 (2) | |
| Female donor to male recipient | 57 (27) | 58 (30) | .48 |
| HLA and donor type | .06 | ||
| Matched related | 101 (48) | 70 (37) | |
| Matched unrelated | 85 (41) | 94 (49) | |
| Mismatched | 23 (11) | 27 (14) | |
| Conditioning regimen | .74 | ||
| Myeloablative | 106 (51) | 89 (47) | |
| Nonmyeloablative/reduced intensity | 101 (48) | 100 (52) | |
| Unknown | 2 (1) | 2 (1) | |
| Involved site at enrollment | |||
| Skin | 138 (66) | 157 (82) | <.001 |
| Eye | 108 (52) | 114 (60) | .11 |
| Mouth | 112 (54) | 106 (56) | .76 |
| Liver | 34 (16) | 18 (10) | .05 |
| Gastrointestinal tract | 63 (30) | 54 (28) | .74 |
| Joint/fascia | 113 (54) | 155 (81) | <.001 |
| Lung | 57 (27) | 76 (40) | .01 |
| Genital tract* | 20 (11) | 27 (24) | .005 |
| NIH global score at enrollment | <.001 | ||
| Mild | 23 (11) | 14 (7) | |
| Moderate | 131 (63) | 72 (38) | |
| Severe | 55 (26) | 105 (55) | |
| P-ROM score in all visits, mean ± SD (half SD) | |||
| Shoulder | 6.62 ± 0.74 (0.37) | 6.40 ± 0.89 (0.45) | <.001 |
| Elbow | 6.69 ± 0.72 (0.36) | 6.52 ± 0.83 (0.41) | <.001 |
| Wrist | 6.26 ± 1.17 (0.59) | 5.93 ± 1.39 (0.70) | <.001 |
| Ankle | 3.59 ± 0.57 (0.29) | 3.49 ± 0.69 (0.34) | .04 |
| Total score | 23.2 ± 2.34 (1.17) | 22.4 ± 2.97 (1.49) | <.001 |
Values are n (%) unless otherwise indicated.
SD, standard deviation.
Among patients for whom the question was answered (186 in training, 114 in replication).
Divergent response in individual P-ROM scores
Response based on P-ROM score is shown in Figure 1 for 455 paired visits in the training cohort where joint/fascia manifestations were documented in the previous or current visit. Worse individual P-ROM scores (ie, worse by ≥1 point) occurred in 15% to 21% of paired visits. When individual P-ROM scores were used for calculating overall response, as recommended by the 2014 NIH response criteria, 26% showed improvement (ie, improvement by ≥1 point in any joint without worsening in any other joints), 32% showed stability, and 43% showed worsening, because worsening in any joint (ie, worse by ≥1 point) is considered overall worsening, even in divergent cases where other joints are improved. Such divergent responses occurred in 56 (12%) of the 455 paired visits. Notably, few of these divergent cases were perceived as worse by clinicians or patients (5% and 10%, respectively; Table 2), and most of these cases were perceived as stable (68% and 57%, respectively; Table 2). According to total P-ROM score, most of these cases were classified as stable (Table 2). These results support the use of total P-ROM score for assessing response.

Response according to the P-ROM score at 455 paired visits in the training cohort.
Response according to the P-ROM score at 455 paired visits in the training cohort.
Overall assessment for 56 paired visits with divergent assessments between individual joints
| Measure | Improved, n (%) | Stable, n (%) | Worse, n (%) |
|---|---|---|---|
| Clinician perception | 15 (28) | 38 (68) | 3 (5) |
| Patient perception* | 14 (33) | 24 (57) | 4 (10) |
| Total P-ROM score | 5 (9) | 49 (88) | 2 (4) |
| Individual P-ROM score (2014 NIH) | 0 (0) | 0 (0) | 56 (100) |
| Measure | Improved, n (%) | Stable, n (%) | Worse, n (%) |
|---|---|---|---|
| Clinician perception | 15 (28) | 38 (68) | 3 (5) |
| Patient perception* | 14 (33) | 24 (57) | 4 (10) |
| Total P-ROM score | 5 (9) | 49 (88) | 2 (4) |
| Individual P-ROM score (2014 NIH) | 0 (0) | 0 (0) | 56 (100) |
Patient perception missing in 14 paired visits.
Clinician and patient perceptions in cases with a change from 0 to 1 in NIH joint/fascia score without worsening in total P-ROM score
Clinician and patient perceptions are summarized in Table 3 for 63 (14%) of the 455 paired visits in the training cohort where NIH joint/fascia score changed from 0 to 1 and total P-ROM score did not worsen. Very few clinicians and patients perceived worsening in those cases (3% and 8%, respectively), indicating that a change from 0 to 1 in NIH joint/fascia score should not be considered as worsening, as recommended for other sites in the 2014 NIH algorithm.
Overall assessment for 63 paired visits with change in NIH joint/fascia score from 0 to 1 without worsening in total P-ROM score
| Measure | Improved, n (%) | Stable, n (%) | Worse, n (%) |
|---|---|---|---|
| Clinician perception | 32 (51) | 29 (46) | 2 (3) |
| Patient perception* | 18 (34) | 31 (58) | 4 (8) |
| Measure | Improved, n (%) | Stable, n (%) | Worse, n (%) |
|---|---|---|---|
| Clinician perception | 32 (51) | 29 (46) | 2 (3) |
| Patient perception* | 18 (34) | 31 (58) | 4 (8) |
Patient perception missing in 10 paired visits.
Divergent response between NIH joint/fascia score and total P-ROM score
Agreement in response in the training cohort between NIH joint/fascia score and total P-ROM score is summarized in Table 4. Only 13 (2.9%) of the 455 paired visits in the training cohort showed divergent response between NIH joint/fascia score and total P-ROM score; the response category was improved by total P-ROM score but worse by NIH joint/fascia score in 4 paired visits, and the response category was worse by total P-ROM score but improved by NIH joint/fascia score in 9 paired visits. These 13 paired visits were perceived most frequently as stable (54%) or improved (38%) by clinicians but as stable (44%) or worse (33%) by patients. These results indicate that overall response cannot be determined in these rare divergent cases.
Agreement in response between NIH joint/fascia score and total P-ROM score
| Total P-ROM score | NIH joint/fascia score | ||
|---|---|---|---|
| Improve | Stable | Worse (except for 0-1) | |
| Improved | 32 | 27 | 4* |
| Stable | 96 | 199 | 17 |
| Worse | 9* | 53 | 18 |
| Total P-ROM score | NIH joint/fascia score | ||
|---|---|---|---|
| Improve | Stable | Worse (except for 0-1) | |
| Improved | 32 | 27 | 4* |
| Stable | 96 | 199 | 17 |
| Worse | 9* | 53 | 18 |
Divergent response.
Development of a refined response algorithm for joint/fascia GVHD and assessment of its performance in a replication cohort
On the basis of the analysis of results in the training cohort, we developed an evidence-based, refined response algorithm for joint/fascia GVHD (Figure 2). The refined algorithm incorporates changes in both NIH joint/fascia score and total P-ROM score for definition of response. At least 1-point changes, except for a change from 0 to 1 in NIH joint/fascia score and at least 2-point changes in total P-ROM score, are defined as clinically meaningful changes. Divergent changes between NIH joint/fascia score and total P-ROM score are considered uninterpretable.

The proportion of paired visits with worsening of joint/fascia GVHD was ∼50% according to the 2014 NIH algorithm, but this decreased to <20% according to the refined algorithm in both training and replication cohorts (Figure 3). Response was uninterpretable when divergent changes between NIH joint/fascia score and total P-ROM score occurred in a few paired visits. Agreement in response between the 2014 NIH algorithm and the refined algorithm is summarized in Table 5. Reclassification occurred in 184 (40%) of 455 paired visits in the training cohort and in 152 (35%) of 429 paired visits in the replication cohort. As expected, the refined algorithm reclassified some improved cases as stable and many worsened cases as improved or stable. This observation held true in the independent replication cohort.
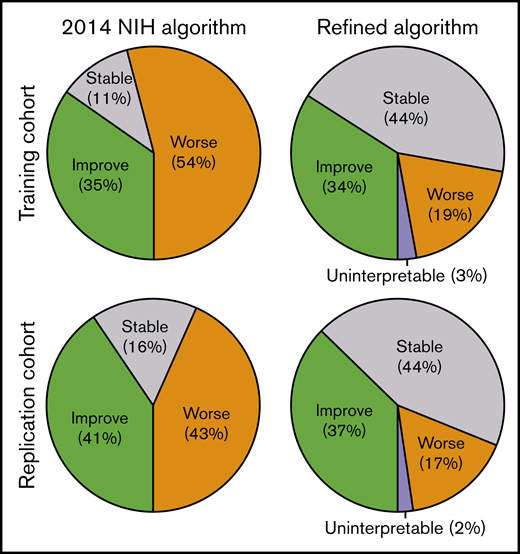
Response categories according to 2014 NIH algorithm and refined algorithm for chronic GVHD in joints and fascia.
Response categories according to 2014 NIH algorithm and refined algorithm for chronic GVHD in joints and fascia.
Agreement in response between 2014 NIH algorithm and refined algorithm
| 2014 NIH algorithm | Refined algorithm | |||
|---|---|---|---|---|
| Improved | Stable | Worse | Uninterpretable | |
| Training cohort | ||||
| Improved | 132 | 26* | 0 | 0 |
| Stable | 0 | 51 | 0 | 0 |
| Worse | 23* | 122* | 88 | 13*† |
| Replication cohort | ||||
| Improved | 137 | 37* | 0 | 0 |
| Stable | 0 | 69 | 0 | 0 |
| Worse | 23* | 82* | 71 | 10*† |
Reclassification occurred in 184 paired visits (40%) in the training cohort and in 152 paired visits (35%) in the replication cohort.
Uninterpretable because of divergent response between NIH joint/fascia score and total P-ROM score.
Estimated differences in clinician- and patient-perceived 0-to-8 changes in joint/fascia manifestations were compared between the 2014 NIH algorithm and the refined algorithm (Figure 4). Separate analysis in incident and prevalent cases showed similar results in both case types. The major problem with the 2014 algorithm was classification of cases perceived as stable by clinicians as worsening. The refined algorithm corrected most of these misclassifications, resulting in the worse vs stable groups moving appropriately to the right (indicating worsening) for clinician perception. Patient perception in the training cohort did not change appreciably between the worse vs stable groups with either algorithm, and the refined algorithm showed worsened patient perception in prevalent cases of the replication cohort. Overall, changes in perception by both clinicians and patients with the refined algorithm were larger than those with the 2014 NIH algorithm, indicating better concordance with reported clinically meaningful perceptions.
![Estimated differences in clinician- and patient-perceived changes in joint/fascia manifestations according to response categories defined by 2014 NIH algorithm and refined algorithm. Estimated differences in clinician- or patient-perceived 0-to-8 changes were calculated using linear mixed models with random patient effect in the respective comparisons. For example, estimated difference among improved patients according to the 2014 NIH algorithm compared with stable patients according to the same algorithm is shown in top left. Analysis was stratified by case type (incident [red; enrollment <3 months after chronic GVHD diagnosis] or prevalent [blue; enrollment ≥3 months after chronic GVHD diagnosis but within 3 years after transplantation]). Squares and diamonds indicate point estimates, and bars indicate 95% confidence intervals.](https://ash.silverchair-cdn.com/ash/content_public/journal/bloodadvances/4/1/10.1182_bloodadvances.2019000918/3/m_advancesadv2019000918f4.png?Expires=1765911974&Signature=dxshUk34w75mwEpVqSkzbf4ofOCbSOgimuF5HXeZZMxvTTwkYoScPSbCVIpZrue3DBA3zbTel8JZq2wVRRhsVnV2lervBbJ5gJKU1aBOFXSCebHsovXciokAKf6A3UXhLrMvXhFVmi2fhEk4vkjUsgEUdT24KlHovlPgKHgEtH1fsYb~DIo0FB56VFd4JDluZVojxgTKKeuqEEKdypltvWKvx0D5z2XxsVDc4EKlkzRp~FIjhkUqSEIDFDgYv56TqXNOlMDpt5xim8zrGcWkqrGhyEw-0cADS0t-mF~KXY6JSzAv5045N90wAl7Ax2ZFjaw1h6vxMS~6HzcIhlEqgw__&Key-Pair-Id=APKAIE5G5CRDK6RD3PGA)
Estimated differences in clinician- and patient-perceived changes in joint/fascia manifestations according to response categories defined by 2014 NIH algorithm and refined algorithm. Estimated differences in clinician- or patient-perceived 0-to-8 changes were calculated using linear mixed models with random patient effect in the respective comparisons. For example, estimated difference among improved patients according to the 2014 NIH algorithm compared with stable patients according to the same algorithm is shown in top left. Analysis was stratified by case type (incident [red; enrollment <3 months after chronic GVHD diagnosis] or prevalent [blue; enrollment ≥3 months after chronic GVHD diagnosis but within 3 years after transplantation]). Squares and diamonds indicate point estimates, and bars indicate 95% confidence intervals.
Estimated differences in clinician- and patient-perceived changes in joint/fascia manifestations according to response categories defined by 2014 NIH algorithm and refined algorithm. Estimated differences in clinician- or patient-perceived 0-to-8 changes were calculated using linear mixed models with random patient effect in the respective comparisons. For example, estimated difference among improved patients according to the 2014 NIH algorithm compared with stable patients according to the same algorithm is shown in top left. Analysis was stratified by case type (incident [red; enrollment <3 months after chronic GVHD diagnosis] or prevalent [blue; enrollment ≥3 months after chronic GVHD diagnosis but within 3 years after transplantation]). Squares and diamonds indicate point estimates, and bars indicate 95% confidence intervals.
Discussion
This study solves many contradictions and problems related to the 2014 NIH response algorithm for assessment of joint/fascia changes that was recommended based on expert opinion.10 First, we confirmed that a 1-point change in individual P-ROM score and 2-point change in total P-ROM score are clinically meaningful based on prospectively collected multicenter data of patients with chronic GVHD. Second, a change from 0 to 1 in NIH joint/fascia score should not be considered worse, because only a few clinicians and patients perceived worsening of GVHD in joints and fascia in real-world experience. This rule is identical to the approach recommended for other sites in the 2014 NIH response criteria.10 Third, total P-ROM score offers a better approach than individual P-ROM scores for categorizing divergent responses in individual joints, which occurred in >10% of paired visits. Lastly, our real-world evidence data support defining overall response as uninterpretable when rare divergent responses remain between NIH joint/fascia score and total P-ROM score despite application of the refined algorithm.
The proportion of paired visits with worse joint/fascia GVHD was ∼30% lower in both the training and replication cohorts according to the refined algorithm compared with the 2014 NIH algorithm. Reclassification of response categories occurred in both directions, with some improved cases changed to stable and many worsened cases reclassified as stable or even improved. The refined algorithm led to overall better delineation of clinician- or patient-perceived changes compared with the 2014 NIH algorithm, as shown in Figure 4. The point estimates for many of the change categories are overall stepwise farther away from 0 in the minus (improved) direction and plus (worsening) direction, with tight confidence intervals. The 2014 NIH algorithm performed poorly in capturing differences between the worse and stable groups in either the training or replication cohort. In contrast, the refined algorithm captured differences between the worse and stable groups in clinician perception in both cohorts, as well as in patient perception in the replication cohort but not in the training cohort.
The current NIH response criteria tools for assessing joint/fascia GVHD have several other issues that will require future refinement and investigation. First, ROM is sometimes not symmetrical, and the NIH criteria do not state whether the better or worse joint should be scored. One solution might be to score left and right joints separately, but this modification would need validation. Second, patient joint positioning for P-ROM assessment should be standardized, and images should be collected for archived documentation when response assessment is essential, as for clinical trials. Third, P-ROM does not capture fascial involvement in the abdomen or chest wall, which can significantly affect physical functioning. Lung function values such as FEV1 and vital capacity percentages may reflect mobility of the chest wall, although formal validation has not been performed. Fourth, data in the pediatric population are limited. Finally, guidance is required when edema that could mimic early fasciitis or worsening sclerosis is present. Gentle pressure on the area can sometimes expel edema, allowing more accurate assessment of skin thickening from fibrosis. More refined tools and better technologies are required to solve these challenges.
In conclusion, this study provides a substantially improved algorithm for assessing therapeutic response in chronic GVHD involving joints and fascia based on empirical data from 2 independent prospective multicenter cohorts. This evidence-based refined algorithm for joint/fascia GVHD is appropriate for use in clinical trials. Because both the 2014 and the refined response algorithms use the same input data, clinical trials in progress will be able to evaluate outcomes according to both algorithms.
Acknowledgments
This study was supported by grants from the Japan Society for the Promotion of Science (18K08345) and the National Cancer Institute, National Institutes of Health (CA118953).
Authorship
Contribution: Y.I., S.J.L., and P.A.C. designed the study, collected and analyzed data, and wrote the paper; Y.I. and L.E.O. performed statistical analyses; M.E.D.F., B.K.H., M.H.J., P.J.M., S.Z.P., J.A.P., I.P., G.B.V., and D.W. collected data and wrote the report; and all authors critically revised the manuscript for important intellectual content and approved the final manuscript.
Conflict-of-interest disclosure: The authors declare no competing financial interests.
Correspondence: Yoshihiro Inamoto, National Cancer Center Hospital, 5-1-1 Tsukiji, Chuo, Tokyo 104-0045, Japan; e-mail: yinamoto@ncc.go.jp.

