

Key Points
Pre-HCT exposure to ATG may have an antirelapse effect, whereas post-HCT exposure may have a prorelapse effect.
Pre-HCT exposure may have a proengraftment effect; high post-HCT exposure is associated with less GVHD and more fatal infections.

Abstract
It remains unknown why rabbit antithymocyte globulin (ATG; Thymoglobulin) has not affected relapse after hematopoietic cell transplantation (HCT) in randomized studies. We hypothesized that high pre-HCT ATG area under the curve (AUC) would be associated with a low incidence of relapse, whereas high post-HCT AUC would be associated with a high incidence of relapse. We measured serum levels of ATG capable of binding to mononuclear cells (MNCs), lymphocytes, T cells, CD4 T cells, or CD33 cells. We estimated pre- and post-HCT AUCs in 152 adult recipients of myeloablative conditioning and blood stem cells. High pre-HCT AUCs of MNC- and CD33 cell–binding ATG were associated with a low incidence of relapse and high relapse-free survival (RFS). There was a trend toward an association of high post-HCT AUC of lymphocyte-binding ATG with a high incidence of relapse and low RFS. High pre-HCT AUCs were also associated with faster engraftment and had no impact on graft-versus-host disease (GVHD) or fatal infections. High post-HCT AUCs were associated with a low risk of GVHD, seemed associated with an increased risk of fatal infections, and had no impact on engraftment. In conclusion, pre-HCT AUC seems to have a positive, whereas post-HCT AUC seems to have a negative, impact on relapse.
Introduction
The 2 most important problems of allogeneic hematopoietic cell transplantation (HCT) are relapse of leukemia and graft-versus-host disease (GVHD). GVHD incidence can be minimized by depleting grafts of T cells or inhibiting T cells after transplantation with small-molecule drugs like cyclosporine. Unfortunately, this may increase the incidence of relapse,1-9 probably because the ex vivo T-cell depletion or in vivo T-cell inhibition interferes with graft-versus-leukemia (GVL) effect. Rabbit antithymocyte globulin (ATG; Thymoglobulin) has been shown in 3 randomized trials to reduce the incidence of GVHD without increasing the incidence of relapse.10-12 A potential reason for the nonincrease in relapse is that ATG, despite being expected to impair GVL, has a direct antileukemic effect.13-18
Admiraal et al19 suggested that a high posttransplantation ATG area under the curve (AUC; an index of ATG exposure) leads to a high incidence of relapse. We hypothesized that a high pretransplantation AUC would lead to the opposite (a low incidence of relapse), given the direct antileukemic effect of ATG13,14 and its overall neutral effect on relapse.10-12 Here we evaluated this hypothesis. We also studied associations between pre- and posttransplantation AUCs and outcomes other than relapse, because this could shed light on ideal ATG administration timing and dosing.
Methods
Patients, transplantation, and outcomes
Between 24 February 2011 and 15 December 2017, 390 patients underwent first allogeneic HCT for hematologic malignancy in Calgary, AB, Canada, using our typical myeloablative conditioning, graft type, and GVHD prophylaxis combination (fludarabine plus busulfan plus total-body irradiation plus filgrastim-mobilized blood stem cells plus methotrexate plus cyclosporine).20 Of these, 152 patients agreed to participate in our study, and their sera from the following time points were available: immediately before starting graft infusion (pregraft), 30 minutes after finishing graft infusion (postgraft), day 7, and day 28. Follow-up for all patients was until 31 July 2018. The study was approved by the Health Research Ethics Board of Alberta, and written consent was obtained. Patient characteristics are listed in Table 1.
Patient characteristics
| Characteristic | N (%) |
|---|---|
| No. of patients | 152 |
| Patient age, y | |
| Median | 53 |
| Range | 18-71 |
| Patient sex | |
| Male | 89 |
| Female | 63 |
| Donor age, y | |
| Median | 31 |
| Range | 16-68 |
| Donor sex | |
| Male | 101 |
| Female | 51 |
| End of follow-up for all patients, d | |
| Median | 708 |
| Range | 53-2554 |
| End of follow-up for surviving patients, d | |
| Median | 1077 |
| Range | 89-2554 |
| Underlying disease | |
| AML | 78 (51.6) |
| ALL | 24 (15.6) |
| Other acute leukemia | 2 (1.3) |
| MDS | 14 (9.1) |
| CML/CMML | 7 (4.5) |
| MF | 4 (2.6) |
| MPN | 1 (0.6) |
| CLL/lymphoma | 19 (12.4) |
| Other hematological malignancy | 3 (1.9) |
| Disease risk* | |
| Good | 79 (52.2) |
| Poor | 73 (47.7) |
| Donor type† | |
| HLA-matched sibling | 55 (35.9) |
| 7-8/8 HLA-matched unrelated | 97 (63.9) |
| CMV serostatus, recipient/donor | |
| Positive/negative‡ | 20 (13.7) |
| All other | 131 (85.6) |
| Unknown | 1 (0.6) |
| No. of patients developing relapse | 30 (19.7) |
| No. of patients developing aGVHD, grade | |
| 2-4 | 39 (25.6) |
| 3-4 | 7 (4.6) |
| No. of patients developing cGVHD | |
| Moderate to severe | 19 (12.5) |
aGVHD, acute GVHD; ALL, acute lymphoblastic leukemia; AML, acute myeloid leukemia; cGVHD, chronic GVHD; CLL, chronic lymphocytic leukemia; CML, chronic myeloid leukemia; CMML, chronic myelomonocytic leukemia; CMV, cytomegalovirus; MDS, myelodysplastic syndrome; MF, myelofibrosis; MPN, myeloproliferative neoplasms.
Good risk was defined as acute leukemia (AML, ALL, biphenotypic) in first remission, CML in first chronic or accelerated phase, myelodysplasia with <5% blasts in the marrow, or aplastic anemia. All other diseases/disease stages were considered poor risk.
Of the 97 donors, 30 were 7/8 HLA-matched unrelated donors, and 66 were 8/8 matched unrelated donors. This group also contains 1 7/8 HLA-matched related donor.
Poor-prognosis group.24
Conditioning was with fludarabine (50 mg/m2 daily from day −6 to −2), busulfan (∼3.2 mg/kg daily from day −5 to −2, pharmacokinetically [PK] adjusted to target AUC of 15 000 μmol × minute),21,22 and total-body irradiation (2 fractions of 2 Gy each on day −1). For GVHD prophylaxis, patients received ATG (0.5 mg/kg on day −2, 2 mg/kg on day −1, and 2 mg/kg on day 0 before graft infusion), methotrexate (15 mg/m2 on day +1 and 10 mg/m2 on days +3, +6, and +11), and cyclosporine (from day −1 to +56, targeting trough plasma levels of 200-400 mg/L and then tapering until day +84).
Supportive care included ursodiol until 3 months, fluconazole until 1 month, sulfamethoxazole-trimethoprim from engraftment until 6 months, and valacyclovir until 2 years after HCT.23 Cytomegalovirus DNAemia was monitored, and valganciclovir or ganciclovir was administered preemptively (when cytomegalovirus >25 000 IU/mL plasma).24 Epstein-Barr virus DNAemia was monitored, and rituximab was administered therapeutically or preemptively (when Epstein-Barr virus >300 000 IU/mL blood).25,26
aGVHD was graded according to the 1994 consensus criteria,27 and cGVHD was diagnosed and scored according to the National Institutes of Health criteria.28 Unless otherwise stated, here aGVHD refers to grade 2 to 4 aGVHD, and cGVHD refers to moderate to severe cGVHD. Significant GVHD refers to grade 2 to 4 aGVHD or moderate to severe cGVHD. Significant GVHD was treated with corticosteroids with or without other immunosuppressive drugs. Relapse was defined using standard criteria (eg, >5% marrow blasts in the case of acute leukemia). Fatal infection was defined as autopsy findings consistent with an infection and detection of the pathogen in an autopsy specimen or death after a definite infection29 judged to have caused the death either directly (eg, pneumonia) or indirectly (eg, sepsis with subsequent adult respiratory distress syndrome). Fatal infections occurring after significant GVHD, relapse, graft failure (GF), or second malignancy (except for posttransplantation lymphoproliferative disorder, nonmelanoma skin cancer, and carcinoma in situ) were discounted. Chronic GVHD- and relapse-free survival (cGRFS) was defined as survival free of relapse and moderate to severe cGVHD. Day of neutrophil engraftment was defined as the first of 3 consecutive days on which absolute neutrophil count was at least 0.5 × 10⁹/L. Day of platelet engraftment was defined as the first of 3 consecutive days on which platelet count was at least 20 × 109/L, with no platelet transfusion in the last 7 days.
Measurement of ATG levels
Blood was collected from patients at the following time points: the end of the last ATG infusion (maximum serum concentration [Cmax]); immediately pregraft infusion (pregraft); 30 minutes after the end of graft infusion, by when equilibrium between free serum ATG and ATG bound to infused cells has probably been established (postgraft)30 ; and on days 7 and 28. Serum was separated from the blood and stored in tightly sealed vials at −80°C until ATG level determination.
Level (concentration) of functional ATG (capable of binding to an immune cell subset) was determined using a flow cytometry–based assay similar to those of Hoegh-Petersen et al31 and Jamani et al,30 improved as described in the supplemental material (supplemental Figures 1 and 2; supplemental Tables 1 and 2). Levels of the following ATG fractions (specificities) were determined: capable of binding to mononuclear cells (MNCs; MNC-binding ATG), capable of binding to lymphocytes (lymphocyte-binding ATG), capable of binding to T cells (T cell–binding ATG), capable of binding to CD4 T cells (CD4 T cell–binding ATG), and capable of binding to CD33+ cells (CD33 cell–binding ATG). The reason for measuring CD33 cell–binding ATG was our hypothesis that high pre-HCT AUC of this fraction is associated with a low incidence of relapse of myeloid malignancies. The reason for measuring T cell–binding and particularly CD4 T cell–binding ATG was our hypothesis that high post-HCT AUCs of these fractions are associated with a low incidence of GVHD31 and a high incidence of relapse, because GVHD may be a surrogate for GVL effect.32 The levels were quantified in units of equivalence (UE). One UE of an ATG fraction (capable of binding to a cell subset) is the amount of ATG capable of binding to the cell subset contained in 1 mg of total ATG.
Levels at the end of the last ATG infusion (Cmax) were estimated, because the sera were available for only 76 of the 152 patients (whereas pregraft, postgraft, day-7, and day-28 specimens were available for all 152 patients). The Cmax for each patient was extrapolated from the median population log/linear distribution phase slope of Cmax to graft infusion start time. The median time from Cmax to graft infusion start was 2.84 hours (range, 0.13-7.48 hours). The validity of the estimation was assessed using the Spearman correlation between the estimated Cmax vs the true (observed) Cmax in the 76 patients. The correlation coefficient (r) was 0.656 for MNC-binding ATG, 0.553 for lymphocyte-binding ATG, 0.610 for T cell–binding ATG, 0.650 for CD4 T cell–binding ATG, and 0.566 for CD33 cell–binding ATG (supplemental Figure 3). We considered r > 0.50 acceptable.
Pre- and post-HCT AUC calculation
Pre- and post-HCT AUCs were calculated by the trapezoidal rule,33 linear up, logarithmic down (given that after initial distribution, ATG seems to be eliminated by first-order kinetics34-37 ; supplemental Figure 4).
Pre-HCT AUC (hereafter pre-AUC) was calculated as the sum of the corrected area of the triangle from the start of the first ATG infusion to the end of the third ATG infusion (corrected AUCATG#1start-ATG#3end) and the area of the trapezoid from the end of the third ATG infusion to the start of the graft infusion (calculated by the logarithmic trapezoidal method). Because the triangle from the start of the first ATG infusion to the end of the third ATG infusion would be a crude estimate of the AUCATG#1start-ATG#3end (crude AUCATG#1start-ATG#3end), in 10 patients, we also determined the true AUCATG#1start-ATG#3end, derived from ATG levels measured before and after each of the 3 ATG infusions. The goal was to generate a correction factor used for the calculation of the corrected AUCATG#1start ATG#3end. The true AUCATG#1start-ATG#3end was calculated as the sum of the areas of the triangle from the start to the end of the first ATG infusion, the trapezoid from the end of the first ATG infusion to the start of the second ATG infusion, the trapezoid from the start to the end of the second ATG infusion, the trapezoid from the end of the second ATG infusion to the start of the third ATG infusion, and the trapezoid from the start to the end of the third ATG infusion. The median ratio of the true AUCATG#1start-ATG#3end/the crude AUCATG#1start-ATG#3end (correction factor) was 0.781 for MNC-binding ATG, 0.787 for lymphocyte-binding ATG, 0.780 for T cell–binding ATG, 0.756 for CD4 T cell–binding ATG, and 1.206 for CD33 cell–binding ATG. The corrected AUCATG#1start-ATG#3end for all 152 patients was calculated as the crude AUCATG#1start-ATG#3end multiplied by the correction factor.
Post-HCT AUC (hereafter post-AUC) was calculated as the sum of the areas of the trapezoids from pregraft to postgraft, from postgraft to day 7, and from day 7 to day 28 and the area of the tail (the triangle from day 28 to infinity). For patients with day-28 ATG levels lower than the limit of quantitation, the area of the tail was arbitrarily 0.
Statistics
The likelihood of binary outcome between patients with high (higher than median) vs low (lower than or equal to median) ATG levels/AUCs was analyzed using time-to-event (survival) analysis. Specifically, competing-risk regression (according to Fine and Gray) was used for the cumulative incidence of relapse, aGVHD, and cGVHD. Cox regression was used for overall survival (OS), relapse-free survival (RFS), and cGRFS. Covariates and competing risks used in these analyses are shown in supplemental Table 3. In case of Cox regression, the assumption of proportionality was tested using the visual inspection of log-log survival curves, the visual inspection of Kaplan-Meier and predicted survival curves, the Schoenfeld residuals, and time-varying covariates (determining the time-varying effect of the same covariates as in the base model). In case of competing-risk regression, the assumption of proportionality was tested using the time-varying covariates. The assumption was not violated in any 1 of the presented results. We used STATA IC software (version 15.1; StataCorp, College Station, TX).
The analyses of the association between the levels/AUCs of ATG capable of binding to CD33+ cells and relapse were restricted only to patients with acute myeloid leukemia, myelodysplastic syndrome, chronic myeloid leukemia, and chronic myelomonocytic leukemia (ie, myeloid malignancies typically expressing CD33; n = 99).
Results
ATG levels and AUCs
The median levels of MNC-binding ATG were 15.2 UE/L at the end of the last ATG infusion (Cmax), 11.3 UE/L pregraft, 9.8 UE/L postgraft, 1.6 UE/L on day 7, and 0.15 UE/L on day 28 (supplemental Figure 5). The medians and ranges for the levels and AUCs of all ATG fractions measured are listed in supplemental Table 4. There was a correlation between pre- and post-AUC; however, the correlation was weak (r < 0.55; supplemental Table 5). This, together with the fact that the patients were treated quite uniformly, allowed us to evaluate whether pre-AUC is associated with different outcomes than post-AUC.
Relapse
Pre-AUCs of MNC-binding and CD33 cell–binding ATG were associated with relapse. Patients with high (higher than median) pre-AUC of MNC-binding ATG had a lower cumulative incidence of relapse (CIR) than patients with low AUC (subhazard ratio [SHR], 0.436; P = .032; analyzed using multivariate analysis in all 152 patients). Likewise, patients with high pre-AUC of CD33 cell–binding ATG had a lower CIR than patients with low AUC (SHR, 0.300; P = .010; analyzed in 99 patients with acute myeloid leukemia, myelodysplastic syndrome, chronic myeloid leukemia, or chronic myelomonocytic leukemia; Table 2; supplemental Table 6; Figure 1).
Associations between high pre- or post-HCT ATG AUC and outcomes
| Outcome | Pre-HCT AUC | Post-HCT AUC | ||||||||
|---|---|---|---|---|---|---|---|---|---|---|
| MNCs | Lymphocytes | T cells | CD4 T cells | CD33 cells* | MNCs | Lymphocytes | T cells | CD4 T cells | CD33 cells* | |
| Relapse | ↓ | ↓ | ⇡ | ⇡ | ⇡ | |||||
| aGVHD (grade 2-4) | ⇣ | ↓↓ | ↓↓↓ | ↓↓ | ↓↓ | |||||
| cGVHD (moderate to severe; NST) | ↓ | ↓ | ↓ | |||||||
| OS | ⇡ | ⇣ | ||||||||
| RFS | ↑ | ⇣ | ||||||||
| cGRFS | ⇡ | ⇡ | ||||||||
Multivariate analysis was performed to determine the significance of the association between high (higher than median) pre- or post-HCT ATG AUC and each outcome. Only significant associations (P < .05) and trends toward significant associations (P = .05 to .15) are shown. ↑ or ↓ denotes that high AUC was associated with high or low risk of the outcome, with P value from .01 to <.05, ↑↑ or ↓↓ with P value from .001 to <.01, ↑↑↑ or ↓↓↓ with P value <.001, ⇡ or ⇣ with P value from .05 to .15.
NST, needing systemic therapy.
The association between AUC of ATG capable of binding to CD33 cells and relapse was determined in patients with acute myeloid leukemia/myelodysplastic syndrome/chronic myeloid leukemia/chronic myelomonocytic leukemia. For other outcomes, the association was determined in all patients (with any malignancy).

CIR in patients with low (below median) vs high pre-HCT AUC of ATG capable of binding to CD33+cells (top) or MNCs (bottom).
CIR in patients with low (below median) vs high pre-HCT AUC of ATG capable of binding to CD33+cells (top) or MNCs (bottom).
Post-AUCs of all ATG fractions were not significantly associated with relapse. However, there was a trend toward higher CIR in patients with high compared with low post-AUC of ATG capable of binding to lymphocytes (SHR, 1.957; P = .068), T cells (SHR, 1.843; P = .108), and CD4 T cells (SHR, 1.879; P = .092; Table 2; supplemental Table 6; Figure 2).
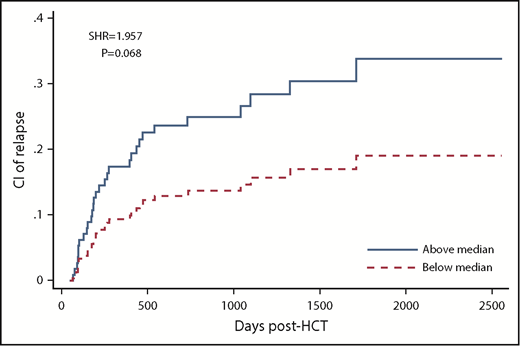
CIR in patients with low (below median) vs high post-HCT AUC of ATG capable of binding to lymphocytes.
CIR in patients with low (below median) vs high post-HCT AUC of ATG capable of binding to lymphocytes.
Analogous to the association between high pre-AUC and low CIR, there were significant associations between high Cmax and pregraft levels of CD33-cell binding ATG and low CIR (Cmax: SHR, 0.381; P = .025; pregraft: SHR, 0.429; P = .049; supplemental Figure 6). For MNC-binding ATG, the associations trended in the same direction but were not significant (Cmax: SHR, 0.617; P = .226; pregraft: SHR, 0.572; P = .191; supplemental Table 7).
Analogous to post-AUC, there were no significant associations between postgraft, day-7, or day-28 levels of any ATG fraction and relapse. However, there was a trend toward high day-7 or day-28 levels of some ATG fractions and high CIR (supplemental Table 8).
Acute GVHD
High post-AUCs of ATG capable of binding to MNCs, lymphocytes, T cells, and CD4 T cells were associated with significantly lower likelihoods of aGVHD (Table 2; supplemental Table 6; Figure 3).

CI of aGVHD (grade 2-4) in patients with low (below median) vs high post-HCT AUC of ATG capable of binding to lymphocytes, T cells, CD4 T cells, or MNCs.
CI of aGVHD (grade 2-4) in patients with low (below median) vs high post-HCT AUC of ATG capable of binding to lymphocytes, T cells, CD4 T cells, or MNCs.
In contrast, there was no significant association between pre-AUC and aGVHD (Table 2; supplemental Table 6). The trend toward the association between high MNC-binding ATG and low incidence of aGVHD (SHR, 0.626; P = .148) in Table 2 and supplemental Table 6 is a result of a correlation between pre-AUC and post-AUC. The trend disappeared when both pre-AUC and post-AUC were included as variables in the competing-risk regression (SHR, 0.858; P = .651).
There was no significant association of Cmax with aGVHD (supplemental Table 7). There were significant associations of pregraft, postgraft, day-7, and day-28 levels with aGVHD (supplemental Table 8). Interestingly, in the posttransplantation period, the association between the levels and aGVHD was stronger for postgraft and day-7 levels than for day-28 levels (supplemental Table 8).
The association between high post-AUC and low incidence of aGVHD may be due to the low ATG levels per se, which could be improved by a higher pre-HCT dose or an additional post-HCT dose, or due to rapid post-HCT ATG clearance, which could be a surrogate of proliferation of alloreactive T cells and might not be amenable to a change in ATG dosing. To evaluate the latter, we determined whether there was an association between the relative drop in ATG levels from postgraft to day 7 (postgraft level divided by day-7 level) and aGVHD. We chose the first week post-HCT, because the substantial proliferation of alloreactive T cells in patients destined to develop GVHD is expected in the first week, based on animal models of aGVHD.38,39 We evaluated this for the lymphocyte-binding ATG fraction, because post-AUC of that fraction was most strongly associated with aGVHD (supplemental Table 6). A high (higher than median) drop was associated with a high incidence of aGVHD (SHR, 2.392; P = .010). To determine whether the postgraft ATG level and the drop were associated with aGVHD independent of each other, we included both as variables in the multivariate competing-risk regression. High drop was significantly associated with high incidence of aGVHD (SHR, 2.066; P = .040), whereas only a trend was observed for the association between high postgraft level and low incidence of grade 2 to 4 aGVHD (SHR, 0.609; P = .162). This suggests that the rapid post-HCT ATG clearance (possibly due to alloreactive cell proliferation) could be a more important factor than the postgraft level in the association between high post-AUC and low aGVHD incidence.
Chronic GVHD
High post-AUC of MNC-binding ATG, lymphocyte-binding ATG, and CD33 cell–binding ATG was significantly associated with low incidence of moderate to severe cGVHD in multivariate analysis (Table 2; supplemental Table 6; Figure 4). In contrast, there was no such association for pre-AUC.

CI of cGVHD (moderate to severe) in patients with low (below median) vs high post-HCT AUC of ATG capable of binding to MNCs, lymphocytes, or CD33 cells.
CI of cGVHD (moderate to severe) in patients with low (below median) vs high post-HCT AUC of ATG capable of binding to MNCs, lymphocytes, or CD33 cells.
As expected, Cmax and pregraft levels mirrored pre-AUC (Table 2; supplemental Table 7). Postgraft and day-7 levels, but not day-28 levels, mirrored post-AUC (Table 2; supplemental Table 8).
There was no significant association between the relative drop of MNC-binding ATG from postgraft to day 7 and the incidence of cGVHD. Analyzing the drop from postgraft to day 28 or from day 7 to day 28 would be meaningless, because day-28 levels were typically very low (near the quantitation limit). Therefore, the drop from postgraft to day 28 would virtually equal the postgraft level, and the drop from day 7 to day 28 would virtually equal the day-7 level.
Fatal infection
Only 6 patients died as a result of an infection not related to GVHD or relapse (supplemental Table 9). This number was too small for a meaningful Fine-Gray multivariate analysis. Instead, we compared AUCs in patients who did vs did not die as a result of an infection, using the univariate Mann-Whitney U test. Post-AUC, but not pre-AUC, was significantly higher in the patients who did vs did not die as a result of an infection. This applied to MNC-binding ATG, lymphocyte-binding ATG, T cell–binding ATG, and CD4 T cell–binding ATG (supplemental Figure 7).
Engraftment
No GF occurred in our cohort. We analyzed correlations between AUCs and the day of neutrophil or platelet engraftment (supplemental Tables 10-12).
For neutrophils, there was an inverse correlation between pre-AUC and engraftment day (MNC-binding ATG: r = −0.278; P = .005; lymphocyte-binding ATG: r = −0.202; P = .012). There was no such correlation for post-AUC (supplemental Table 10; Figure 5 top).
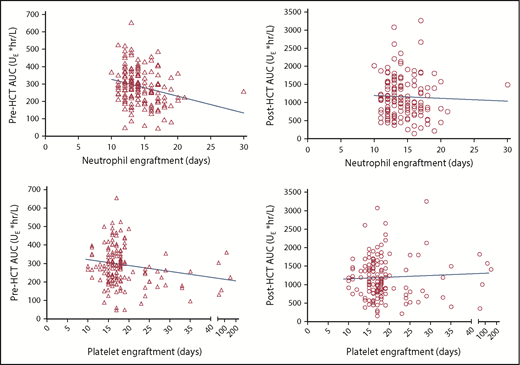
Scatter plots of pre- (triangle) or post-AUC (circle) of MNC-binding ATG vs the day of neutrophil (top) or platelet (bottom) engraftment. The correlation between pre-AUC and neutrophil engraftment (P = .005) was significant, and the correlation between pre-AUC and platelet engraftment (P = .055) was near significant. There was no significant correlation between post-AUC and neutrophil or platelet engraftment.
Scatter plots of pre- (triangle) or post-AUC (circle) of MNC-binding ATG vs the day of neutrophil (top) or platelet (bottom) engraftment. The correlation between pre-AUC and neutrophil engraftment (P = .005) was significant, and the correlation between pre-AUC and platelet engraftment (P = .055) was near significant. There was no significant correlation between post-AUC and neutrophil or platelet engraftment.
For platelets, similarly, there was a trend toward an inverse correlation between pre-AUC of MNC-binding ATG and engraftment day (r = −0.155; P = .055) and a significant inverse correlation between pre-AUC of lymphocyte-binding ATG and engraftment day (r = −0.181; P = .025). There was no such correlation for post-AUC (supplemental Table 10; Figure 5 bottom).
To ensure that the remission status was not a confounding factor, we performed a separate analysis of the pre-/post-AUC and engraftment correlation, restricted to patients with good-risk disease (acute leukemia in complete remission or myelodysplasia with <5% blasts). For neutrophils, the results were similar to those in the whole cohort (ie, a significant inverse correlation between pre-AUC, but not post-AUC, and engraftment day; pre-AUC of MNC-binding ATG: r = −0.267; P = .017; supplemental Table 11). For platelets, there was no significant correlation between pre- or post-AUC and engraftment day (supplemental Table 11).
Furthermore, to ensure that the day −2 MNC count was not a confounding factor, we performed a separate analysis of the pre-/post-AUC and engraftment correlation, restricted to patients with 0 or near-0 day −2 MNC counts (≤0.2 per μL). Similar to the whole cohort, there was significant inverse correlation between pre-AUC, but not post-AUC, and neutrophil engraftment (pre-AUC of MNC-binding ATG: r = −0.287; P < .001; supplemental Table 12). For platelets, there was no significant correlation between pre- or post-AUC and engraftment day (supplemental Table 12).
In summary, the association between high pre-AUC and faster engraftment is true for neutrophils, whereas further evaluation is needed for platelets.
OS, RFS, and cGRFS
High pre-AUC of MNC-binding ATG was significantly associated with high RFS (HR, 2.229; P = .011; Table 2; supplemental Table 6; Figure 6). A similar trend existed for OS and cGRFS (Table 2; supplemental Table 6; Figure 6).
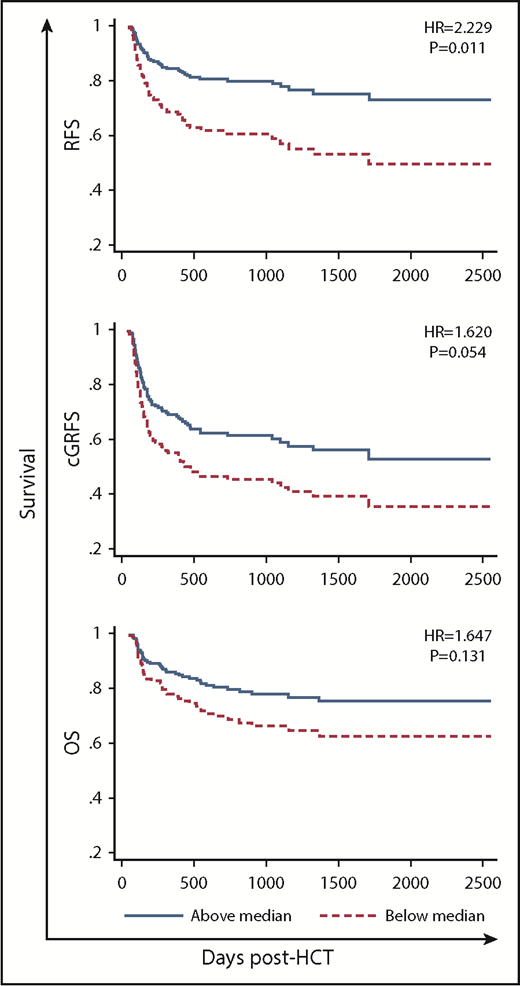
RFS, cGRFS, and OS in patients with low (below median) vs high pre-HCT AUC of MNC-binding ATG.
RFS, cGRFS, and OS in patients with low (below median) vs high pre-HCT AUC of MNC-binding ATG.
For post-AUC, there was no significant association with OS, RFS, or cGRFS. There was a trend toward an association between high post-AUC of CD4 T cell–binding ATG and low OS as well as low RFS (Table 2). There was also a trend toward an association between high post-AUC of CD33 cell–binding ATG and high cGRFS (Table 2).
As expected, Cmax and pre-graft levels mirrored pre-AUC (Table 2; supplemental Table 7), and day-7 and day-28 levels mirrored post-AUC (Table 2; supplemental Table 8). Notably, there was an association between high Cmax of MNC-binding ATG and high RFS. In contrast, there was the trend toward an association between high day-7 or day-28 level of MNC-binding ATG or CD4 T cell–binding ATG and low RFS (supplemental Table 8).
A caveat to these analyses of the association between ATG AUCs/levels and relapse, GVHD, OS, RFS, or cGRFS is the assumption that the higher/lower the AUC/level, the higher/lower the likelihood of the outcome. This would be invalid for outcomes that are more (or less) likely to occur when the AUC/level is high or low compared with intermediate. To determine whether such a relation applies to any of our AUC-outcome combinations, we split patients into quintiles according to pre-AUC and post-AUC. For each AUC-outcome combination, we determined whether quintile 1 was significantly different from quintile 2, 3, or 4 and whether quintile 5 was significantly different from quintile 2, 3, or 4. If quintile 2, 3, or 4 was significantly different from both quintiles 1 and 5, we concluded that the assumption that the higher/lower the AUC, the higher/lower the likelihood of the outcome is invalid. This was the case only for the AUC-outcome combination of post-AUC of CD33 cell–binding ATG and aGVHD (supplemental Figures 8-12). Therefore, we conclude that the caveat probably applies only to this 1 AUC-outcome combination.
It is known that the levels/AUCs of lymphocyte-binding ATG or Jurkat T cell–binding ATG are strongly influenced by the absolute lymphocyte count (ALC) before the first ATG infusion.30,40,41 Consistent with this, we observed a significant correlation between day −2 ALC and both pre-AUC and post-AUC of lymphocyte-binding ATG (supplemental Table 13). Analogously, there was also a significant correlation between day −2 absolute MNC count and both pre-AUC and post-AUC of MNC-binding ATG. There was no significant association between day-28 ALC or absolute MNC count and the respective pre-AUC or post-AUC (supplemental Table 13).
Discussion
We investigated the differential effect of pre- vs post-AUC on relapse. On the basis of the multivariate analysis results, we propose that higher pre-AUC had a positive effect on CIR and RFS and possibly OS. The opposite seemed to apply to post-AUC (ie, high post-AUC had a negative effect on CIR, RFS, and OS). The opposite effect of pre- vs post-AUC could be the reason why randomized trials have reported a neutral effect of ATG on relapse.10-12 The association between high pre-AUC and low CIR suggests that the direct antileukemic effect of ATG described in vitro13,14 is operational in vivo. In contrast, after HCT, the direct antileukemic effect may be overshadowed by ATG inhibiting GVL effect. We propose this because of the trend toward the association between high post-AUC and high CIR and the strong association between high post-AUC and low incidence of GVHD, which may be a surrogate for GVL effect.5,42,43
The differential effect of pre- vs post-AUC on outcomes was evaluated to our knowledge in only 2 published studies, by Admiraal et al44 and Jamani et al.30 Regarding relapse, no association with pre-AUC was found. This is likely due to differences in the ATG fractions measured. Admiraal et al measured Jurkat T cell–binding ATG, and Jamani et al measured lymphocyte-binding ATG. In our study, the low CIR was associated with pre-AUC of MNC-binding ATG and CD33 cell–binding ATG, but not lymphocyte-binding ATG. The latter is consistent with the studies by both Admiraal et al and Jamani et al. Regarding our finding of the trend toward the association between high post-AUC of lymphocyte-binding ATG and high CIR, similar trends appeared in both Admiraal et al and Jamani et al studies. In the Admiraal et al study, the evidence was indirect. High post-AUC was associated with poor CD4 T cell reconstitution, which was associated with high relapse-related mortality. It is reassuring that another study, which focused only on post-AUC,19 also found a significant association between high post-AUC and high relapse-related mortality.
GVHD in the Admiraal et al44 study of the differential effect of pre- vs post-AUC was associated with both pre- and post-AUC in univariate analysis. However, in multivariate analysis, GVHD was associated only with pre-AUC.44 The reason for the discrepancy between this and our finding is unclear. However, there are multiple differences between the studies that could play a role (eg, pediatric vs adult patients, patients with mostly nonmalignant vs malignant diseases, marrow or cord blood grafts vs blood stem cells, early [starting on day −9 or −5] vs late [starting on day −2] administration of ATG, measurement of ATG levels capable of binding to Jurkat T cells vs MNCs/MNC subsets, or calculation of AUCs based on a population PK model vs trapezoidal rule in the Admiraal et al study vs our study, respectively). The findings of Jamani et al30 on GVHD were more similar to those of our study, because high post-AUC in the Jamani et al study was significantly associated with low incidence of aGVHD, whereas there was only a trend toward an association between the low incidence of aGVHD and high pre-AUC.
Our observation of post-AUC (and not pre-AUC) being higher in patients who died as a result of an infection is consistent with the Admiraal et al44 study, which showed that high post-AUC (and not pre-AUC) was associated with poor CD4 T-cell reconstitution, which was associated with high nonrelapse mortality mostly resulting from infections. It is also consistent with the Jamani et al30 study, which showed that non–GVHD-associated nonrelapse mortality (presumably because of infections) was associated with high post-AUC (and not pre-AUC).
Inconsistent data exist in the literature on the effect of ATG on engraftment. The Admiraal et al44 study showed an association between high pre-AUC (and not post-AUC) of ATG and low incidence of GF. In contrast, the randomized study by Soiffer et al45 of rabbit anti-Jurkat T-cell globulin (Grafalon) vs placebo in adult recipients of blood stem cells showed that the study drug was associated with a higher incidence of GF. In 2 of 3 randomized studies of ATG and 4 of 4 randomized studies of rabbit anti-Jurkat T-cell globulin vs no or low-dose ATG, delayed engraftment of neutrophils and/or platelets was noted, with no impact on GF, except in the Soiffer et al study.11,45-49 Per our study, high pre-AUC seems to accelerate engraftment, particularly neutrophil engraftment, whereas post-AUC seems to have no impact on engraftment.
Whether the ATG level at a certain time point vs the AUC containing that time point is more strongly associated with an outcome is a matter of debate. The data generated in this study favor AUC, but they are inconclusive (Table 2; supplemental Tables 7 and 8). For example, pre-AUC showed a stronger association with relapse than Cmax, both for MNC-binding ATG (SHR, 0.436 vs 0.617; P = .032 vs .226) and CD33 cell–binding ATG (SHR, 0.300 vs 0.381; P = .010 vs .025). As another example, post-AUC of lymphocyte-binding ATG or T cell–binding ATG showed a stronger association with grade 2 to 4 aGVHD than day-7 levels (lymphocyte-binding ATG: SHR, 0.275 vs 0.287; P < .001 vs .001; T cell–binding ATG: SHR, 0.316 vs 0.337; P = .001 vs .002). In contrast, post-AUC of MNC-binding ATG, CD4 T cell–binding ATG, or CD33 cell–binding ATG showed a weaker association with grade 2 to 4 aGVHD than day-7 level (MNC-binding ATG: SHR, 0.391 vs 0.308; P = .007 vs .001; CD4 T cell–binding ATG: SHR, 0.366 vs 0.344; P = .004 vs .003; CD33 cell–binding ATG: SHR, 0.766 vs 0.424; P = .408 vs .013).
Our study has limitations. (1) Because of the unavailability of serum specimens for all 152 patients from the end of ATG infusion (Cmax), we estimated the ATG levels from the median population log/linear distribution phase slope of Cmax to graft infusion time, assuming a completed distribution, which was an unknown. Although we demonstrated that the estimation was reasonably accurate (supplemental Figure 3), this could bring an element of inaccuracy. (2) The AUCs were calculated using the trapezoidal rule, because serum for ATG level determination was collected at only 4 or 5 time points, which precluded building a compartmental population PK model. (3) The low incidence of fatal infections (only 6 patients died as a result of an infection) did not allow for multivariate analysis for the association between pre-/post-AUC and fatal infections. Likewise, only 7 patients developed grade 3 to 4 aGVHD. This did not allow for multivariate analysis for the association between pre-/post-AUC and grade 3 to 4 aGVHD.
Barring these limitations, our study suggests that high pre-AUC has only beneficial effects (antirelapse and proengraftment), whereas high post-AUC has both beneficial (anti-GVHD) and deleterious effects (prorelapse and proinfection; Figure 7).

This suggests that CIR could be further improved without negatively affecting GVHD, engraftment, or posttransplantation infections through administration of high-dose ATG early in conditioning. The goal would be to achieve a higher-than-conventional pre-AUC and a similar-to-conventional post-AUC. To reach this goal, knowledge of factors influencing ATG PKs, partly elucidated by the Utrecht group,41,44 needs to be further refined (eg, expanded to ATG fractions other than Jurkat T cell–binding ATG or to HCT settings [eg, conditioning-graft-GVHD prophylaxis combinations] other than those studied by the Utrecht group). Given the high interindividual variability in ATG PKs, individualized and/or PK-adjusted dosing may be needed. If the goal of achieving an ideal high (higher-than-conventional) pre-AUC and ideal (possibly similar-to-conventional) post-AUC is reached, it should lead to improved RFS and could lead to improved OS. This should be studied in a clinical trial.
The medians and ranges of the ATG levels and AUCs for both pre- and posttransplantation time points can be found in the supplemental data. For any other data, please contact Rosy Dabas (rdabas@ucalgary.ca).
The full-text version of this article contains a data supplement.
Acknowledgments
The authors thank Liela Mendoza, Melissa Jenkins, Cynthia Lam, Mamta Kantharia, and Krista Dyck for invaluable help with data or specimen collection and the staff of the Alberta Blood and Marrow Transplant Program, including inpatient and outpatient nurses (led by Lorraine Harrison and Naree Ager), nurse practitioner Nanette Cox-Kennett, and physicians including M. Nancy Zacarias, Ping Yue, Nizar Bahlis, Chris Brown, Peter Duggan, Michelle Geddes, Mona Shafey, Jason Tay, Minakshi Taparia, and Douglas A. Stewart.
This study was supported by the Alberta Cancer Foundation, the Buckley Foundation, R. W. (Bob) Taylor, and the Pearson family.
Authorship
Contribution: R.D. measured the ATG levels, analyzed the data, and wrote the manuscript; K.J., S.O., and C.D. contributed to data collection; S.B.K., P.D.-K., D. Morris, D. Mahoney, T.S.W., L.S., A.C., V.H.J.-Z., F.M.K., and A.D. provided scientific input; and J.S. conceived the idea and supervised the execution of the project.
Conflict-of-interest disclosure: J.S. has received research funding from Sanofi. K.J. received honoraria from Sanofi. The remaining authors declare no competing financial interests.
Correspondence: Rosy Dabas, University of Calgary, 3310 Hospital Dr NW, Calgary, AB T2N 4N1, Canada; e-mail: rdabas@ucalgary.ca.

