

Key Points
CBFA2T3 is required for maintaining LSC gene signatures and proliferation of AML cells.
Differential abilities of patients with AML to repress CBFA2T3 gene transcription are correlated with patient-specific outcomes in AML.

Abstract
CBFA2T3 is a master transcriptional coregulator in hematopoiesis. In this study, we report novel functions of CBFA2T3 in acute myeloid leukemia (AML) relapse. CBFA2T3 regulates cell-fate genes to establish gene expression signatures associated with leukemia stem cell (LSC) transformation and relapse. Gene set enrichment analysis showed that CBFA2T3 expression marks LSC signatures in primary AML samples. Analysis of paired primary and relapsed samples showed that acquisition of LSC gene signatures involves cell type–specific activation of CBFA2T3 transcription via the NM_005187 promoter by GCN5. Short hairpin RNA–mediated downregulation of CBFA2T3 arrests G1/S cell cycle progression, diminishes LSC gene signatures, and attenuates in vitro and in vivo proliferation of AML cells. We also found that the RUNX1-RUNX1T1 fusion protein transcriptionally represses NM_005187 to confer t(8;21) AML patients a natural resistance to relapse, whereas lacking a similar repression mechanism renders non–core-binding factor AML patients highly susceptible to relapse. These studies show that 2 related primary AML-associated factors, the expression level of CBFA2T3 and the ability of leukemia cells to repress cell type–specific CBFA2T3 gene transcription, play important roles in patient prognosis, providing a paradigm that differential abilities to repress hematopoietic coregulator gene transcription are correlated with patient-specific outcomes in AML.
Introduction
The myeloid translocation gene (MTG) family of transcriptional corepressors comprise RUNX1T1 (ETO, MTG8),1 CBFA2T3 (ETO2, MTG16),2 and CBFA2T2 (MTGR1).3 In 10% to 15% of acute myeloid leukemia (AML), a t(8;21) chromosomal translocation fuses RUNX1T1 to the RUNX1 transcription factor, generating the RUNX1-RUNX1T1 fusion protein.1,4 CBFA2T3 is also targeted by leukemogenic chromosomal alterations to induce therapy-related AML2 and pediatric acute megakaryoblastic leukemia.5 MTGs share 4 conserved Nervy homology regions (NHR1-4)6,7 and bind DNA through interactions with transcription factors, particularly E proteins.8 E proteins activate transcription by recruiting p300 and GCN5 histone acetyltransferases. MTGs function as corepressors of E proteins to dismiss p300 and GCN5.8,9 CBFA2T3 plays an important role in normal hematopoiesis and is coexpressed with E proteins (E2A, HEB) in hematopoietic stem and progenitor cells (HSPCs).10-12 In HSPCs, E2A activates p21 (CDKN1A) gene transcription to induce cell quiescence.13,14 Conversely, CBFA2T3 maintains HSPC proliferation and inhibits differentiation by repressing E protein–mediated transcription of p21.11 Loss of CBFA2T3 inhibits HSPC expansion in emergency hematopoiesis.15
Relapse in AML results from clonal expansion of preexisting leukemia stem cells (LSCs) or de novo LSCs generated from therapy-resistant preleukemia or blast cells.16,17 LSCs share properties with hematopoietic stem cells (HSCs), including their abilities to undergo self-renewal and asymmetric cell division.18,19 Although AML is associated with an overall poor prognosis,20 ∼20% of patients with AML have favorable prognoses. These patients carry the so-called core binding–factor (CBF) fusion proteins, including RUNX1-RUNX1T1 generated by t(8;21) translocation and CBFB-MYH11 generated by inversion (16) [inv(16)].21-23 These CBF fusion proteins target each of the 2 subunits of the CBF heterodimer, RUNX1/CBFβ, the functional form of RUNX1 involved in DNA binding.
In the current study, we found that CBFA2T3 is expressed in AML patient samples and is required for maintaining LSC gene signatures and proliferation of AML cells. Patients with AML expressing high levels of CBFA2T3 are associated with poor prognosis. Patients expressing low CBFA2T3 are also associated with poor prognosis provided that their leukemia cells do not have a repression mechanism in place to prevent cell type–specific activation of CBFA2T3 by GCN5. In t(8;21) AML, repression of CBFA2T3 transcription by the RUNX1-RUNX1T1 fusion protein confers low-CBFA2T3 t(8;21) patients with the ability to resist relapse. These studies reveal a new function of CBFA2T3 in AML relapse and provide a paradigm that differential abilities to repress a master hematopoietic coregulator gene are involved in patient-specific outcomes in AML.
Methods
Cell culture, chemicals, plasmids, and primers
AML cells were maintained in RPMI 1640 with 10% fetal bovine serum.8 HSPCs were enriched from umbilical cord blood of de-identified human donors (EasySep kit; STEMCELL Technologies) and cultured in Iscove modified Dulbecco medium supplemented with 20% fetal bovine serum, FLT3-ligand (100 ng/mL), stem cell factor (100 ng/mL), thrombopoietin (100 ng/mL), interleukin-6 (20 ng/mL), granulocyte-macrophage colony-stimulating factor (20 ng/mL), and interleukin-3 (50 ng/mL) (PeproTech). Lentiviruses were produced in HEK293T cells.9 CPTH2 (50 μM), MB-3 (100 μM), and short hairpin RNAs (shRNAs) for RUNX1-RUNX1T1 and CBFA2T3 were from MilliporeSigma. The CBFA2T3 shRNA targets an exon 9 sequence present in both CBFA2T3 isoforms. Control shRNA was from Addgene (#1864). Lentiviral expression vectors for CBFA2T3, RUNX1-RUNX1T1, and RUNX1-RUNX1T19a were generated following standard molecular cloning/polymerase chain reaction (PCR) procedures using pCDH Cloning and Expression Lentivectors (System Biosciences) and were verified by DNA sequencing. Peripheral blood samples were obtained from patients with AML under Institutional Review Board protocol #28080 approved by the Saint Louis University to use in research in accordance with the Declaration of Helsinki. A list of shRNA sequences and PCR primers is provided in supplemental Table 1.
Colony formation and cell proliferation
A total of 4000 cells were cultured in Methylcellulose Enriched Media (R&D Systems). Colonies were counted by microscopy 10 to 14 days after plating. For proliferation assays, cells were plated 4 days after lentiviral transduction and were counted daily.
Gene expression, pathway, and patient analyses
Reverse transcription-quantitative PCR (RT-qPCR) was performed as previously described.9 For internal controls, 18S ribosomal RNA was used for SKNO-1 cells, and glyceraldehyde-3-phosphate dehydrogenase was used for all other cells. Whole-genome AmpliSeq analysis was performed by using Ion AmpliSeq Transcriptome Human Gene Expression and Ion 540 kit-OT2 (Thermo Fisher Scientific). LIMMA24 was used to identify differentially expressed genes in microarray datasets (GSE14468 and GSE66525). High and low gene expression was relative to median expression levels in all samples. RNA sequencing (RNA-Seq) analysis was performed by using Kallisto25 and edgeR.26,27 Gene Set Enrichment Analysis28 was performed by using “fgsea”29 R package along with MSigDB30 C2 V5.1 gene sets. Kaplan-Meier survival analysis was performed using “survival” and “survminer” R packages. A summary of the GSE14468, GSE66525, and GSE83533 patient datasets is provided in supplemental Table 2.
Single-cell RNA-Seq analysis
To assess the endogenous expression of CBFA2T3 transcripts (NM_005187, NM_175931) in human hematopoiesis, we downloaded raw FASTQ files from a single-cell RNA-Seq study that profiled fluorescence-activated cell sorted CD34+ HSPCs from healthy human donors (GSE7547831 ). Isoform-specific alignment and count matrix normalization were performed with Kallisto,25 and downstream analyses were performed with the Seurat32 package in R.
Chromatin immunoprecipitation sequencing and analysis
Chromatin immunoprecipitation (ChIP) was performed as previously described.9 Antibodies include RUNX1-RUNX1T1 (in-house made), HEB (SC-357; Santa Cruz Biotechnology), E2A (SC-349; Santa Cruz Biotechnology), CBFA2T3 (SC-9741; Santa Cruz Biotechnology), GCN5 (SC-20698; Santa Cruz Biotechnology), p300 (SC-584; Santa Cruz Biotechnology), H3K18ac (ab1191; Abcam), and H3K9ac (ab32129; Abcam). Sequencing was performed at the Genome Technology Access Center at Washington University in St. Louis. ChIP sequencing (ChIP-Seq) results were analyzed by using HOMER as previously described.33
Cell cycle analysis
For propidium iodide staining, 5 × 10⁵ cells were fixed/permeabilized in ice-cold ethanol.34 Fixed cells were washed and incubated in cell cycle buffer (30 μg/mL propidium iodide, 100 μg/mL RNase A in phosphate-buffered saline) overnight at 4°C. BrdU staining was performed by using the APC BrdU Flow Kit (BD Pharmingen). All samples were analyzed on a BD Accuri C6 Plus flow cytometer. Fluorescence-activated cell sorting files were processed, gated, and analyzed by using the flowCore and flowPloidy package suites in R.35,36
Mouse engraftment analysis
Per an approved animal protocol, all experiments used NSG mice (NOD/SCID/IL2rg−/−) from The Jackson Laboratory unless otherwise noted. AML cells transduced with control or a CBFA2T3-specific shRNA along with pLenti PGK V5-LUC Neo (Addgene) were tail-vein injected into 8-week-old mice (n = 6) following sublethal radiograph irradiation. In vivo bioluminescence assays were performed by using a high-sensitivity CCD camera (IVIS Spectrum In Vivo Imaging System) 15 minutes after peritoneal injection of 150 mg/kg D-Luciferin potassium salt (PerkinElmer).
Statistical analysis
For continuous variables, P values were from the Student t test adjusted for multiple testing errors (false discovery rate) unless otherwise indicated. For discrete variables, P values were from hypergeometric or Fisher’s exact tests. P values for time-dependent in vitro and in vivo cell proliferation were also calculated by using a time/proliferation interaction term in linear regression. In survival analysis, P values were from log-rank tests. All experiments were performed at least in triplicate unless otherwise noted.
Datasets
ChIP-Seq results have been deposited to the Gene Expression Omnibus repository under GSE126953.
Results
CBFA2T3 expression marks preexisting LSC gene signatures in primary AML cells
LIMMA37 was used to analyze differential gene expression of de novo primary AML samples (n = 526, GSE1446838 ) showing normally distributed CBFA2T3 expression (Figure 1A; supplemental Figure 1A). A total of 276 genes, including JUP39,40 and BCL2,41 exhibited enriched expression in high-CBFA2T3 samples. A total of 495 genes, including CDKN1A (p21) and IFNGR1/2, showed depleted expression in these samples (supplemental Figure 1B; supplemental File 1). CBFA2T3-coexpressed genes were involved in regulating self-renewal and cell number of HSCs, whereas CBFA2T3-depleted genes were enriched with inflammatory, cytokine production, and immune functions. High CBFA2T3 expression was associated with minimally differentiated AML FAB subtypes (Figure 2C). JUP and BCL2 promote self-renewal and survival of HSCs/LSCs, whereas p21 inhibits HSC proliferation.13,14 Interferon-γ (IFN-γ) promotes differentiation while impairing proliferation of HSCs and AML cells.42-44 We thus designated the 276 CBFA2T3-coexpressed genes as pro-HSC/LSC genes and the 495 CBFA2T3-depleted genes as anti-HSC/LSC genes. Gene set enrichment analysis (GSEA) using all 526 samples showed that high-CBFA2T3 expression was associated with enriched expression of HSC/LSC genes, G1/S cell cycle genes, and depleted expression of IFN-γ/immune genes (Figure 1B; supplemental Figure 1C; supplemental File 2). GSEA analyses within t(8;21), inv(16), and non-CBF AML subtypes showed that the aforementioned observed correlation between high-CBFA2T3 expression and LSC gene signatures was conserved among all 3 AML subtypes (supplemental Figure 1D).
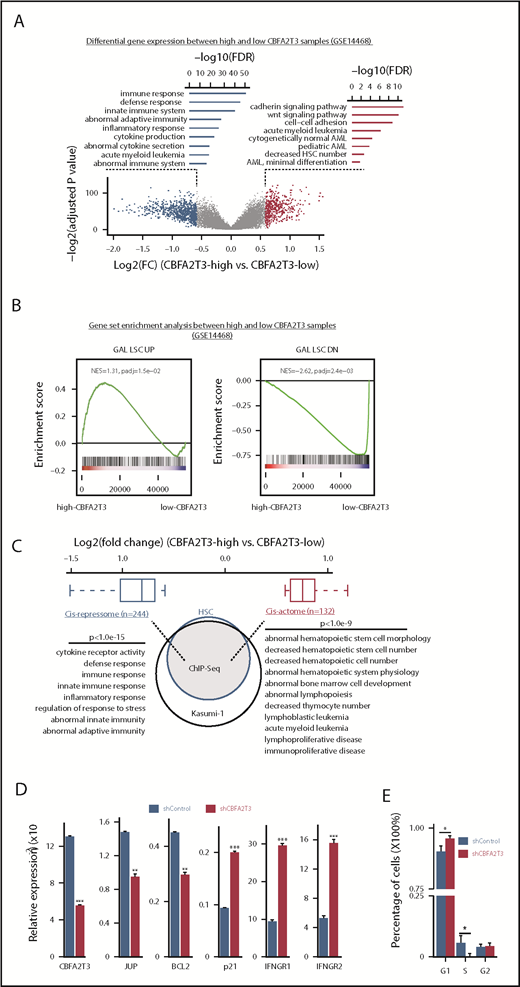
CBFA2T3 marks LSC gene signatures and opposingly regulates HSC/LSC and antiproliferative genes. (A) Volcano plot of gene expression changes (fold changes ≥1.5, adjusted P ≤ .05) in high-CBFA2T3 vs low-CBFA2T3 patient samples in the GSE14468 dataset. High and low CBFA2T3 expression is relative to the median level in all patient samples (n = 526). Also shown are Gene Ontology functions of the downregulated (left, blue) and upregulated (right, red) genes. (B) GSEA showing association of HSC/LSC gene signatures with high-level CBFA2T3 expression in the patient samples. NES, normalized enrichment score. The colored bar at the bottom shows ranked gene expression based on fold changes and P value. Red indicates upregulation in high-CBFA2T3 samples, whereas blue indicates downregulation in high-CBFA2T3 samples. (C) A Venn diagram showing overlap of CBFA2T3-occupied genes in HSCs and Kasumi-1 cells. Also shown are log2 fold changes of CBFA2T3 cis-repressome genes (blue) and cis-actome genes (red) and the biological functions of the CBFA2T3-binding sites at these genes identified by GREAT.58 (D) RT-qPCR showing effects of CBFA2T3 knockdown on messenger RNA expression of the indicated genes in human HSPCs. (E) Cell cycle phase quantification modeled from propidium iodide–stained DNA content histograms. Error bars represent the 95% confidence interval, calculated by bootstrap resampling of the original events. P values were calculated by permutation tests (n = 1000).
CBFA2T3 marks LSC gene signatures and opposingly regulates HSC/LSC and antiproliferative genes. (A) Volcano plot of gene expression changes (fold changes ≥1.5, adjusted P ≤ .05) in high-CBFA2T3 vs low-CBFA2T3 patient samples in the GSE14468 dataset. High and low CBFA2T3 expression is relative to the median level in all patient samples (n = 526). Also shown are Gene Ontology functions of the downregulated (left, blue) and upregulated (right, red) genes. (B) GSEA showing association of HSC/LSC gene signatures with high-level CBFA2T3 expression in the patient samples. NES, normalized enrichment score. The colored bar at the bottom shows ranked gene expression based on fold changes and P value. Red indicates upregulation in high-CBFA2T3 samples, whereas blue indicates downregulation in high-CBFA2T3 samples. (C) A Venn diagram showing overlap of CBFA2T3-occupied genes in HSCs and Kasumi-1 cells. Also shown are log2 fold changes of CBFA2T3 cis-repressome genes (blue) and cis-actome genes (red) and the biological functions of the CBFA2T3-binding sites at these genes identified by GREAT.58 (D) RT-qPCR showing effects of CBFA2T3 knockdown on messenger RNA expression of the indicated genes in human HSPCs. (E) Cell cycle phase quantification modeled from propidium iodide–stained DNA content histograms. Error bars represent the 95% confidence interval, calculated by bootstrap resampling of the original events. P values were calculated by permutation tests (n = 1000).
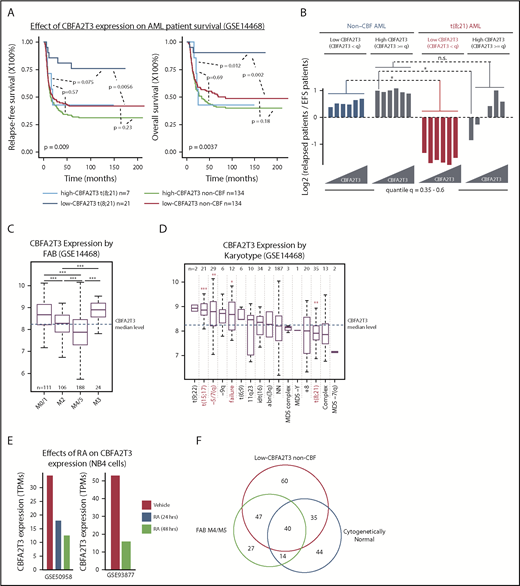
Low-CBFA2T3 expression predicts favorable prognosis in t(8;21) AML but not non-CBF AML. (A) Kaplan-Meier analyses of relapse-free and overall survival of t(8;21) and non-CBF patients expressing high and low CBFA2T3 (GSE14468). The P value shown at the left bottom corner is derived from comparison of all sample groups (log-rank test). (B) Relapse potentials of t(8;21) and non-CBF AML patients expressing CBFA2T3 below or above different quantile levels shown at the bottom (GSE14468). For each quantile, the y-axis denotes log2 ratios of relapsed vs event-free survival (EFS) patients expressing CBFA2T3 below or above the quantile level measured independently for t(8;21) and non-CBF AML patients. P values were derived from the hypergeometric test. (C-D) Levels of CBFA2T3 expression among different AML FAB subtypes (C) and karyotypes (D). In panel D, the P values were calculated between patients with and without each of given karyotypes. (E) CBFA2T3 expression levels in PML-RARα–expressing NB4 cells treated with dimethyl sulfoxide or ATRA (RA). (F) Venn diagram showing overlap of FAB M4/M5, low-CBFA2T3 non-CBF, and cytogenetically normal AML subtypes (GSE14468). *P < .05; **P < .01; ***P < .001. n.s., not significant.
Low-CBFA2T3 expression predicts favorable prognosis in t(8;21) AML but not non-CBF AML. (A) Kaplan-Meier analyses of relapse-free and overall survival of t(8;21) and non-CBF patients expressing high and low CBFA2T3 (GSE14468). The P value shown at the left bottom corner is derived from comparison of all sample groups (log-rank test). (B) Relapse potentials of t(8;21) and non-CBF AML patients expressing CBFA2T3 below or above different quantile levels shown at the bottom (GSE14468). For each quantile, the y-axis denotes log2 ratios of relapsed vs event-free survival (EFS) patients expressing CBFA2T3 below or above the quantile level measured independently for t(8;21) and non-CBF AML patients. P values were derived from the hypergeometric test. (C-D) Levels of CBFA2T3 expression among different AML FAB subtypes (C) and karyotypes (D). In panel D, the P values were calculated between patients with and without each of given karyotypes. (E) CBFA2T3 expression levels in PML-RARα–expressing NB4 cells treated with dimethyl sulfoxide or ATRA (RA). (F) Venn diagram showing overlap of FAB M4/M5, low-CBFA2T3 non-CBF, and cytogenetically normal AML subtypes (GSE14468). *P < .05; **P < .01; ***P < .001. n.s., not significant.
CBFA2T3 regulates pro-HSC/LSC and anti-HSC/LSC genes
We next questioned if CBFA2T3 directly regulates pro-HSC/LSC and anti-HSC/LSC genes by performing ChIP-Seq in human CD34+ HSPCs, CBFA2T3-transduced t(8;21) Kasumi-1 cells, and wild-type non-t(8;21) U937 AML cells (supplemental File 3). Given that HSC/LSC markers such as CD34 are expressed in Kasumi-1 cells but not in U937 cells (RNA-Seq data not shown), we focused on CD34+ HSPCs and Kasumi-1 cells to identify high-confidence CBFA2T3 target genes in HSC/LSC cells. Among the 7737 genes occupied by CBFA2T3 in both CD34+ HSPCs and Kasumi-1 cells, we identified 132 pro-HSC/LSC genes, designated as “cis-actome” genes, showing enriched expression in high-CBFA2T3 AML samples, and 244 anti-HSC/LSC genes, designated as “cis-repressome” genes, showing depleted expression in high-CBFA2T3 AML samples (Figure 1C; supplemental File 1). Pathway analysis revealed that these CBFA2T3 direct target genes carried similar biological functions as the total pro- and anti-HSC/LSC genes.
CBFA2T3 was highly expressed in CD34+ HSPCs and the most primitive erythroid progenitors (GSE1159, GSE24759) (supplemental Figure 2C-D). In CD34+ HSPCs, CBFA2T3 bound to active genes (supplemental Figure 2A) and regulated gene expression in a similar fashion as it regulated gene expression in AML patient samples. Our ChIP-Seq showed that CBFA2T3-binding sites in CD34+ HSPCs and AML cells were similarly enriched with E-box, ETS, and RUNX1 motifs (data not shown). Expression of cis-actome and cis-repressome genes also showed similar patterns of regulation in CD34+ HSPCs (GSE1159) and high-CBFA2T3 samples (GSE14468) compared with normal bone marrow and low-CBFA2T3 samples, respectively (supplemental Figure 2B). Furthermore, depleting CBFA2T3 in CD34+ HSPCs recapitulated its regulation of JUP, BCL2, p21, and IFNGR1/2 in the AML patient samples shown earlier (Figure 1D; supplemental Figure 1B). Biological assays revealed that depleting CBFA2T3 in CD34+ HSPCs arrested proliferation (supplemental Figure 3A), inhibited colony formation (supplemental Figure 3B), and blocked G1/S transition (Figure 1E).
Low CBFA2T3 specifically predicts favorable prognosis in t(8;21) AML
Given the relationship between CBFA2T3 and HSC/LSC gene expression, we decided to further explore its role in AML progression. An initial GSEA analysis comparing relapsed and event-free survival patients (GSE14468) revealed similar associations of HSC/LSC gene signatures with primary samples of relapsed patients (supplemental Figure 4A) and primary samples expressing high CBFA2T3 (supplemental Figure 1C). Kaplan-Meier analysis, however, revealed that patients expressing low CBFA2T3 also had a relatively fast relapse rate (supplemental Figure 4B). This finding led us to hypothesize that the prognostic effect of CBFA2T3 expression in AML was subtype specific. Confirming this theory, Kaplan-Meier analyses of individual AML subtypes showed that, unlike non-CBF and inv(16) AML, the prognostic outcome of t(8;21) AML was highly dependent on the levels of CBFA2T3 expression at diagnosis (Figure 2A; supplemental Figure 4C-D). Accordingly, high-CBFA2T3 but not low-CBFA2T3 t(8;21) patients no longer exhibited a favorable prognosis compared with non-CBF AML patients. By comparing the ratio of relapsed vs event-free survival patients and by examining a range of CBFA2T3 cutoff levels, we independently confirmed this result (Figure 2B).
We also assessed correlations between CBFA2T3 expression at diagnosis and other covariates using the GSE14468 dataset. High-CBFA2T3 expression was associated with absence (FAB M0) or low differentiation (FAB M1) AML samples, whereas low-CBFA2T3 expression was associated with more differentiated FAB M4/M5 and t(8;21) FAB M2 subtypes (Figure 2C-D). High-CBFA2T3 expression was also associated with t(15;17) APL (FAB M3) and deletion of chromosome 5/7 (–5/7[q]), both of which are highly aggressive AML subtypes.45,46 Because t(15;17) APL can be treated by all-trans retinoic acid (ATRA), which induces monocytic differentiation, we examined the effect of ATRA on CBFA2T3 expression in t(15;17) APL. We found that ATRA rapidly downregulated CBFA2T3 (GSE50958,47 GSE9387748 ) (Figure 2E), adding further support to the idea that high-CBFA2T3 expression is important for leukemia progression. Low-CBFA2T3 non-CBF patients were frequently associated with FAB M4/M5 and cytogenetically normal karyotypes (Figure 2F). By clustering low-CBFA2T3 non-CBF samples, we provided further evidence that the preexisting gene expression state at diagnosis had a low impact on prognosis of non-CBF AML (supplemental Figure 5), in contrast to t(8;21) AML.
CBFA2T3 is induced in low-CBFA2T3 non-CBF patients during relapse
To test if CBFA2T3 is susceptible to induction during relapse of low-CBFA2T3 non-CBF patients, we analyzed paired primary and relapsed AML samples of cytogenetically normal non-CBF patients (GSE6652549 ), a large portion of whom belong to the FAB M4/M5 subtype (data not shown). Supporting the hypothesis, CBFA2T3 expression was upregulated in all relapsed patients initially expressing low CBFA2T3 (Figure 3A). Fold changes of CBFA2T3 expression were inversely correlated with its expression in primary AML samples (Figure 3B). Two clusters of the patient samples were resolved by the first principal component axis. These 2 clusters, which were designated as “Pre-LSC” and “LSC,” had large differences in CBFA2T3 expression at diagnosis and total gene expression changes between diagnosis and relapse, as measured by the Euclidean distance (Figure 3C). Detailed characterization of the 2 clusters supported the idea that relapse-specific gene signatures had preexisted in the high-CBFA2T3 AML samples at diagnosis, whereas low-CBFA2T3 primary AML patients acquired LSC gene signatures de novo (Figure 3D-E). Notably, despite these differential gene expression changes, both patient groups displayed a fast relapse rate, suggesting that CBFA2T3 upregulation occurs relatively quickly after initial remission (supplemental Figure 6).
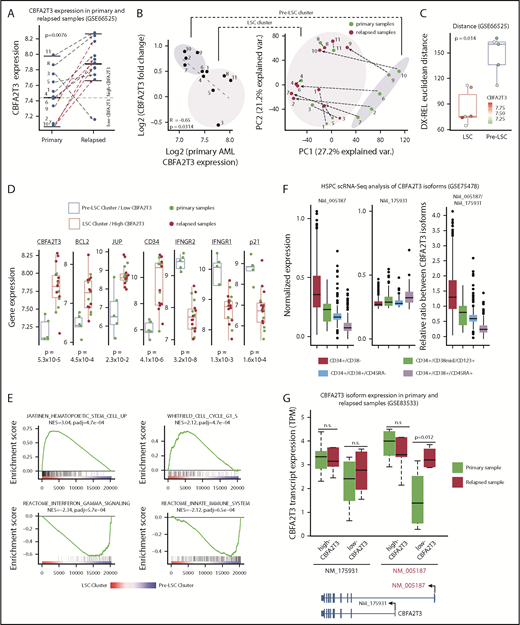
CBFA2T3 expression is rapidly induced during relapse of low-CBFA2T3 non-CBF AML patients. (A) Comparison of CBFA2T3 expression levels in matched primary and relapsed samples from 11 cytogenetically normal non-CBF AML patients (GSE66525). (B, left) Scatter plot showing inverse correlation between CBFA2T3 expression changes and its expression levels in primary samples. (B, right) Principal component analysis identified 2 sample clusters, one of which (“Pre-LSC”) comprised all low-CBFA2T3 patients at diagnosis. Green dots denote samples from diagnosis, and red dots denote relapsed samples, with dashed lines defining the 2 samples from a single individual. (C) To quantify the total “change” between each patient’s diagnosis and relapse sample, we calculated the patient-specific Euclidean distance between diagnosis (Dx) and relapsed (Rel) samples using all genes. The Wilcoxon rank sum test showed a significant difference between LSC and pre-LSC groups. The points corresponding to each patient are colored by their CBFA2T3 expression at diagnosis. (D) Expression levels of genes indicated at the top in primary and relapsed samples within the low-CBFA2T3 pre-LSC and high-CBFA2T3 LSC sample clusters. (E) GSEA results showing enriched expression of HSC/LSC and cell cycle genes and depleted expression of IFN-γ and innate immune genes in LSC cluster vs pre-LSC cluster. NES, normalized enrichment score. (F) Comparison of expression levels of NM_005187 and NM_175931 CBFA2T3 transcripts in a single-cell RNA-Seq (scRNA-Seq) dataset profiling human HSPCs expressing different cell surface markers. (G) Comparison of expression changes of NM_005187 and NM_175931 CBFA2T3 transcripts in primary and relapsed AML samples in the GSE83533 dataset.
CBFA2T3 expression is rapidly induced during relapse of low-CBFA2T3 non-CBF AML patients. (A) Comparison of CBFA2T3 expression levels in matched primary and relapsed samples from 11 cytogenetically normal non-CBF AML patients (GSE66525). (B, left) Scatter plot showing inverse correlation between CBFA2T3 expression changes and its expression levels in primary samples. (B, right) Principal component analysis identified 2 sample clusters, one of which (“Pre-LSC”) comprised all low-CBFA2T3 patients at diagnosis. Green dots denote samples from diagnosis, and red dots denote relapsed samples, with dashed lines defining the 2 samples from a single individual. (C) To quantify the total “change” between each patient’s diagnosis and relapse sample, we calculated the patient-specific Euclidean distance between diagnosis (Dx) and relapsed (Rel) samples using all genes. The Wilcoxon rank sum test showed a significant difference between LSC and pre-LSC groups. The points corresponding to each patient are colored by their CBFA2T3 expression at diagnosis. (D) Expression levels of genes indicated at the top in primary and relapsed samples within the low-CBFA2T3 pre-LSC and high-CBFA2T3 LSC sample clusters. (E) GSEA results showing enriched expression of HSC/LSC and cell cycle genes and depleted expression of IFN-γ and innate immune genes in LSC cluster vs pre-LSC cluster. NES, normalized enrichment score. (F) Comparison of expression levels of NM_005187 and NM_175931 CBFA2T3 transcripts in a single-cell RNA-Seq (scRNA-Seq) dataset profiling human HSPCs expressing different cell surface markers. (G) Comparison of expression changes of NM_005187 and NM_175931 CBFA2T3 transcripts in primary and relapsed AML samples in the GSE83533 dataset.
Acquisition of LSC gene signatures is associated with isoform-specific activation of CBFA2T3 transcription
Two predominant isoforms, NM_005187 and NM_175931, are transcribed from the CBFA2T3 locus. Compared with NM_175931, NM_005187 was expressed at higher levels and is located adjacent to DNase-HS sites in CD34+ HSPCs (supplemental Figure 7A-B), suggesting that NM_005187 is a cell type–specific CBFA2T3 transcript. This idea was further supported by analyzing a public single-cell RNA-Seq dataset (GSE75478). NM_005187 drives the vast majority of expression variability at the single-cell level and showed the highest expression in the most primitive CD34+/CD38– HSPC population (Figure 3F; supplemental Figure 8). To test if relapse-associated change of gene expression involves direct activation of CBFA2T3 transcription, we analyzed an RNA-Seq dataset from paired primary and relapsed AML samples (GSE83533).50 We found that transcriptional upregulation of CBFA2T3 was again observed in relapsed samples (supplemental Figure 9). Furthermore, whereas NM_175931 expression was largely unaffected during relapse, NM_005187 exhibited a strong upregulation in the relapsed samples of low-CBFA2T3 AML patients (Figure 3G; supplemental Figure 7C-D).
CBFA2T3 is important for proliferation of non-CBF AML cells
These results indicated that high-CBFA2T3 expression was associated with relapsed gene signatures of non-CBF AML samples. To explore the causal role of CBFA2T3 in non-CBF AML cells, we first showed that CBFA2T3 was required for expression of pro-HSC/LSC genes (BCL2, JUP) in U937, THP-1, and HEL non-CBF AML cells (supplemental Figure 10A). We then explored the biological effect of CBFA2T3. Given our finding that CBFA2T3 is required for G1/S transition of CD34+ HSPCs (Figure 1E), we focused on regulation of cell cycle inhibitor p21 and cell proliferation by CBFA2T3. The ChIP-Seq results were first confirmed by showing that CBFA2T3 bound to the p21 gene promoter in multiple AML cell types, including U937 and Kasumi-1 (supplemental Figure 10B). Depletion of CBFA2T3 in U937, THP-1, and HEL non-CBF AML cells upregulated p21 expression (Figure 4A), arrested cell growth, and inhibited G1/S transition (Figure 4B-D). We also examined the effect of CBFA2T3 depletion on in vivo expansion of U937 cells using an NSG xenograft model. Depleting CBFA2T3 dramatically reduced U937 cell expansion in the bone marrow and markedly extended the survival of the transplanted mice (Figure 4E-F). We concluded that CBFA2T3 plays a causal role in maintaining proliferation of AML cells in vitro and in vivo via regulating G1/S transition.
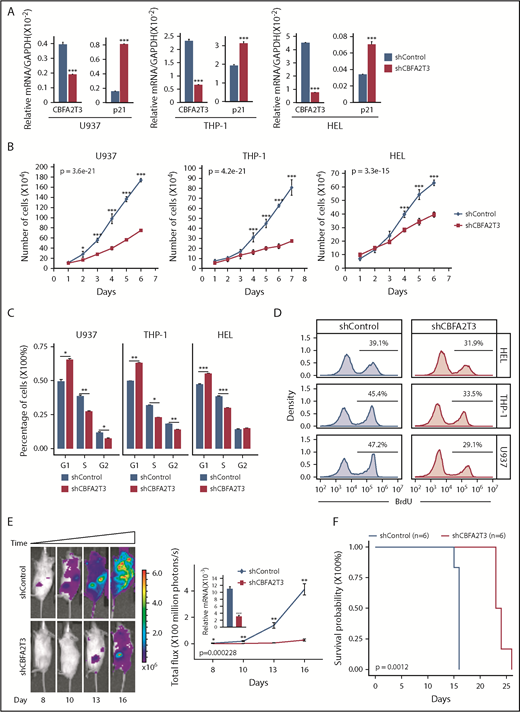
Effects of CBFA2T3 knockdown on p21 gene expression and the biological activities of non-t(8;21) AML cells. (A) CBFA2T3 RT-qPCR analyses showing effects of CBFA2T3 knockdown on p21 messenger RNA (mRNA) levels in the indicated AML cells. (B) Effects of CBFA2T3 knockdown on cell growth of the indicated AML cells. Cells were counted daily starting at 4 days after lentiviral transduction. (C) Flow cytometric, cell cycle quantification of control, and CBFA2T3-knockdown AML cells stained with propidium iodide. Error bars represent the standard error of 3 independent biological replicates. (D) BrdU incorporation and flow cytometry was used to independently confirm the G1/S block observed with propidium iodide staining. (E) Representative bioluminescence images (left, images are of the highest-signal mouse from each group) and average luminescence intensity (right) of control and CBFA2T3-depleted U937 cell-engrafted NSG mice over a period of 16 days. 1 × 10⁶ cells were transplanted into NSG mice 5 hours after radiograph radiation (2.25 Gy). (F) Survival of the control and CBFA2T3-depleted U937 cell-engrafted NSG mice described in panel E. *P < .05; **P < .01; ***P < .001. GAPDH, glyceraldehyde-3-phosphate dehydrogenase.
Effects of CBFA2T3 knockdown on p21 gene expression and the biological activities of non-t(8;21) AML cells. (A) CBFA2T3 RT-qPCR analyses showing effects of CBFA2T3 knockdown on p21 messenger RNA (mRNA) levels in the indicated AML cells. (B) Effects of CBFA2T3 knockdown on cell growth of the indicated AML cells. Cells were counted daily starting at 4 days after lentiviral transduction. (C) Flow cytometric, cell cycle quantification of control, and CBFA2T3-knockdown AML cells stained with propidium iodide. Error bars represent the standard error of 3 independent biological replicates. (D) BrdU incorporation and flow cytometry was used to independently confirm the G1/S block observed with propidium iodide staining. (E) Representative bioluminescence images (left, images are of the highest-signal mouse from each group) and average luminescence intensity (right) of control and CBFA2T3-depleted U937 cell-engrafted NSG mice over a period of 16 days. 1 × 10⁶ cells were transplanted into NSG mice 5 hours after radiograph radiation (2.25 Gy). (F) Survival of the control and CBFA2T3-depleted U937 cell-engrafted NSG mice described in panel E. *P < .05; **P < .01; ***P < .001. GAPDH, glyceraldehyde-3-phosphate dehydrogenase.
RUNX1-RUNX1T1 represses cell type–specific activation of CBFA2T3 gene transcription
If high-CBFA2T3 expression is important for relapse in AML (Figure 2A-B), then RUNX1-RUNX1T1–mediated repression of CBFA2T3 could represent a plausible mechanism for the favorable prognosis of t(8;21) AML. To test this theory, we extended our earlier finding that t(8;21) translocation is associated with downregulation of CBFA2T3 in AML (Figure 2D) by demonstrating a t(8;21)-specific downregulation of CBFA2T3 in multiple AML datasets (GSE14468, TARGET, TCGA, LEUCEGENE), occurring specifically to the NM_005187 isoform (Figure 5A-B). We also showed that unlike non-t(8;21) AML, the t(8;21) AML population was mostly enriched with patients expressing low CBFA2T3 in primary AML samples, in contrast to their high-level CD34 expression.
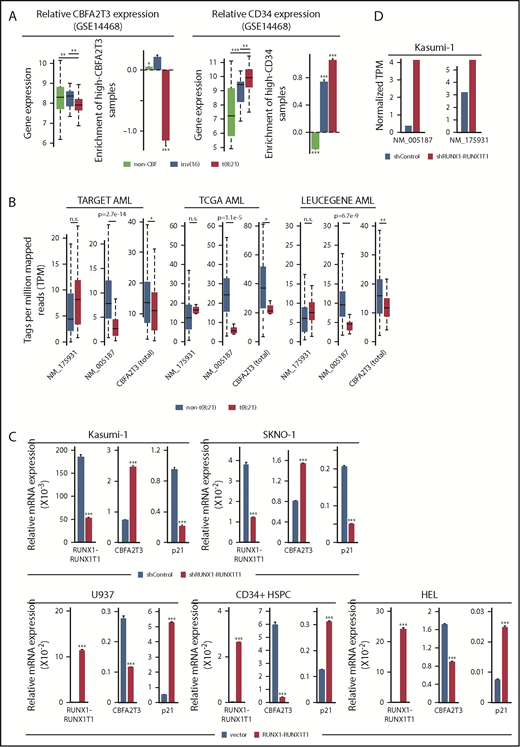
RUNX1-RUNX1T1 represses CBFA2T3 gene transcription. (A) Expression levels of CBFA2T3 (left) and CD34 (right) and relative enrichment (log2 transformed) of patients with AML expressing high CBFA2T3 (left) and high CD34 (right) within each of the indicated AML subtypes. High and low expression are relative to the median expression level in all patient samples (n = 526). (B) Expression levels of NM_005187, NM_175931, and total CBFA2T3 in t(8;21) and non-t(8;21) AML patients in AML datasets indicated at the top. Raw data were downloaded from NIH dbGaP (TARGET, TCGA) and SRA (LEUCEGENE) repositories. The Gene Expression Omnibus repository accession numbers for LEUCEGENE are GSE49642, GSE52656, GSE62190, GSE66917, and GSE67039. (C) RT-qPCR results showing effects of RUNX1-RUNX1T1 knockdown in Kasumi-1 and SKNO-1 cells and overexpression of RUNX1-RUNX1T1 in U937 cells, HSPCs, and HEL cells on CBFA2T3 expression. (D) Effect of RUNX1-RUNX1T1 knockdown on NM_005187 and NM_175931 levels in Kasumi-1 cells assayed by using RNA-Seq. *P < .05; **P < .01; ***P < .001.
RUNX1-RUNX1T1 represses CBFA2T3 gene transcription. (A) Expression levels of CBFA2T3 (left) and CD34 (right) and relative enrichment (log2 transformed) of patients with AML expressing high CBFA2T3 (left) and high CD34 (right) within each of the indicated AML subtypes. High and low expression are relative to the median expression level in all patient samples (n = 526). (B) Expression levels of NM_005187, NM_175931, and total CBFA2T3 in t(8;21) and non-t(8;21) AML patients in AML datasets indicated at the top. Raw data were downloaded from NIH dbGaP (TARGET, TCGA) and SRA (LEUCEGENE) repositories. The Gene Expression Omnibus repository accession numbers for LEUCEGENE are GSE49642, GSE52656, GSE62190, GSE66917, and GSE67039. (C) RT-qPCR results showing effects of RUNX1-RUNX1T1 knockdown in Kasumi-1 and SKNO-1 cells and overexpression of RUNX1-RUNX1T1 in U937 cells, HSPCs, and HEL cells on CBFA2T3 expression. (D) Effect of RUNX1-RUNX1T1 knockdown on NM_005187 and NM_175931 levels in Kasumi-1 cells assayed by using RNA-Seq. *P < .05; **P < .01; ***P < .001.
To directly test the ability of RUNX1-RUNX1T1 to inhibit CBFA2T3 gene expression, we depleted RUNX1-RUNX1T1 in Kasumi-1 and SKNO-1 t(8;21) AML cells and overexpressed RUNX1-RUNX1T1 in U937, HEL, and CD34+ HSPCs. Depleting RUNX1-RUNX1T1 upregulated CBFA2T3 and downregulated p21 in t(8;21) AML cells, whereas ectopic expression of RUNX1-RUNX1T1 in non-t(8;21) cells yielded the opposite effects (Figure 5C). Analysis of an RNA-Seq dataset9 from Kasumi-1 cells further confirmed that RUNX1-RUNX1T1 predominantly inhibits expression of the NM_005187 transcript (Figure 5D). Intriguingly, RUNX1-RUNX1T19a, a RUNX1-RUNX1T1 variant associated with poor prognosis in t(8;21) AML, had a reduced ability to downregulate CBFA2T3 and upregulate p21 (supplemental Figure 11).
GCN5 is responsible for cell-specific CBFA2T3 gene activation and is a target of RUNX1-RUNX1T1
Prompted by studies showing that RUNX1-RUNX1T1 represses gene transcription by inhibiting GCN5 recruitment to E proteins,9 we hypothesized that GCN5 is responsible for cell-specific CBFA2T3 gene transcription. Analyses of the paired datasets (GSE66525 and GSE83533) showed that relapse-associated changes of CBFA2T3 expression, especially that of NM_005187, were strongly correlated with expression changes of GCN5 (Figure 6A-B; supplemental Figure 12A) but not with expression changes of other E protein coactivators (p300/CBP/PCAF; data not shown). By analyzing a public dataset (ERP00393351 ), we further showed that pharmacologic inhibition of GCN5 downregulated CBFA2T3 while upregulating p21 in both non-t(8;21) NOMO-1 and t(8;21) Kasumi-1 AML cells (Figure 6C). We obtained similar results in Kasumi-1 and U937 cells by using another independent GCN5 inhibitor CPTH2 (data not shown). We also validated these results in primary AML cells with both MB-3 and CPTH2 GCN5 inhibitors (Figure 6D). Furthermore, high GCN5 expression was also associated with increased risk of AML relapse in a manner dependent on CBFA2T3 expression (supplemental Figure 12B). Finally, ChIP-Seq performed in Kasumi-1 cells indicated that RUNX1-RUNX1T1 inhibited both GCN5 binding and GCN5-dependent H3K9 acetylation at promoter regions of NM_005187, but not NM_175931 (Figure 6E-F; supplemental Figures 13 and 14), that encompass 2 binding sites of RUNX1-RUNX1T1/GCN5 (−71, −2021). Compared with GCN5, p300-binding and p300-dependent H3K18 acetylation were less dramatically affected by RUNX1-RUNX1T1. Further showing that GCN5 is important for CBFA2T3 gene transcription, inactivation of GCN5 by CPTH2 both reduced basal level CBFA2T3 expression and prevented upregulation of CBFA2T3 expression after RUNX1-RUNX1T1 depletion in Kasumi-1 cells (Figure 6G).
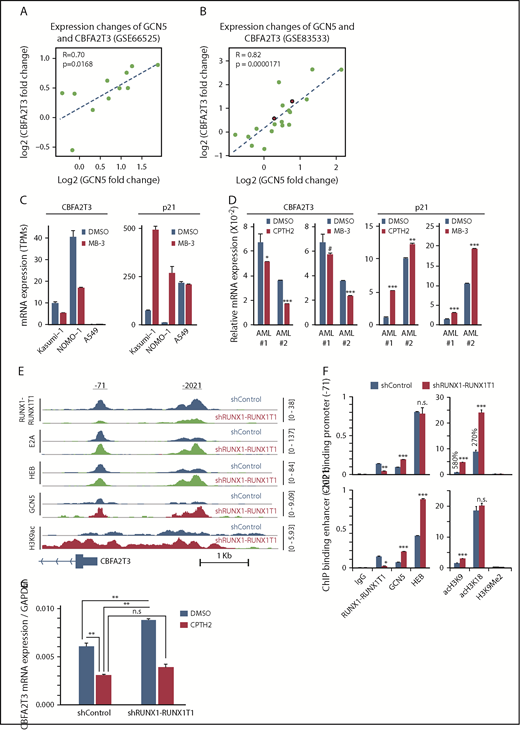
RUNX1-RUNX1T1 and GCN5 opposingly regulate CBFA2T3 transcription. Scatter plot showing fold changes of CBFA2T3 and GCN5 between primary and relapsed samples in both GSE66525 (A) and GSE83533 (B) patient cohorts. The red-colored dots in panel B denote 2 inv(16) patients. (C) Gene expression of CBFA2T3 and p21 in Kasumi-1, NOMO-1, and A549 cells treated with GCN5 inhibitor MB-3 vs dimethyl sulfoxide (DMSO). Results were analyzed from a public ERP003933 dataset.51 (D) RT-qPCR results showing the effects of CPTH2 and MB-3 treatment on CBFA2T3 and p21 expression in 2 primary AML patient samples. (E) ChIP-Seq intensities of RUNX1-RUNX1T1, HEB, E2A, GCN5, and acetyl-H3K9 at CBFA2T3 promoter sites in control (shControl) and RUNX1-RUNX1T1-depleted (shRUNX1-RUNX1T1) Kasumi-1 cells. (F) ChIP-qPCR quantification of the binding of the indicated proteins to −71 and −2021 CBFA2T3 regulatory loci in shControl and shRUNX1-RUNX1T1-treated Kasumi-1 cells. (G) RT-qPCR results of CBFA2T3 levels in control and RUNX1-RUNX1T1-knockdown Kasumi-1 cells with and without CPTH2 treatment. #P < .1, *P < .05, **P < .01; ***P < .001.
RUNX1-RUNX1T1 and GCN5 opposingly regulate CBFA2T3 transcription. Scatter plot showing fold changes of CBFA2T3 and GCN5 between primary and relapsed samples in both GSE66525 (A) and GSE83533 (B) patient cohorts. The red-colored dots in panel B denote 2 inv(16) patients. (C) Gene expression of CBFA2T3 and p21 in Kasumi-1, NOMO-1, and A549 cells treated with GCN5 inhibitor MB-3 vs dimethyl sulfoxide (DMSO). Results were analyzed from a public ERP003933 dataset.51 (D) RT-qPCR results showing the effects of CPTH2 and MB-3 treatment on CBFA2T3 and p21 expression in 2 primary AML patient samples. (E) ChIP-Seq intensities of RUNX1-RUNX1T1, HEB, E2A, GCN5, and acetyl-H3K9 at CBFA2T3 promoter sites in control (shControl) and RUNX1-RUNX1T1-depleted (shRUNX1-RUNX1T1) Kasumi-1 cells. (F) ChIP-qPCR quantification of the binding of the indicated proteins to −71 and −2021 CBFA2T3 regulatory loci in shControl and shRUNX1-RUNX1T1-treated Kasumi-1 cells. (G) RT-qPCR results of CBFA2T3 levels in control and RUNX1-RUNX1T1-knockdown Kasumi-1 cells with and without CPTH2 treatment. #P < .1, *P < .05, **P < .01; ***P < .001.
CBFA2T3 is required for maintaining LSC gene signatures and proliferation of t(8;21) AML cells
To explore the causal importance of CBFA2T3 in t(8;21) AML cells, we depleted CBFA2T3 in Kasumi-1 and SKNO-1 cells, both of which were derived from relapsed t(8;21) patients.52,53 AmpliSeq performed in control cells and CBFA2T3-depleted Kasumi-1 cells showed that depleting CBFA2T3 downregulated cis-actome genes (eg, JUP, BCL2) while upregulating cis-repressome genes (eg, p21, IFNGR2, TYROBP) (Figure 7A). We observed similar effects with SKNO-1 t(8;21) AML cells (supplemental Figure 15A). GSEA pathway analysis showed that depleting CBFA2T3 diminished LSC gene signatures of Kasumi-1 cells (Figure 7B). Further studies showed that loss of LSC signatures after CBFA2T3 depletion is a general feature of AML cells. Thus, depleting CBFA2T3 in SKNO-1 and U937 AML cells similarly downregulated LSC genes and upregulated non-LSC genes (supplemental Figure 15B), consistent with our earlier observed association between CBFA2T3 expression and LSC gene signatures in primary AML samples (supplemental Figure 1D).
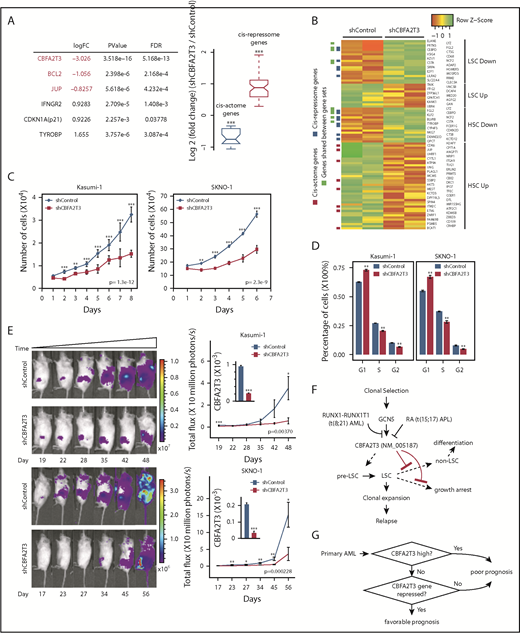
Depletion of CBFA2T3 diminishes LSC gene signatures and in vivo expansion of Kasumi-1 cells. (A) Expression changes of CBFA2T3 cis-actome and cis-repressome genes in CBFA2T3-depleted vs control cells. The boxplot at the right shows all significantly changed CBFA2T3 cis-actome and cis-repressome genes upon depletion of CBFA2T3 in Kasumi-1 cells (P ≤ .05). (B) Heatmap showing increased (green) or decreased (red) expression of genes within the HSC and LSC gene sets indicated at the right in duplicated control and CBFA2T3-knockdown samples. “LSC Up” denotes GAL_LEUKEMIC_STEM_CELL_UP; “LSC Down” denotes GAL_LEUKEMIC_STEM_CELL_DN; “HSC Up” denotes JAATINEN_HEMATOPOIETIC_STEM_CELL_UP; and “HSC Down” denotes JAATINEN_HEMATOPOIETIC_STEM_CELL_DN. CBFA2T3 cis-actome and cis-repressome genes, as well as genes in multiple affected pathways, are marked on the left. (C) Effects of CBFA2T3 knockdown on cell growth of the indicated AML cells. Cells were counted daily starting at 4 days after lentiviral transduction. (D) Flow cytometric, cell cycle quantification of control and CBFA2T3-knockdown t(8;21)-AML cells stained with propidium iodide. Error bars represent the standard error of 3 independent biological replicates. (E) Representative bioluminescence images (left) and average luminescence intensity (right) of control and CBFA2T3-depleted Kasumi-1 cells and SKNO-1 cells engrafted into NSGS (Kasumi-1) or NSG (SKNO-1) mice over the indicated period. 1 × 10⁶ SKNO-1 cells were transplanted into NSG mice 5 hours after radiograph radiation (2.25 Gy); 2.5 × 10⁶ Kasumi-1 cells were transplanted into NSGS mice 5 hours after radiograph radiation (2.5 Gy). (F) Proposed model of the interplay between CBFA2T3, GCN5, and RUNX1-RUNX1T1 in regulating LSC cell fate and AML relapse. The dashed line on the left denotes a possible role for CBFA2T3 in facilitating LSC transformation. The dashed lines on the right denote the abilities of CBFA2T3 to maintain LSCs and inhibit growth arrest, thus facilitating the expansion of LSCs that ultimately lead to relapse. (G) A 2-step classifier predicting AML patient prognosis. Details are given in “Discussion.” *P < .05; **P < .01; ***P < .001.
Depletion of CBFA2T3 diminishes LSC gene signatures and in vivo expansion of Kasumi-1 cells. (A) Expression changes of CBFA2T3 cis-actome and cis-repressome genes in CBFA2T3-depleted vs control cells. The boxplot at the right shows all significantly changed CBFA2T3 cis-actome and cis-repressome genes upon depletion of CBFA2T3 in Kasumi-1 cells (P ≤ .05). (B) Heatmap showing increased (green) or decreased (red) expression of genes within the HSC and LSC gene sets indicated at the right in duplicated control and CBFA2T3-knockdown samples. “LSC Up” denotes GAL_LEUKEMIC_STEM_CELL_UP; “LSC Down” denotes GAL_LEUKEMIC_STEM_CELL_DN; “HSC Up” denotes JAATINEN_HEMATOPOIETIC_STEM_CELL_UP; and “HSC Down” denotes JAATINEN_HEMATOPOIETIC_STEM_CELL_DN. CBFA2T3 cis-actome and cis-repressome genes, as well as genes in multiple affected pathways, are marked on the left. (C) Effects of CBFA2T3 knockdown on cell growth of the indicated AML cells. Cells were counted daily starting at 4 days after lentiviral transduction. (D) Flow cytometric, cell cycle quantification of control and CBFA2T3-knockdown t(8;21)-AML cells stained with propidium iodide. Error bars represent the standard error of 3 independent biological replicates. (E) Representative bioluminescence images (left) and average luminescence intensity (right) of control and CBFA2T3-depleted Kasumi-1 cells and SKNO-1 cells engrafted into NSGS (Kasumi-1) or NSG (SKNO-1) mice over the indicated period. 1 × 10⁶ SKNO-1 cells were transplanted into NSG mice 5 hours after radiograph radiation (2.25 Gy); 2.5 × 10⁶ Kasumi-1 cells were transplanted into NSGS mice 5 hours after radiograph radiation (2.5 Gy). (F) Proposed model of the interplay between CBFA2T3, GCN5, and RUNX1-RUNX1T1 in regulating LSC cell fate and AML relapse. The dashed line on the left denotes a possible role for CBFA2T3 in facilitating LSC transformation. The dashed lines on the right denote the abilities of CBFA2T3 to maintain LSCs and inhibit growth arrest, thus facilitating the expansion of LSCs that ultimately lead to relapse. (G) A 2-step classifier predicting AML patient prognosis. Details are given in “Discussion.” *P < .05; **P < .01; ***P < .001.
We next tested if our earlier observed ability of CBFA2T3 to maintain G1/S transition and proliferation of CD34+ HSPCs and AML cells is also applicable to t(8;21) AML cells. Depleting CBFA2T3 upregulated p21 expression, inhibited proliferation, and blocked G1/S transition of both Kasumi-1 and SKNO-1 t(8;21) AML cell lines (Figure 7C-D; supplemental Figure 15A). Furthermore, depleting CBFA2T3 markedly inhibited in vivo expansion of Kasumi-1 and SKNO-1 cells in bone marrow–transplanted mice (Figure 7E), possibly reflecting additive effects of losing LSC signatures and arresting cell proliferation. Along with results from non-t(8;21) AMLs, these studies collectively show that CBFA2T3 is generally required for proliferation and expansion of AML cells.
Discussion
The results from the current study support an important role of CBFA2T3 in relapse by maintaining LSC gene expression and proliferation (Figure 7F). LSCs may spontaneously lose their gene signatures as part of the differentiation process or may enter cell cycle arrest. Our results suggest that CBFA2T3 plays dual roles in preventing the occurrence of both processes, thereby promoting the expansion of LSCs toward relapse. Because we have shown that CBFA2T3 plays a similar role in CD34+ HSPCs, we speculate that CBFA2T3 may similarly expand HSCs/pre-LSCs to predispose these cells to additional mutations that result in LSC transformation. Given our finding that CBFA2T3-downregulated genes are also enriched with immune response and inflammatory functions, CBFA2T3 may also play a role in facilitating AML cells to escape immune surveillance, another process important for relapse. Future studies are needed to test this idea.
NM_005187 and NM_175931 isoforms encode similar CBFA2T3 proteins with identical NHR1-4, and both can be fused to RUNX1 in t(16;21) AML.54 Given that NM_005187, but not NM_175931, is adjacent to upstream enhancers (∼2 kb), we favor the idea that both isoforms contribute to total CBFA2T3 functions and that cell type–specific activation of NM_005187 in HSCs and LSCs is due to cell type–specific activation of enhancers as a result of increased recruitment of GCN5. Consistent with this idea, a genome-wide CRISPR-Cas9 dropout screen identified GCN5 as a coactivator uniquely required for proliferation and stemness of AML cells.51 Intriguingly, Salunkhe et al55 showed that GCN5 expression can be induced by doxorubicin, a chemotherapeutic drug, in AML cells, possibly reflecting a clonal selection process (Figure 7F). Furthermore, GCN5 cooperates with ATM to facilitate DNA repair and the onset of drug-resistant growth of leukemia cells.55 Our finding that GCN5 activates CBFA2T3 transcription points to dual roles for GCN5 in coupling DNA repair and gene transcription to promote relapse.
Our results suggest that 2 related factors associated with primary AML, the level of CBFA2T3 expression and the strength of ongoing repression of CBFA2T3/NM_005187, play important roles in AML patient prognosis (Figure 7G). We propose that a high likelihood of favorable prognosis requires both low-level CBFA2T3 expression and a mechanism for stable repression of CBFA2T3 transcription. Supporting this view, the less differentiated M0/M1 AML subtypes expressing high CBFA2T3 are associated with poor prognosis. Although the more differentiated M4/M5 AML subtypes express low CBFA2T3, they are also associated with poor prognosis compared with CBF AML. We now show that this paradoxical observation can be explained by a lack of repression mechanism for CBFA2T3 gene transcription in these cells, making CBFA2T3 transcription permissive to induction by GCN5. Intriguingly, although both M3 AML expressing PML-RAR and M7 AML expressing CBFA2T3-GLIS2 are highly aggressive and express high CBFA2T3 (Figure 2C-D) (data not shown),5 ATRA, which induces differentiation of PML-RAR, rapidly downregulates CBFA2T3 (Figure 2E). Low-level CBFA2T3 expression in t(8;21) AML is associated with favorable prognosis because it is indicative of functional repression of CBFA2T3 transcription by RUNX1-RUNX1T1 (Figure 7G). In contrast, t(8;21) AML expressing high CBFA2T3 has a fast relapse rate similar to that of non-CBF AML, because the high-level CBFA2T3 expression indicates that the t(8;21) AML cells have overcome RUNX1-RUNX1T1-mediated repression. Lastly, RUNX1-RUNX1T19a, a truncated variant of RUNX1-RUNX1T1 associated with poor prognosis and capable of inducing leukemia in mice,56,57 has a reduced ability to repress CBFA2T3 (supplemental Figure 11). In addition to t(8;21) AML, inv(16) CBF AML is also associated with favorable prognosis. Our preliminary study with the ME-1 inv(16) cells suggests that the corepressor function of CBFA2T3 may have been compromised in inv(16) AML cells, suggesting that CBFβ-MYH11 may similarly exert its beneficial effect by targeting the CBFA2T3-mediated relapse pathway. Because CBFA2T3 is functional in t(8;21) AML cells, a possible RUNX1-RUNX1T1–mediated direct interference of CBFA2T3 corepressor function may be compensated by a higher threshold level of CBFA2T3 expression that is needed to drive the relapse of t(8;21) AML.
ChIP-Seq results have been deposited in the Gene Expression Omnibus database (accession number GSE126953).
The full-text version of this article contains a data supplement.
Acknowledgments
The authors are grateful to Peter Valk who provided the clinical outcome data for patient samples in GSE14468. The authors acknowledge the use of TCGA, TARGET, and GSE83533 AML samples under dbGaP#9140 and #9730 managed by the National Cancer Institute/National Human Genome Research Institute/National Institutes of Health. They also acknowledge Karoly Toth for assistance with the IVIS image study, David Ford for the gifted THP-1 cell line, and Tom Burris for assistance with flow cytometry.
This work is supported by National Institutes of Health (NIH), National Heart, Lung, and Blood Institute grant R01HL093195 and NIH, National Cancer Institute grant R21CA178513 (J.Z.), a fund from Saint Louis University (J.Z.), and NIH, National Institute of General Medical Sciences grant T32GM008306-26A1 (N.S.).
Authorship
Contribution: N.S., C.G., M.W., and C.H. performed experiments and analyzed the results; C.H., Y.T., and C.E.F. provided patient samples; J.Z. conceived the original idea, analyzed the results, and wrote the first draft of the manuscript with assistance from coauthors; and all authors have read and approved the final submission.
Conflict-of-interest disclosure: The authors declare no competing interests.
Correspondence: Jinsong Zhang, Department of Pharmacology & Physiology, Saint Louis University School of Medicine, 1402 South Grand Blvd, St. Louis, MO 63104; e-mail: jinsong.zhang@health.slu.edu.

