

Key Points
Low-dose IL-2 selectively improves diversity of the CD4Treg TCR repertoire in patients with cGVHD.
Clinical response to IL-2 is associated with rapid turnover of the TCR repertoire and emergence of CD4Tregs with new TCR clonotypes.

Abstract
Patients with chronic graft-versus-host disease (cGVHD) have a paucity of regulatory CD4 T cells (CD4Tregs) that mediate peripheral tolerance. In clinical trials, daily low-dose interleukin-2 (IL-2) has been administered safely for prolonged periods in patients with steroid-refractory cGVHD. Peripheral CD4Tregs expand dramatically in all patients during IL-2 therapy but clinical improvement was observed in ∼50% of patients. Here, we examined the impact of low-dose IL-2 therapy on functional T-cell markers and the T-cell repertoire within CD4Tregs, conventional CD4 T cells (CD4Tcons), and CD8+ T cells. IL-2 had profound effects on CD4Tregs homeostasis in both response groups including selective expansion of the naive subset, improved thymic output, and increased expression of Ki67, FOXP3, and B-cell lymphoma 2 within CD4Tregs. Similar changes were not seen in CD4Tcons or CD8 T cells. Functionally, low-dose IL-2 enhanced, in vitro, CD4Treg-suppressive activity in both response groups, and all patient CD4Tcons were similarly suppressed by healthy donor CD4Tregs. High-throughput sequencing of the T-cell receptor β (TCRβ) locus demonstrated that low-dose IL-2 therapy increased TCR repertoire diversity and decreased evenness within CD4Tregs without affecting CD4Tcons or CD8 T cells. Using clone-tracking analysis, we observed rapid turnover of highly prevalent clones in CD4Tregs as well as the conversion of CD4Tcons to CD4Tregs. After 12 weeks of daily IL-2, clinical responders had a greater influx of novel clones within the CD4Treg compartment compared with nonresponders. Further studies to define the function and specificity of these novel CD4Treg clones may help establish the mechanisms whereby low-dose IL-2 therapy promotes immune tolerance.
Introduction
Chronic graft-versus-host disease (cGVHD) is the leading cause of nonrelapse morbidity and mortality following conventional allogeneic hematopoietic stem cell transplantation, occurring in 60% to 70% of adults and 20% to 50% of children surviving >100 days posttransplant.1-3 Previous studies have shown that patients with active cGVHD have poor reconstitution of regulatory CD4 T cells (CD4Tregs), which function to suppress autoreactive and alloreactive immune responses.4-8 Interleukin-2 (IL-2) is the primary homeostatic regulator of CD4Tregs in vivo and normally functions to support differentiation of CD4Tregs in the thymus as well as CD4Treg expansion in the periphery. IL-2 also promotes FOXP3 expression in CD4Tregs and enhances the regulatory functions of these cells.9,10 Importantly, CD4Tregs do not secrete IL-2 but constitutively express a high-affinity IL-2 receptor. This allows CD4Tregs to respond to low levels of IL-2 secreted by activated effector T cells. Previous clinical trials at our center demonstrated that daily administration of low-dose IL-2 for prolonged periods is safe, well tolerated, and leads to preferential in vivo expansion of CD4Tregs with a clinical response rate of 50% to 60% in patients with steroid-refractory cGVHD.11,12 Interestingly, all patients exhibited similar quantitative increases in circulating CD4Tregs even though only one-half of the patients had clinical improvement. We previously identified some predictors of clinical response, which included earlier IL-2 initiation (after transplantation and after cGVHD onset) and a higher ratio of CD4Tregs to conventional CD4 T cells (Treg:Tcon) at baseline and after week 1 of IL-2 therapy.11
In the present studies, we examined homeostatic and functional effects of IL-2 therapy to identify intrinsic T-cell factors that were associated with clinical improvement of cGVHD. Daily low-dose IL-2 led to preferential expansion of naive CD4Tregs and enhanced CD4Treg-suppressive function, but this did not distinguish response groups. We also performed T-cell receptor β (TCRβ) sequencing of CD4Tregs, CD4Tcons, and CD8 T cells and found that low-dose IL-2 increased diversity within CD4Tregs without affecting CD4Tcons or CD8 T cells. Notably, greater turnover of novel CD4Treg clones during IL-2 therapy was associated with a better clinical response.
Methods
Patients and sample collection
Samples used in this study were obtained from adult patients with steroid-refractory cGVHD enrolled in a phase 2 study of daily IL-2.11 Samples were also obtained from 24 healthy individuals. Patients and healthy donors (HDs) were enrolled in clinical research protocols approved by the Human Subjects Protection Committee of the Dana-Farber/Harvard Cancer Center. Written informed consent was obtained before sample collection, in accordance with the Declaration of Helsinki.
Flow cytometry analysis
Blood samples were obtained at: baseline; 1, 2, 4, 6, 8, and 12 weeks during IL-2; and every 8 weeks while receiving extended-duration IL-2. Using cell surface markers, CD4Tregs were defined as CD3+CD4+CD25med-highCD127low, CD4Tcons as CD3+CD4+CD25neg-lowCD127med-high, and CD8+ T cells as CD3+CD4−CD8+. Fifty microliters of whole blood (15% EDTA) was incubated with fluorophore-conjugated monoclonal antibodies as previously described.11 For intracellular marker analysis, CD4Tregs, CD4Tcons, and CD8 T cells were defined as CD3+CD4+Foxp3+, CD3+CD4+Foxp3−, and CD3+CD4−CD8+, respectively.7 Subsets within each population were defined as: naive T cells (CD45RA+CD62L+), central memory (CM; CD45RA−CD62L+), effector memory (EM; CD45RA−CD62L−), and CD8 effector memory RA/TEMRA T cells (CD8+CD45RA+CD62L−). Within CD4 T cells, coexpression of CD45RA and CD31 was used to define recent thymic emigrants (RTEs).13,14 Proliferation was measured by expression of Ki67.15 Susceptibility to apoptosis was assessed by intensity of intracellular expression of B-cell lymphoma 2 (BCL2).16 Cells were acquired in a FACSCanto II flow cytometer (BD Biosciences) and analyzed using FlowJo software (TreeStar). Gating and analysis strategies have been described previously.7
In vitro suppression assays
CD4+ T cells were isolated by negative selection with magnetic beads (Miltenyi Biotec). CD4Tregs and CD4Tcons were isolated by sorting for CD4+CD25+CD127− and CD4+CD25− cells, respectively. CD4Tcons were labeled with CellTrace Violet (Invitrogen) and stimulated with anti-CD3/CD28/CD2–coated beads (Treg Suppression Inspector, human; Miltenyi Biotec), and autologous or allogeneic CD4Tregs were added at a ratio of 1:1. After 4 days, cells were harvested and cell divisions of CD4Tcons were evaluated using flow cytometry. For allogeneic assays, all patient CD4Tregs were tested against the same HD CD4Tcons and all patient CD4Tcons were tested against the same HD CD4Tregs.
TCRβ repertoire analysis
Frozen peripheral blood mononuclear cells from 12 patients (6 clinical responders, 6 nonresponders) and 8 HDs were sorted into CD4Tregs, CD4Tcons, and CD8 T cells. Clinical characteristics of these patients are summarized in supplemental Table 2. Genomic DNA was extracted (Qiagen) from the purified populations; DNA amounts varied with cell type and time point (supplemental Table 1). Survey-level TCRβ sequencing was performed using the ImmunoSEQ platform with subsequent analysis using algorithms developed by Adaptive Biotechnologies.17 The Hill-based diversity profile and evenness indices were used for measures of TCRβ repertoire diversity.18 Diversity and evenness were first calculated with α ranging 1 through 10, followed by principal component analysis (PCA) on the profile. PCA uses an orthogonal transformation to convert a set of correlated diversity levels across all α levels into a set of linearly uncorrelated variables, called principal components (PC1, PC2, …PC10). This transformation is defined such that the first principal component (PC1) has the largest possible variance that accounts for most of the variability in the data. In this analysis, PC1 explained 95.5% variability in diversity and 88% in evenness. We therefore used PC1 for the analysis of diversity and evenness. All diversity levels were log2 transformed prior to PCA and a small weight was multiplied to diversity values in CD4Tregs only as the CD4Treg diversity was correlated with the DNA amount. The weight was (400 ng/the DNA amount in each sample)0.15, where 400 ng is the maximum amount of DNA. TCR overlap between samples was examined using the Jaccard index, defined as the size of the intersection divided by the size of the union of the sample sets.19
Statistical analysis
Data analysis was performed primarily descriptively. Phenotypic and functional data were compared using the exact Wilcoxon-rank-sum test for unpaired group comparison and the Wilcoxon-signed-rank test for paired comparison. Correlation analysis was performed using Pearson correlation coefficients. For missing samples at baseline, 1 or 12 weeks after IL-2 treatment in FOXP3 and BCL-2 expression levels, multiple imputation technique20 was used to impute the missing data under the assumption of missing at random. All tests were 2-sided at the significance level of 0.05 and multiple comparisons were not considered. All statistical analyses were performed using SAS version 9.4 (SAS Institute, Cary, NC) and R version 3.1.3 (the CRAN project).
Results
Changes in naive and memory T-cell subsets in response to low-dose IL-2
All evaluable patients in the previously reported phase 2 study, regardless of clinical response, exhibited expansion of peripheral blood CD4Tregs which peaked at 4 weeks. Increased Treg numbers were sustained above baseline throughout the initial 12 weeks of therapy and during extended-duration IL-2 therapy.11 Here, we examined changes in naive and memory subsets within the CD4Tregs, CD4Tcons, and CD8 T-cell populations during IL-2 therapy (Figure 1A-C). Prior to starting IL-2, patients with cGVHD had lower absolute numbers of circulating CD4Tregs but the proportion of naive CD4Tregs was similar compared with normal HDs (median, 9% vs 12.1%; P = .34) (Figure 1A). The proportion of EM CD4Tregs did not differ with HDs, but patients with cGVHD had a higher proportion of CM CD4Tregs compared with HDs (median, 61% vs 41.7%; P = .0005). Low-dose IL-2 initially led to expansion of the CM CD4Tregs at week 1. Naive CD4Treg expansion was evident by week 4, leading to a significant increase above baseline after 12 weeks of IL-2 therapy (median, 9% to 16.5%; P = .02), and achieving levels above HDs by 6 months of extended therapy (median, 22.2% vs 12.1%; P = .007). The absolute EM and CM CD4Treg cell counts peaked at week 2 and week 4, respectively, then decreased over time, but remained above baseline levels. In contrast, the absolute naive CD4Treg cell count continued to increase steadily (Figure 1A). Within the CD4Tcons and CD8 T cells, the fraction of naive cells in patients was similar to HDs at baseline and did not change significantly during IL-2 therapy (Figure 1B-C). Patients had a higher proportion of CM CD4Tcons than HDs (median, 29% vs 8%; P < .0001), and a lower proportion of EM CD8 T cells than HDs at baseline (median, 20% vs 32%; P = .006). These differences persisted throughout IL-2 therapy.

Impact of low-dose IL-2 on naive and memory T-cell compartments. Relative percentages of each subset are shown on the left and absolute (Abs.) cell numbers (cells per microliter) of each subset in the peripheral blood at each time point are shown on the right. Bar graphs on the left show the median percentage of each population and the corresponding median in HDs. Graphs on the right show median cell counts per microliter for each population and the corresponding median in HDs, with the interquartile range (whisker bars). Time points represent weeks (W) and months (M) after IL-2 initiation. Number of patients evaluated at each time point is indicated at the bottom of the image. (A) CD4Treg subsets. *P < .05, **P < .01, each time point was compared with baseline (W0), 2-sided Wilcoxon signed-rank test. (B) CD4Tcon subsets. (C) CD8+ T-cell subsets. (D) Proliferation marker (Ki67) expression in CD4Tregs. The percentage of Ki67+ cells within naive (orange) and memory (blue) CD4Tregs is shown for HDs and for patients at multiple time points after IL-2 initiation. Median values and the interquartile range (whisker bars) are shown at each time point.
Impact of low-dose IL-2 on naive and memory T-cell compartments. Relative percentages of each subset are shown on the left and absolute (Abs.) cell numbers (cells per microliter) of each subset in the peripheral blood at each time point are shown on the right. Bar graphs on the left show the median percentage of each population and the corresponding median in HDs. Graphs on the right show median cell counts per microliter for each population and the corresponding median in HDs, with the interquartile range (whisker bars). Time points represent weeks (W) and months (M) after IL-2 initiation. Number of patients evaluated at each time point is indicated at the bottom of the image. (A) CD4Treg subsets. *P < .05, **P < .01, each time point was compared with baseline (W0), 2-sided Wilcoxon signed-rank test. (B) CD4Tcon subsets. (C) CD8+ T-cell subsets. (D) Proliferation marker (Ki67) expression in CD4Tregs. The percentage of Ki67+ cells within naive (orange) and memory (blue) CD4Tregs is shown for HDs and for patients at multiple time points after IL-2 initiation. Median values and the interquartile range (whisker bars) are shown at each time point.
To determine whether expansion of CD4Tregs was simply due to increased proliferation of naive CD4Tregs, we examined Ki67 expression in the CD4Treg subsets. Low-dose IL-2 induced rapid proliferation of both memory and naive CD4Treg subsets with Ki67 expression peaking after 1 week (22% and 25% increase in Ki67+ cells from week 0 to week 1, respectively) (Figure 1D). The expansion of naive CD4Tregs observed after 4 weeks of IL-2 therapy was not associated with an increase in proliferation of this subset.
Naive CD4Tregs can be derived from thymic generation of new cells as well as through proliferation of circulating cells. To examine thymic production of naive CD4Tregs, we used coexpression of CD45RA and CD31 to identify RTEs.13,14 Low-dose IL-2 preferentially increased thymic output of CD4Tregs, but not of CD4Tcons (Figure 2). Although output of RTE CD4Tregs did not approach the HD range at any time during IL-2 therapy, increased numbers of circulating RTE CD4Tregs were detected after 2 weeks and remained elevated during extended therapy (Figure 2A). At 6 months, the percentage of RTE CD4Tregs increased to a median of 11.4% (P = .007 compared with patients at baseline and P = .001 compared with HDs). The percentage of RTE CD4Tcons remained stable throughout IL-2 therapy (Figure 2B). During the initial 12-week therapy period, clinical responders and nonresponders had similar increases in absolute CD4Treg, naive CD4Treg, and RTE CD4Treg counts (supplemental Figure 1).
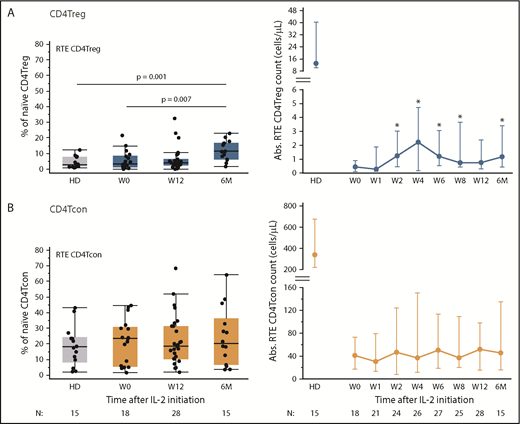
Impact of low-dose IL-2 on thymic production of CD4Tregs and CD4Tcons. Percentage of RTEs is shown on the left and absolute cell numbers (cells per microliter) in the peripheral blood at each time point are shown on the right. Box plots on the left depict the 75th percentile, median, and 25th percentile values; whiskers represent maximum and minimum values. Dots depict individual HDs or patients. Graphs on the right show median cell counts per microliter for each population and the corresponding median in HDs, with the interquartile range (whisker bars). Time points represent weeks (W) and months (M) after IL-2 initiation. Number of patients evaluated at each time point is indicated at the bottom of the image. (A) RTE CD4Tregs in patients (blue) and HDs (gray). *P < .05, absolute cell counts compared with baseline (baseline), 2-sided Wilcoxon signed-rank test. (B) RTE CD4Tcons in patients (orange) and HD (gray).
Impact of low-dose IL-2 on thymic production of CD4Tregs and CD4Tcons. Percentage of RTEs is shown on the left and absolute cell numbers (cells per microliter) in the peripheral blood at each time point are shown on the right. Box plots on the left depict the 75th percentile, median, and 25th percentile values; whiskers represent maximum and minimum values. Dots depict individual HDs or patients. Graphs on the right show median cell counts per microliter for each population and the corresponding median in HDs, with the interquartile range (whisker bars). Time points represent weeks (W) and months (M) after IL-2 initiation. Number of patients evaluated at each time point is indicated at the bottom of the image. (A) RTE CD4Tregs in patients (blue) and HDs (gray). *P < .05, absolute cell counts compared with baseline (baseline), 2-sided Wilcoxon signed-rank test. (B) RTE CD4Tcons in patients (orange) and HD (gray).
Cellular markers of CD4Treg function
We next examined expression of functional markers in CD4Tregs. Stable, high-level expression of FOXP3 is required for suppressive function whereas low expression levels are associated with decreased suppressive activity.21,22 At baseline, FOXP3 expression in CD4Treg subsets was similar in memory and naive CD4Tregs (Figure 3A). IL-2 therapy led to a rapid increase in FOXP3 expression, particularly in CM and EM CD4Tregs. At week 1, the median FOXP3 median fluorescence intensity (MFI) in CM CD4Tregs and EM CD4Tregs was higher than the median FOXP3 MFI in naive Tregs (P = .004 and P = .01, respectively). FOXP3 levels in CD4Treg subsets peaked between weeks 1 and 2 but remained above baseline levels during the entire 12-week treatment period (Figure 3A). Clinical responders and nonresponders had similar changes in FOXP3 expression from baseline to the peak at week 1 (Figure 3B).
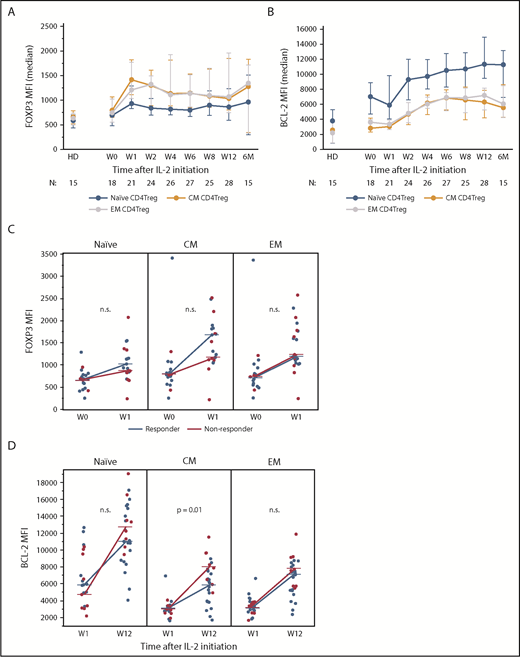
Expression of CD4Treg functional markers during IL-2 therapy. (A) FOXP3 expression in naive and memory CD4Treg subsets. (B) Increase in BCL-2 expression from week 1 (W1) to week 12 (W12) in clinical responders and nonresponders for naive and memory CD4Treg subsets. (C) Increase in FOXP3 expression from baseline (W0) to week 1 (W1) in clinical responders and nonresponders for naive and memory CD4Treg subsets. (D) BCL-2 expression in naive and memory CD4Treg subsets. (A-B) Median values and the interquartile range (whisker bars) are shown for each parameter. Time points represent weeks (W) and months (M) after IL-2 initiation. Number of patients evaluated at each time point is indicated at the bottom of the image. (C-D) Dots depict individual patients. Lines connect the median values at each time point. The Wilcoxon rank-sum test was used to compare responders vs nonresponders. n.s., not significant.
Expression of CD4Treg functional markers during IL-2 therapy. (A) FOXP3 expression in naive and memory CD4Treg subsets. (B) Increase in BCL-2 expression from week 1 (W1) to week 12 (W12) in clinical responders and nonresponders for naive and memory CD4Treg subsets. (C) Increase in FOXP3 expression from baseline (W0) to week 1 (W1) in clinical responders and nonresponders for naive and memory CD4Treg subsets. (D) BCL-2 expression in naive and memory CD4Treg subsets. (A-B) Median values and the interquartile range (whisker bars) are shown for each parameter. Time points represent weeks (W) and months (M) after IL-2 initiation. Number of patients evaluated at each time point is indicated at the bottom of the image. (C-D) Dots depict individual patients. Lines connect the median values at each time point. The Wilcoxon rank-sum test was used to compare responders vs nonresponders. n.s., not significant.
A previous study showed that IL-2 therapy led to increased levels of the antiapoptotic BCL-2 protein in CD4Tregs and enhanced resistance of these cells to apoptosis.23 Here, we found that BCL-2 expression levels were highest in naive CD4Tregs and lower in memory CD4Tregs in HDs and patients (Figure 3C). BCL-2 expression in all CD4Treg subsets increased 1 week after starting IL-2, peaked at week 12, and remained elevated during extended therapy. Clinical nonresponders had a higher increase in BCL-2 expression from week 1 to week 12 within the CM CD4Treg subset but no difference between response groups was seen within the naive or EM CD4Tregs (Figure 3D). There were no significant changes in BCL-2 expression over time in the CD4Tcon or CD8 T-cell subsets (data not shown).
Impact of low-dose IL-2 on in vitro CD4Treg function
To assess CD4Treg function more directly, we tested the ability of CD4Tregs to suppress the proliferation of stimulated CD4Tcons at study baseline and at week 6. Patient CD4Tregs were tested against both autologous CD4Tcons and HD CD4Tcons from the same HD control subject for all in vitro assays. At baseline, patient CD4Tregs had a decreased ability to suppress HD CD4Tcons compared with CD4Tregs from HD control subjects (Figure 4). CD4Tregs from patients suppressed HD CD4Tcon proliferation to a median of 58% compared with a median of 71% by HD CD4Tregs (P = .009). By week 6 of IL-2 therapy, patient CD4Treg-suppressive function improved and was indistinguishable from the HD CD4Tregs (P = .71). Significant improvement in Treg function was also observed in the autologous suppression assays using patient CD4Tregs and patient CD4Tcons, with suppression to a median of 44% at baseline and 74% at week 6 (P = .02). CD4Tcons from patients and HDs were similarly suppressed by HD CD4Tregs at baseline (P = .26) and at week 6 (P = .09), indicating that CD4Tcons from patients with cGVHD are not more resistant to suppression in this assay.
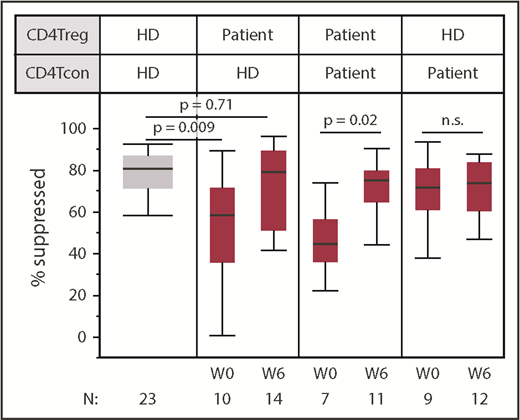
Low-dose IL-2 improves in vitro CD4Treg-suppressive activity. Suppressive activity of patient CD4Tregs was tested against HD CD4Tcons in vitro. Patient CD4Tregs were assessed at baseline (W0) and at week 6 (W6). In addition, the ability of HD CD4Tregs to suppress the proliferation of patient CD4Tcons was assessed at both time points. Box plots depict the 75th percentile, median, and 25th percentile values; whiskers represent maximum and minimum values, except for outliers. The box for HD is shaded in gray. P values comparing HD CD4Tregs to patient CD4Tregs are shown at week 0 and week 6. Patient CD4Treg suppression of patient CD4Tcons between baseline and week 6 and suppression of patient CD4Tcons by HD CD4Tregs at baseline and week 6 were also compared; 2-sided Wilcoxon signed-rank test. Number of patients evaluated at each time point is indicated at the bottom of the image. For the HD control column, N represents the number of assays using cells from the same HD.
Low-dose IL-2 improves in vitro CD4Treg-suppressive activity. Suppressive activity of patient CD4Tregs was tested against HD CD4Tcons in vitro. Patient CD4Tregs were assessed at baseline (W0) and at week 6 (W6). In addition, the ability of HD CD4Tregs to suppress the proliferation of patient CD4Tcons was assessed at both time points. Box plots depict the 75th percentile, median, and 25th percentile values; whiskers represent maximum and minimum values, except for outliers. The box for HD is shaded in gray. P values comparing HD CD4Tregs to patient CD4Tregs are shown at week 0 and week 6. Patient CD4Treg suppression of patient CD4Tcons between baseline and week 6 and suppression of patient CD4Tcons by HD CD4Tregs at baseline and week 6 were also compared; 2-sided Wilcoxon signed-rank test. Number of patients evaluated at each time point is indicated at the bottom of the image. For the HD control column, N represents the number of assays using cells from the same HD.
Patient CD4Treg suppression of HD CD4Tcons did not differ between response groups at baseline (P = .55), and both groups showed improved function at week 6. During extended therapy, CD4Treg-suppressive function remained stable without significant change between week 6 and 6 months of IL-2 therapy (supplemental Figure 2). Similarly, low-dose IL-2 did not alter the ability of patient CD4Tcons to be suppressed by HD CD4Tregs at week 6 or after 6 months.
Impact of low-dose IL-2 therapy on TCR repertoire diversity
Quantitative studies of the TCR repertoire have led to important insights into immune reconstitution and development of GVHD after hematopoietic stem cell transplantation.24-29 We examined the effect of low-dose IL-2 therapy on the TCRβ repertoire of purified CD4Tregs, CD4Tcons, and CD8 T cells in serial blood samples from 6 clinical responders and 6 nonresponders. We first compared TCR diversity between samples using the Hill-based diversity profile,18 in which higher values indicate a more diverse distribution of TCRβ sequences. Consistent with previous reports,25,28,30 we found that CD8 T cells had lower diversity compared with CD4Tregs and CD4Tcons both in HDs (P = .008) and in patients (P ≤ .006 for baseline and week 12; P = .03 at 1 year) (Figure 5A). In baseline patient samples, diversity was lower in CD4Tregs compared with HDs (P = .025) but not statistically different in CD4Tcons (P = .18) and CD8 T cells (P = .12). After 12 weeks of IL-2 therapy, CD4Treg diversity increased and was indistinguishable from HDs (P = .31) whereas diversity did not change within CD4Tcons and CD8 T cells. CD4Treg diversity increased to similar extents in both response groups, although this comparison was limited by lower amounts of DNA input for CD4Treg samples in clinical responders (supplemental Table 1). We also examined evenness, which represents the extent of clonal expansion of the TCR repertoire by scaling the diversity index to the number of unique TCR clones.18 High values of evenness indicate that all clones within the population are present at equal frequencies whereas lower values indicate an unequal distribution of clonal frequencies. IL-2 therapy led to significantly decreased evenness in CD4Tregs (P = .04 from baseline to week 12) but did not affect CD4Tcons or CD8 T cells (Figure 5B). Together, these observations suggest that low-dose IL-2 therapy both diversifies the clonal composition of CD4Tregs and leads to selective expansion of individual clones.
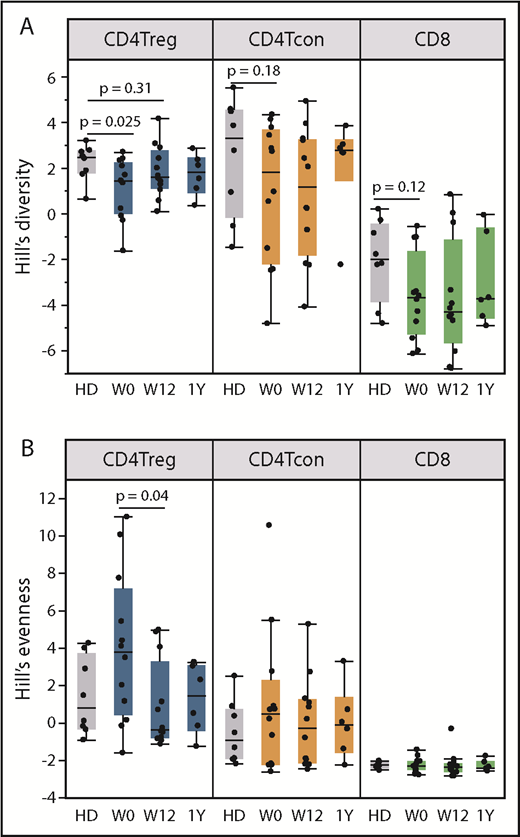
TCR repertoire diversity and evenness in patients receiving low-dose IL-2 and HDs. For patients, diversity measurements were assessed at baseline (W0), week 12 (W12), and 1 year (1Y). (A) Hill-based diversity values for CD4Tregs, CD4Tcons, and CD8 T cells in patients with cGVHD (n = 12) and HDs (n = 8). In HDs, CD8 T cells have lower diversity than CD4Tregs (P = .008) and CD4Tcons (P = .008). In patients, CD8 T cells have lower diversity than CD4Tregs and CD4Tcons at baseline (P ≤ .001), week 12 (P ≤ .001), and 1 year (P = .03). Diversity in CD4Tcons and CD8 T cells is similar in patients compared with HDs and does not change with IL-2 therapy. Diversity in CD4Tregs is lower in patients than in HD at baseline (P = .019) but is similar to HDs at week 12 (P = .2). (B) Hill evenness values for CD4Tregs, CD4Tcons, and CD8 T cells in patients with cGVHD and HDs. Evenness is similar between HDs and patients at baseline in CD4Tcons and CD8 T cells and does not change with IL-2 therapy. In CD4Tregs, evenness is also similar between HDs and patients at baseline. However, within patients, evenness in CD4Tregs decreases significantly from baseline to week 12 (P = .04). (A-B) Each dot represents an individual patient. Box plots depict the 75th percentile, median, and 25th percentile values; whiskers represent maximum and minimum values, except for outliers. The boxes for HD are shaded in gray. Two-sided Wilcoxon signed-rank test was used to assess significance.
TCR repertoire diversity and evenness in patients receiving low-dose IL-2 and HDs. For patients, diversity measurements were assessed at baseline (W0), week 12 (W12), and 1 year (1Y). (A) Hill-based diversity values for CD4Tregs, CD4Tcons, and CD8 T cells in patients with cGVHD (n = 12) and HDs (n = 8). In HDs, CD8 T cells have lower diversity than CD4Tregs (P = .008) and CD4Tcons (P = .008). In patients, CD8 T cells have lower diversity than CD4Tregs and CD4Tcons at baseline (P ≤ .001), week 12 (P ≤ .001), and 1 year (P = .03). Diversity in CD4Tcons and CD8 T cells is similar in patients compared with HDs and does not change with IL-2 therapy. Diversity in CD4Tregs is lower in patients than in HD at baseline (P = .019) but is similar to HDs at week 12 (P = .2). (B) Hill evenness values for CD4Tregs, CD4Tcons, and CD8 T cells in patients with cGVHD and HDs. Evenness is similar between HDs and patients at baseline in CD4Tcons and CD8 T cells and does not change with IL-2 therapy. In CD4Tregs, evenness is also similar between HDs and patients at baseline. However, within patients, evenness in CD4Tregs decreases significantly from baseline to week 12 (P = .04). (A-B) Each dot represents an individual patient. Box plots depict the 75th percentile, median, and 25th percentile values; whiskers represent maximum and minimum values, except for outliers. The boxes for HD are shaded in gray. Two-sided Wilcoxon signed-rank test was used to assess significance.
TCRβ clone tracking during IL-2 therapy
To measure turnover of individual T-cell clones, we focused on the 1000 most abundant productive TCRβ clones present within each cell type after 12 weeks of IL-2 therapy and asked whether these dominant clones were also detected at baseline. We also examined samples taken 12 weeks apart from an HD (Figure 6A). In the HD, the correlation coefficients between the productive frequencies of the top 1000 clones at the 2 time points were high within all 3 cell types, indicating a low level of clonal turnover during this 12-week interval. In patients receiving IL-2, the correlation coefficients between the productive frequencies of the 1000 most abundant week 12 clones and productive frequencies at baseline (week 0) were significantly lower within CD4Tregs compared with CD8 T cells and CD4Tcons (Figure 6A). This suggests that IL-2 therapy preferentially leads to higher clonal turnover in CD4Tregs. Using clone tracking, a median of 14% (range, 3% to 51%) of the most prevalent CD4Treg clones at week 12 were detected at baseline compared with 38.5% (range, 7% to 75%) of the top 1000 CD4Tcon clones and 36.5% (range, 12% to 90%) of CD8 clones. When examined by response group, clinical responders at week 12 had a significantly higher proportion of clones derived from clones that were not detected at baseline compared with nonresponders in CD4Tregs (P = .04) (Figure 6B). There were no differences between response groups for CD4Tcons and CD8 T cells. These results suggest that greater expansion of novel or low frequency clones within the CD4Treg fraction during IL-2 therapy is associated with a better clinical response.
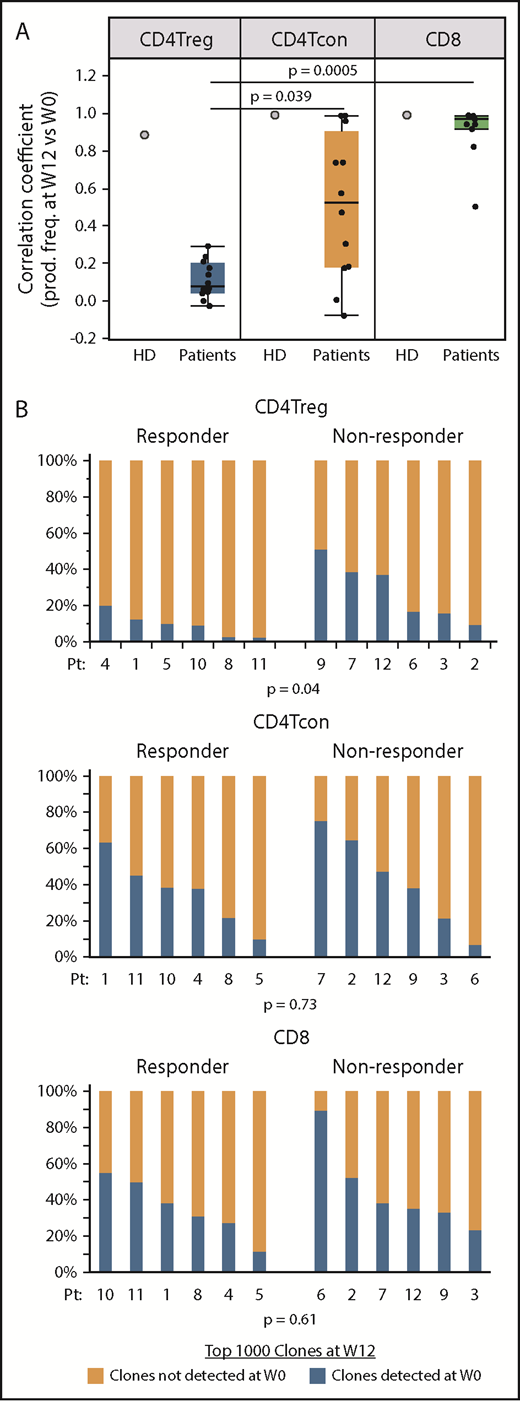
Origin of dominant clones within each T-cell subset at week 12 of IL-2 therapy. (A) Correlation coefficients between the productive frequencies of the top 1000 clones at week 12 and the productive frequencies of the same clones at baseline (week 0) for each cell type are shown for an HD (gray filled circles) and patients (black dots). Each dot represents the correlation coefficient for an individual patient. Box plots depict the 75th percentile, median, and 25th percentile values; whiskers represent maximum and minimum values, except for outliers. The correlation coefficients for CD4Tregs were significantly lower than for CD4Tcons (P = .039) and CD8 T cells (P = .0005). (B) Origin of the dominant 1000 clones at week 12 (W12) in clinical responders (n = 6; patients 1, 4, 5, 8, 10, 11) vs nonresponders (n = 6, patients 2, 3, 6, 7, 9, 11). For each cell type, bar graphs show the percentage of dominant week 12 clones that were detected (blue) at baseline (W0) and the percentage of dominant week 12 clones that were not detected (orange) at baseline. Each column represents an individual patient. Two-sided Wilcoxon signed-rank test was used to assess significance.
Origin of dominant clones within each T-cell subset at week 12 of IL-2 therapy. (A) Correlation coefficients between the productive frequencies of the top 1000 clones at week 12 and the productive frequencies of the same clones at baseline (week 0) for each cell type are shown for an HD (gray filled circles) and patients (black dots). Each dot represents the correlation coefficient for an individual patient. Box plots depict the 75th percentile, median, and 25th percentile values; whiskers represent maximum and minimum values, except for outliers. The correlation coefficients for CD4Tregs were significantly lower than for CD4Tcons (P = .039) and CD8 T cells (P = .0005). (B) Origin of the dominant 1000 clones at week 12 (W12) in clinical responders (n = 6; patients 1, 4, 5, 8, 10, 11) vs nonresponders (n = 6, patients 2, 3, 6, 7, 9, 11). For each cell type, bar graphs show the percentage of dominant week 12 clones that were detected (blue) at baseline (W0) and the percentage of dominant week 12 clones that were not detected (orange) at baseline. Each column represents an individual patient. Two-sided Wilcoxon signed-rank test was used to assess significance.
The greatest influx of new clones within CD4Tregs occurred in the first 12 weeks of therapy as TCR overlap between the week 12 and 1-year time points was higher than the overlap between baseline and week 12 (supplemental Figure 3A). Among patients who received extended-duration therapy, a median of 9.5% (range, 3% to 20%) of the dominant CD4Treg clones at week 12 was shared with the baseline population, whereas a median of 34% (range, 12% to 57%) of the dominant CD4Treg clones after 1 year of IL-2 therapy was shared with the week 12 population (P = .03) (supplemental Figure 3B).
Peripheral conversion of CD4Tcons to CD4Tregs during IL-2 therapy
The frequent detection of new CD4Treg clones after 12 weeks of IL-2 therapy is consistent with the observation that daily low-dose IL-2 increased CD4Treg diversity as well as the number of naive and RTE CD4Tregs. Another potential source of new CD4Treg clonotypes is through peripheral conversion of CD4Tcons into CD4Tregs.31 To address this possibility, we compared the TCR overlap between productive CD4Treg and CD4Tcon sequences. At baseline, the TCR overlap (Jaccard index) between CD4Tregs and CD4Tcons was low in both patients and HDs (Figure 7A). After 12 weeks of IL-2 therapy, the CD4Treg-CD4Tcon overlap index increased above the baseline level (P = .03) whereas there was no change in the CD4Treg-CD8 T-cell overlap. We performed a similar analysis using samples taken 12 weeks apart from an HD and found that CD4Treg-CD4Tcon TCR overlap did not increase (supplemental Figure 4). In all patients, we identified individual CD4Treg clones at week 12 that were detected exclusively in the baseline (week 0) CD4Tcon population (Figure 7B), further supporting the conversion of CD4Tcons into CD4Tregs during IL-2 therapy. However, the calculated TCR overlap index between week 0 CD4Tcon and week 12 CD4Treg samples increased in only some patients (supplemental Figure 5A). Thus, although IL-2 treatment enhances peripheral conversion of CD4Tcons into CD4Tregs, it likely remains a low frequency event. Conversion of CD4Tregs to CD4Tcons occurs to a lesser extent as we could also detect clones within the week 12 CD4Tcon population that were shared exclusively with baseline CD4Tregs (Figure 7B). As expected, there was almost no clone sharing between the CD4Treg and CD8 T-cell populations. There were no differences in CD4Treg-CD4Tcon clone sharing or TCR overlap between response groups (supplemental Figure 5B-C).
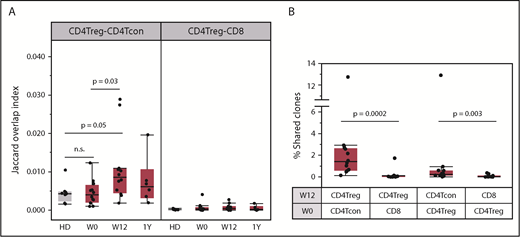
Clone sharing between different T-cell populations. (A) TCR overlap (Jaccard overlap index) between CD4Treg and CD4Tcon repertoires at baseline (W0), week 12 (W12), and 1 year (1Y). Overlap in HDs (gray) is shown for comparison. (B) Percentage of the total unique clones at week 12 (W12) that were detected within different baseline (W0) populations. Each column shows the percentage of week 12 clones within the various cell types that are exclusively shared with a particular baseline population. For example, the first column on the left shows the percentage of week 12 CD4Tregs clones shared exclusively with the baseline CD4Tcon population. There is significantly higher clone sharing between CD4Tregs and CD4Tcons than between CD4Tregs and CD8 T cells. In both panels, each dot represents a patient (n = 12) or an HD (n = 8). Box plots depict the 75th percentile, median, and 25th percentile values; whiskers represent maximum and minimum values, except for outliers. Two-sided Wilcoxon signed-rank test was used to assess significance between the different combinations.
Clone sharing between different T-cell populations. (A) TCR overlap (Jaccard overlap index) between CD4Treg and CD4Tcon repertoires at baseline (W0), week 12 (W12), and 1 year (1Y). Overlap in HDs (gray) is shown for comparison. (B) Percentage of the total unique clones at week 12 (W12) that were detected within different baseline (W0) populations. Each column shows the percentage of week 12 clones within the various cell types that are exclusively shared with a particular baseline population. For example, the first column on the left shows the percentage of week 12 CD4Tregs clones shared exclusively with the baseline CD4Tcon population. There is significantly higher clone sharing between CD4Tregs and CD4Tcons than between CD4Tregs and CD8 T cells. In both panels, each dot represents a patient (n = 12) or an HD (n = 8). Box plots depict the 75th percentile, median, and 25th percentile values; whiskers represent maximum and minimum values, except for outliers. Two-sided Wilcoxon signed-rank test was used to assess significance between the different combinations.
Discussion
Previous studies have demonstrated that administration of low-dose IL-2 leads to the rapid increase in peripheral CD4Tregs with little, if any, effect on CD4Tcons or CD8 T cells. We have observed this in patients with steroid-refractory cGVHD and others have seen similar effects in patients with various autoimmune diseases as well as in healthy volunteers.11,12,32-37 In our studies, clinical responses were documented in ∼50% of patients with steroid-refractory cGVHD even though all patients experienced similar increases in absolute numbers of circulating CD4Tregs. To examine this discrepancy between immunologic and clinical responses, we performed a detailed phenotypic and functional characterization of CD4Tregs in serial samples obtained from patients with cGVHD receiving low-dose IL-2 enrolled on a phase 2 clinical trial.11
We found that low-dose IL-2 selectively induced several dramatic changes in CD4Tregs. These changes reflect the critical role of IL-2 in CD4Treg homeostasis that has previously been demonstrated in murine models.38-40 The earliest effect we observed was the rapid proliferation of CM and EM CD4Tregs. This was followed by a more gradual increase in naive CD4Tregs that resulted in part from increased thymic output. IL-2 also induced significant functional effects in CD4Tregs including increased expression of BCL-2 and FOXP3 and enhanced in vitro suppressive activity. Importantly, these changes occurred in clinical nonresponders as well as responders, suggesting that clinical resistance was not because of CD4Treg resistance to the functional and homeostatic effects of IL-2.
Our studies are limited by the number of assays available to measure different CD4Treg functions in vitro. For example, the standard assay used to examine CD4Treg function only measures the ability of CD4Tregs to inhibit proliferation of stimulated CD4Tcons. This likely reflects the ability of CD4Tregs to sequester IL-2 secreted by activated CD4Tcons but does not examine other suppressive mechanisms potentially used by CD4Tregs in vivo. Furthermore, we could only perform our analyses on circulating T-cell populations and did not have access to the target tissues affected by cGVHD. We could not examine the functional activity of tissue-resident CD4Treg or CD4Treg homing to sites of cGVHD inflammation and injury. Although the effects of low-dose IL-2 have been characterized most extensively within CD4Tregs, IL-2 also leads to quantitative and qualitative changes in other cell types including natural killer cells and T follicular helper cells.41 Further studies are needed to determine whether differences in natural killer and T follicular helper cells in patients receiving IL-2 therapy impact clinical response.
Quantitative assessment of the TCR repertoire provides another tool for investigating T-cell function and the impact of low-dose IL-2 therapy.42 Using high-throughput TCRβ sequencing, we examined the TCR repertoire of highly purified CD4Tregs, CD4Tcons, and CD8 T cells. At baseline, patients with cGVHD had significantly lower TCR diversity within CD4Tregs compared with HDs. Low-dose IL-2 increased diversity within CD4Tregs to HD levels after 12 weeks of therapy. TCR diversity within CD4Tcons and CD8 T cells was similar between patients and HDs at baseline and did not change with IL-2. Our analysis is limited by the semiquantitative nature of the ImmunoSEQ platform17,43 and by the low DNA input from CD4Treg samples.
IL-2 therapy increased TCR diversity while decreasing TCR evenness within CD4Tregs during the same period, suggesting expansion of specific CD4Treg clones. We further examined the expansion and contraction of clonotypes during IL-2 therapy by tracking the most abundant TCRβ sequences in serial samples. In contrast to CD4Tcons and CD8 T cells where there was very little change in clonotypes over time, low-dose IL-2 induced rapid and extensive turnover of individual CD4Treg clones. Notably, expansion of CD4Treg clones that were not detectable at baseline occurred more frequently in clinical responders compared with clinical nonresponders after 12 weeks of IL-2 therapy. By tracking individual T-cell clones from baseline to week 12, we also demonstrated that at least some CD4Treg clones that expanded during IL-2 therapy were recruited from the baseline CD4Tcon population. Thus, the increase in CD4Treg diversity during IL-2 therapy appears to be derived not only from new clones emerging from the thymus and expansion of low-frequency clones, but also from peripheral conversion of CD4Tcons to CD4Tregs. These findings imply that expansion of multiple antigen-specific CD4Treg clones plays an important role in the reversal of cGVHD symptoms and suggests a mechanistic basis for clinical improvement in these patients.
In summary, low-dose IL-2 therapy had profound effects on CD4Treg homeostasis and function in all patients regardless of clinical response. Clinical improvement was associated with the rapid turnover of the TCR repertoire and emergence of CD4Tregs with new TCR clonotypes. These findings are consistent with the observation that CD4Tregs with a monoclonal TCR can suppress diverse effector T-cell populations and can prevent lethal autoimmunity in murine models.44 Further studies to identify the specific antigens recognized by expanded CD4Tregs may help explain the mechanisms whereby low-dose IL-2 therapy mediates clinical reversal of cGVHD. Characterization of these CD4Treg TCRs and their target antigens may also lead to the development of CD4Treg-based cellular therapies that can induce tolerance and suppress activated immune effector cells. Such therapies will be relevant for the application of low-dose IL-2 in autoimmune diseases as well as in cGVHD.
The full-text version of this article contains a data supplement.
Acknowledgments
This work was supported by National Institutes of Health, National Cancer Institute grants R01CA183559, R01CA183560, and P01CA142106; Prometheus Laboratories Inc; and the Ted & Eileen Pasquarello Research Fund.
Authorship
Contribution: J.S.W., S.N., J.K., and J.R. conceived and designed the study; J.K., E.P.A., P.A., C.S.C., V.T.H., J.H.A., and R.J.S. provided patients; J.S.W., S.N., A.C.A., B.F., S.K., K.D., M.J.F., and C.G.R. collected and assembled data; H.T.K. analyzed and interpreted data and performed statistical analysis; and all authors wrote the manuscript.
Conflict-of-interest disclosure: J.K. reports research funding from Prometheus Laboratories Inc, Millennium Pharmaceuticals Inc, and Miltenyi Biotec GmbH; consulting fees from Amgen, Equillium, and Fortress Biotech; and advisory board fees from Takeda Pharmaceuticals Inc and Kadmon Corp. P.A. reports research funding from Bristol-Myers Squibb, Merck, Affimed, Adaptive, Roche, Tensha, Otsuka, and Sigma Tau; and consulting fees from Bristol-Myers Squibb, Merck, Infinity, Pfizer, and Affimed. J.R. reports research funding from Prometheus Laboratories, Neovii Biotech, Nektar, Merck, and Kite Pharma; and consulting income from Celgene, Avrobio, LifeVault Bio, Draper Laboratory, and TScan Therapeutics. The remaining authors declare no competing financial interests.
Correspondence: Jerome Ritz, Dana-Farber Cancer Institute, 450 Brookline Ave, M530, Boston, MA 02215; e-mail: jerome_ritz@dfci.harvard.edu.

