

Key Points
Whole-exome sequencing allows simultaneous identification of recombined TCRα, TCRβ, and TCRγ sequences and their expression.
Tumor cell percentage calculated using exome data eliminates the need for arbitrary thresholds for reactive T-cell contamination in samples.

Abstract
Mycosis fungoides (MF), the most common type of cutaneous T-cell lymphoma, is believed to represent a clonal expansion of a transformed skin-resident memory T cell. T-cell receptor (TCR) clonality (ie, identical sequences of rearranged TCRα, TCRβ, and TCRγ), the key premise of this hypothesis, has been difficult to document conclusively because malignant cells are not readily distinguishable from the tumor-infiltrating reactive lymphocytes that contribute to the TCR clonotypic repertoire of MF. Here, we have successfully adopted targeted whole-exome sequencing (WES) to identify the repertoire of rearranged TCR genes in tumor-enriched samples from patients with MF. Although some of the investigated MF biopsies had the expected frequency of monoclonal rearrangements of TCRγ corresponding to that of tumor cells, the majority of the samples presented multiple TCRγ, TCRα, and TCRβ clonotypes by WES. Our findings are compatible with the model in which the initial malignant transformation in MF does not occur in mature memory T cells but rather at the level of T-lymphocyte progenitors before TCRβ or TCRα rearrangements. We have also shown that WES can be combined with whole-transcriptome sequencing in the same sample, which enables comprehensive characterization of the TCR repertoire in relation to tumor content. WES/whole-transcriptome sequencing might be applicable to other types of T-cell lymphomas to determine clonal dominance and clonotypic heterogeneity in these malignancies.
Introduction
Mycosis fungoides (MF) is the most prevalent form of cutaneous T-cell lymphoma (CTCL). In early stages, it presents with scaly plaques on the skin that may progress into tumors and finally disseminate to lymph nodes and to other organs.1-3 MF can be viewed as a model of low-grade T-cell lymphomas; it has a chronic relapsing course, low-grade proliferation, chemotherapy resistance, and 5-year mortality approaching 50%.1,4 MF expresses markers of memory T cells and appears to exhibit T-cell receptor (TCR) monoclonality; thus, it is considered to be caused by malignant transformation of a mature T cell residing in the skin.5
TCR gene sequences are excellent markers of T-cell lineage, because TCRδ, TCRγ, TCRβ, and TCRα loci become sequentially rearranged during intrathymic maturation of T cells from diverse variable diversity joining [V(D)J] gene segment pools, and the unique products of the rearrangements are retained (with a notable exception of TCRδ) in all daughter cells.6 Complementarity-determining region 3 (CDR3) encoded by the V(D)J junction is especially useful for lineage tracing because its sequence heterogeneity is increased beyond the combinatorial V(D)J diversity by random insertions and deletions of nucleotides during segment recombination.7 Thus, identical TCRγ, TCRβ, and TCRα sequences of CDR3 in all lymphoma cells would be conclusive proof that malignant transformation took place in a mature T cell that had completed TCR rearrangement; however, true TCR monoclonality, as defined by a single T-cell clonotype, has not been demonstrated in CTCL. Usually, the dominant clone is accompanied by several other TCR clones that are thought to originate from reactive tumor-infiltrating T cells. Statistical methods have been used to formally determine clonality,8 but these methods do not distinguish between tumor clones and expanded reactive clones or determine clonotypic heterogeneity of the tumor itself.
Determination of the clonotypic structure of CTCL is practically important, because clonality assessments are used for clinical diagnosis, prognosis, and staging of CTCL.1,9 The most widely used method, based on multiplexed polymerase chain reaction (PCR) amplification of TCRγ and TCRβ and GeneScan analysis,10 is being replaced by ones based on high-throughput sequencing of PCR-amplified CDR3 regions.9,11-13 These methods seem to have superior sensitivity and specificity in the detection of the T-cell clone but cannot differentiate CDR3 sequences derived from tumor cells vs. those derived from reactive T cells and do not provide any measure of sample purity (the percentage of neoplastic cells). Moreover, the amplification step with multiplex PCR makes sequencing of the complex TCRα locus virtually impossible. Currently, sequencing of TCRα can be achieved by RNA sequencing (RNA-seq), in which primers binding to the invariable constant TCR segment are used but only the transcribed TCR alleles are detected, and information on other nonproductive rearrangements in the genome is not captured. Unfortunately, RNA-seq results may be distorted by the presence of alternatively spliced messenger RNA (mRNA) and allele silencing, which are not uncommon in cancer.11
It has been reported that the CDR3 sequences of rearranged TCRβ genes can be retrieved from whole-exome sequencing (WES).14 Based on this finding, we have developed a protocol in which samples are analyzed by the probe capture WES. This allowed us to identify recombined TCRα, TCRβ, and TCRγ sequences from DNA in MF patients and compare their respective expression patterns. Because WES also allows the quantification of the percentage of tumor cells in the sample,15 we were able to reconstruct the clonotypic composition of MF and provide evidence for TCR heterogeneity of this lymphoma.
Materials and methods
Sample collection and storage
Ethical approval was obtained from the Health Research Ethics Board of Alberta, Cancer Committee HREBA.CC-16-0820-REN1. After informed consent, 4-mm punch skin biopsies were collected from patients and embedded in optimal cutting temperature medium at −80°C. Ten milliliters of blood was collected, and Ficoll was used to isolate peripheral blood mononuclear cells that were subsequently resuspended in 50% Dulbecco’s modified Eagle medium, 40% fetal bovine serum, and 10% dimethyl sulfoxide and frozen in liquid nitrogen until further use.
Cryosectioning and laser capture microdissection
Ten-micrometer sections of the skin biopsies frozen in optimal cutting temperature medium were placed on 2-µm polyethylene naphthalate membrane slides (catalog number 11505158; Leica Microsystems, Wetzlar, Germany). The slides were stained using hematoxylin and eosin to identify the tumor cells. The microdissected tumor cell clusters were pooled together, collected in RLT buffer (catalog number 79216), and used for simultaneous DNA/RNA isolation using an AllPrep DNA/RNA Micro Kit (catalog number 80284; both from QIAGEN, Hilden, Germany). Isolated DNA was preamplified using a REPLI-g Single Cell Kit (catalog number 150343; QIAGEN).
Sample preparation for WES
One microgram of DNA, measured using a Qubit dsDNA HS Assay Kit (catalog number Q32851; Thermo Fisher Scientific, Waltham, MA), was sheared at a peak size of 200 bp using an S2 Focused-ultrasonicator (Covaris, Woburn, MA). Sheared DNA from samples MF1, MF2, MF25, MF30, MF33, MF35, MF36, MF37, MF43, MF44, and MF45 were incubated with NEBNext FFPE DNA Repair Mix (catalog number M6630S) and then end repaired, ligated with adaptors, and indexed using a NEBNext Ultra II DNA Library Prep Kit for Illumina (catalog number E7645S; both from New England Biolabs, Ipswich, MA). For DNA amplification, 4 to 7 cycles were used rather than the number of cycles recommended by New England Biolabs. Prepared libraries were hybridized with biotin-labeled RNA baits (SSELXT Human All Exon V6 + UTR; Agilent Technologies, Santa Clara, CA) at 65°C for 2 hours. A few of the samples were also used for hybridization with customized probes designed to target the V and J regions of TCRα, TCRβ, and TCRγ. These customized probes were combined with an SSELXT Human All Exon V6 + UTR kit to improve the overall efficiency of the capture protocol in identifying TCR clonotypes. Hybridized DNA was pulled down using Dynabeads MyOne Streptavidin T1 (catalog number 65601; Thermo Fisher Scientific). Captured DNA was reamplified using a KAPA Library Amplification Kit with primers (catalog number 07958978001; Roche Diagnostics, Risch-Rotkreuz, Switzerland). The average peak size of enriched DNA libraries verified using a 2100 Bioanalyzer (Agilent Technologies) was 325 bp. The DNA libraries were sequenced (300 cycles) on an Illumina HiSeq 1500 sequencer using a paired-end 150 kit (catalog number PE-402-4002; HiSeq Rapid Cluster Kit v2) or a NovaSeq 6000 S4 Reagent Kit (catalog number 20012866; both from Illumina, San Diego, CA).
Sample preparation for whole-transcriptome sequencing
Ten nanograms of total RNA, quantified using a Qubit RNA HS Assay Kit (Q32852; Thermo Fisher Scientific), was used for ribosomal RNA depletion using a NEBNext rRNA Depletion Kit (catalog number E6310; New England Biolabs). Ribosomal RNA–depleted samples were used for complementary DNA (cDNA) synthesis, and the library was built using a NEBNext Ultra II Directional RNA Library Prep Kit for Illumina (catalog number E7760; New England Biolabs). The peak size of prepared cDNA libraries was verified using a 2100 Bioanalyzer (Agilent Technologies). The cDNA libraries were later sequenced on an Illumina HiSeq 1500 sequencer using a paired-end 150 kit (catalog number PE-402-4002; HiSeq Rapid Cluster Kit v2; Illumina).
Data analysis
The fastq files were analyzed using MiXCR to identify the TCR clonotypes.16 Short and long read alignments were included for whole-transcriptome sequencing (WTS); however, for WES data, partial reads were filtered out because they might be the captures of only V or J sequences. Threads were processed using the GATK4 generic data-preprocessing workflow17 and then analyzed with Titan15 to determine copy number aberration (CNA) and tumor purity using the hg38 human reference genome. The tcR package in R was used to calculate the inverse Simpson diversity index and identify the overlapping clones.18 VJ combination bias was analyzed using the VDJtools package in R.19
Results
Identification of T-cell clonotypes from WES and WTS
The sequences of CDR3 regions and TCR clonotypes can be determined from WES and WTS. We performed laser capture microdissection (LCM) of the areas of atypical lymphocytic infiltrate in 33 biopsies of plaques (early lesions) and tumors (advanced lesions) from 27 patients with MF (Figure 1; supplemental Table 1). Because of the lack of tumor-specific markers, T cells were identified based only on histology of the cells. We expected some contamination by reactive T cells, because histology cannot unequivocally define early-stage lymphoma cells. Therefore, CNA analyzed from WES15 was used to identify the percentage of tumor cells in the LCM samples. Moreover, to directly compare WES and WTS results, we purified DNA and RNA simultaneously from the same isolated cell clusters for a few of the tumor and plaque pairs (early and late lesion samples collected from the same patient). As shown in Figure 2A-B (and also in supplemental Table 2), we used the capture-based WES technique to successfully identify numerous CDR3 sequences corresponding to TCRα, TCRβ, and TCRγ clonotypes. With the sequencing depth of 87 × 106 reads, we were able to capture 146 (37-471; median and range) TCRα, 40 (5-110) TCRβ, and 21.5 (1-98) TCRγ clonotypes. The relative excess in TCRα abundance is readily explainable by the fact that, during T-cell development, TCRβ is under strict allelic exclusion, but the TCRα locus is usually rearranged on both chromosomes, sometimes in multiple rounds resulting in 2 to 4 TCRα rearrangements per single TCRβ rearrangement.20,21 This explanation is confirmed by WTS results documenting a comparable number of expressed TCRβ clonotypes as the number of clonotypes identified at the DNA level (35.5 vs 40) and nearly the same median number of transcribed TCRα clonotypes (n = 50) in 9 of the MF samples with available WTS data (Figure 2B). There was no bias in V and J segment detection in the control peripheral blood samples (supplemental Figure 1) using the same WES protocol.
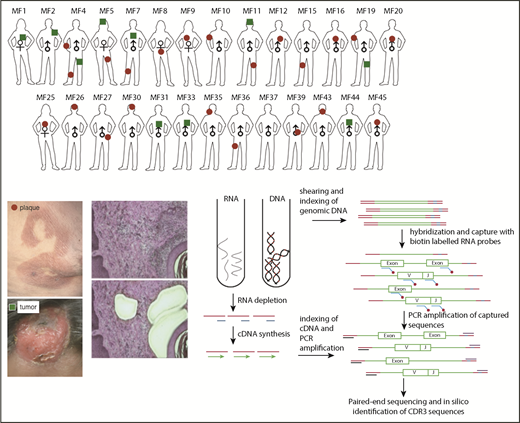
Schematic representation of sample collection, processing, and TCR sequencing. Four-millimeter punch biopsies were collected from early lesions (plaques; red circles) or tumors (green squares) in 27 patients with MF. Biopsies were cryosectioned and laser microdissected to capture tumor cells that were pooled together. Original magnification ×10; hematoxylin and eosin staining. DNA and RNA were isolated simultaneously from the microdissected material and processed for WES and WTS. WTS data are available only for samples MF4_2T, MF4_3P, MF5_1T, MF5_2P, MF7_1T, MF7_2P, MF11T, MF11_1P, MF19_1T, and MF19_2P and a pool of normal CD4+ lymphocytes (data not shown). The gene sequence is indicated in green, the adapter sequence is indicated in red, and the index sequence is indicated in blue.
Schematic representation of sample collection, processing, and TCR sequencing. Four-millimeter punch biopsies were collected from early lesions (plaques; red circles) or tumors (green squares) in 27 patients with MF. Biopsies were cryosectioned and laser microdissected to capture tumor cells that were pooled together. Original magnification ×10; hematoxylin and eosin staining. DNA and RNA were isolated simultaneously from the microdissected material and processed for WES and WTS. WTS data are available only for samples MF4_2T, MF4_3P, MF5_1T, MF5_2P, MF7_1T, MF7_2P, MF11T, MF11_1P, MF19_1T, and MF19_2P and a pool of normal CD4+ lymphocytes (data not shown). The gene sequence is indicated in green, the adapter sequence is indicated in red, and the index sequence is indicated in blue.

Efficiency of WES probe capture and WTS protocols in the detection of CDR3 clonotypes in MF biopsies. All of the samples were sequenced using whole-exome probe capture (A) and WTS (B), and the number of clonotypes for TCRα, TCRβ, and TCRγ was determined for each sample, as indicated. The lines connect the results for the same sample. (C-E) The effect of TCR-specific probes. The capture was performed in 4 samples with whole-exome probes as in panel A (Exome) or with whole-exome probes combined with specific TCR capture probes (Exome+TCR) and sequenced, and the number of unique clonotypes for TCRα (C), TCRβ (D), and TCRγ (E) was determined, as in panel A. The addition of probes slightly increased the number of TCRγ clonotypes (P = .024, paired Student t test) but not the number of TCRα or TCRβ clonotypes. (F-H) The effect of sequencing depth on clonotype detection for TCRα (F), TCRβ (G), and TCRγ (H). Two samples of whole peripheral blood mononuclear cells were sequenced with WES at a maximum of 400 million reads, as in panel A. The samples do not reach saturation up to 348 million reads (∼800× sequencing depth).
Efficiency of WES probe capture and WTS protocols in the detection of CDR3 clonotypes in MF biopsies. All of the samples were sequenced using whole-exome probe capture (A) and WTS (B), and the number of clonotypes for TCRα, TCRβ, and TCRγ was determined for each sample, as indicated. The lines connect the results for the same sample. (C-E) The effect of TCR-specific probes. The capture was performed in 4 samples with whole-exome probes as in panel A (Exome) or with whole-exome probes combined with specific TCR capture probes (Exome+TCR) and sequenced, and the number of unique clonotypes for TCRα (C), TCRβ (D), and TCRγ (E) was determined, as in panel A. The addition of probes slightly increased the number of TCRγ clonotypes (P = .024, paired Student t test) but not the number of TCRα or TCRβ clonotypes. (F-H) The effect of sequencing depth on clonotype detection for TCRα (F), TCRβ (G), and TCRγ (H). Two samples of whole peripheral blood mononuclear cells were sequenced with WES at a maximum of 400 million reads, as in panel A. The samples do not reach saturation up to 348 million reads (∼800× sequencing depth).
Efficiency of probe-capture technique in identification of T-cell clonotypes
Previous protocols with probe-capture and high-throughput sequencing used TCR-specific probes rather than the vast panel of probes for the entire exome.22 The drawback of that approach is that fewer probes can paradoxically lead to decreased capture efficiency (G.K.-S.W., unpublished observations). Because the exome-capture probe set was not specifically designed to capture TCR genes, we asked whether the efficiency can be increased by adding probes targeting V and J segments of TCRα, TCRβ, and TCRγ. As shown in Figure 2C-E, those additional probes increased the total number of identified clonotypes in 3 of the 4 samples, but the difference was not statistically significant. Therefore, we used standard exome-capture probes in subsequent experiments. We also tested the sequencing depth on clonotype detection efficiency by sequencing 2 total blood samples with 400 million reads each. We observed that, at a depth of 348 million read per sample (∼800× sequencing coverage), the capture experiments with deep sequencing did not reach saturation in identifying TCR clonotypes. The efficiency with increased sequencing depth still remained highest for TCRα and lowest for TCRγ (Figure 2F-H).
Analysis of malignant TCR clonotypes in MF
MF is thought to develop from memory T cells; therefore, it should have the same TCRγ, TCRβ, and TCRα clonotypes. The concept of monoclonality of T-cell lymphoma has been well documented using multiplex/heteroduplex PCR amplification and detection by capillary electrophoresis or high-throughput sequencing,10,12 and it is used as a diagnostic test in CTCL. Therefore, we were interested in whether our WES-based method of clonotype detection could identify those TCR clones in MF samples. The biopsies always contain varying, usually unknown, amounts of reactive T cells that contribute to the repertoire of TCR clonotypes. Perhaps, therefore, previous studies claimed monoclonality in samples showing a dominant clonotype frequency as low as 15%, with the rest of the clonotypes (up to 85% of the sample composition) considered to represent reactive T cells.9,12 As shown in Figure 3, if the 15% clonotype frequency threshold is applied, only 9 of 33 MF for TCRγ, 15 of 33 MF for TCRβ, and 5 of 33 MF for TCRα can be classified as monoclonal on the basis of WES.

Relative frequency of T-cell clonotypes. TCRα (A), TCRβ (B), and TCRγ (C) repertoire sequences identified from WES of MF samples. Sample ID relates to patient number, as in Figure 1, with the suffix P (plaque) or T (tumor). TCRα (D) and TCRβ (E) repertoires identified by WTS of MF samples. Each bar represents an individual CDR3 amino acid clonotype, with red and green indicating the first-ranked and tenth-ranked clonotype, respectively, in decreasing order of relative frequency. Gray bars represent the rest of the identified clonotypes in the samples. NormalLym, pooled CD4+ normal lymphocytes from 4 healthy donors.
Relative frequency of T-cell clonotypes. TCRα (A), TCRβ (B), and TCRγ (C) repertoire sequences identified from WES of MF samples. Sample ID relates to patient number, as in Figure 1, with the suffix P (plaque) or T (tumor). TCRα (D) and TCRβ (E) repertoires identified by WTS of MF samples. Each bar represents an individual CDR3 amino acid clonotype, with red and green indicating the first-ranked and tenth-ranked clonotype, respectively, in decreasing order of relative frequency. Gray bars represent the rest of the identified clonotypes in the samples. NormalLym, pooled CD4+ normal lymphocytes from 4 healthy donors.
Information from WES was used to identify CNA in the cancer genome and, hence, calculation of tumor cell enrichment in the LCM samples. Even in the microdissected samples the proportion of malignant cells varied from 21.1% to 98.6% (median, 71.28%), and there were no differences between the plaques and the tumors. Contrary to expectation, the frequency of the most abundant (dominant) clone and the diversity index (inverse Simpson index) were not correlated with the proportion of tumor cells in the sample (supplemental Figure 2; supplemental Table 3). More surprising was the finding that a single TCRβ clonotype cannot account for all malignant cells in the sample (Figure 4). Even in samples with the ratio of the sum of 2 dominant (biallelic) TCRγ clonotypes/proportion of tumor cells ≈1 (MF4_2T, MF4_3P, MF5_1T, MF5_2P, MF7_1T, MF8P, MF9P, MF11T, MF11_1P; sample ID relates to patient number, with the suffix P [plaque] or T [tumor]), representing samples with perfect TCRγ monoclonality, the dominant TCRβ clonotype could only account for a median of 15% of tumor cells. As shown in Figure 3B, WES revealed the presence of 1 to 3 additional TCRβ clonotypes that, together, had a frequency comparable to the dominant clonotype. Intriguingly, WTS for these samples revealed single dominant TCRβ and TCRα in MF4_3T and MF11T, oligoclonality in MF7_1T and MF7_2P, and polyclonality for MF5_1T, MF11_1P, MF19_1T, and MF19_2P (Figure 3E-F). These results illustrate that a malignant T-cell clone can rearrange multiple TCRγ, TCRβ, and TCRα in some instances express more than a single TCRα and TCRβ mRNA.

Clonotypic diversity of MF. Contribution of the dominant clonotypes of TCRα, TCRβ, and TCRγ relative to the tumor DNA enrichment of the sample. Note that for samples MF4_2T, MF4_3P, MF5_1T, MF5_2P, MF7_1T, MF7_2P, MF8P, MF9P, MF11T, and MF11_1P, the proportion of the dominant TCRγ clonotype is approximately equal to the proportion of tumor DNA in the samples, indicating that all tumor cells share the same TCRγ clonotype. However, in the same samples, the relative frequency of the dominant TCRα and TCRβ clonotypes is only 15% (range, 6.52-30.89), indicating that other clonotypes are found in tumor-derived DNA.
Clonotypic diversity of MF. Contribution of the dominant clonotypes of TCRα, TCRβ, and TCRγ relative to the tumor DNA enrichment of the sample. Note that for samples MF4_2T, MF4_3P, MF5_1T, MF5_2P, MF7_1T, MF7_2P, MF8P, MF9P, MF11T, and MF11_1P, the proportion of the dominant TCRγ clonotype is approximately equal to the proportion of tumor DNA in the samples, indicating that all tumor cells share the same TCRγ clonotype. However, in the same samples, the relative frequency of the dominant TCRα and TCRβ clonotypes is only 15% (range, 6.52-30.89), indicating that other clonotypes are found in tumor-derived DNA.
Identification of shared TCR clonotypes
The monoclonal mature T-cell theory dictates that the tumor is an expansion of the clone found in early-stage lesions, such as patches and plaques.5 Therefore, a high degree of overlap is expected between clones of the tumor and the plaque samples collected from a patient at a single time point. Thus, we were interested in whether clonotypic composition is the same in early (plaque) and advanced (tumor) lymphoma lesions. Because of the vast number of clonotypes and reactive T-cell contamination, we focused on sharing of the top 10 dominant clonotypes, which are most likely to represent the malignant clonotypes. For the 5 pairs in our data set, 4 pairs (MF4_2T/MF4_3P, MF5_1T/MF5_2P, MF11T/MF11_1P, and MF19_1T/MF19_2P) shared no more than 1 to 3 clonotypes independently for TCRα, TCRβ, and TCRγ, and patient MF7 (samples MF7_1T and MF7_2P) shared no clonotypes. In retrospect, given the vastness of the CDR3 repertoire, it could be expected that individual clonotypes are not shared in samples from different patients. However, interindividual clonotype sharing was relatively common, with the highest number of 4 of the top 10 dominant clonotypes shared between MF4_2T and MF43T for TCRα, MF30P and MF37P for TCRβ, and MF31T and MF44T for TCRγ (Figure 5). For all clonotypes detected in a sample, the number of shared clonotypes was even higher, reaching 45 shared TCRα clonotypes, 10 shared TCRβ clonotypes, and 25 shared TCRγ clonotypes (supplemental Figure 3). Vα and Vβ segment usage was characterized by a high representation of pseudogenes (TRAV11, TRAV28, TRAV31, TRBV12-1, TRBV22-1) but otherwise did not reveal any clues about the functional role of those clonotypes.
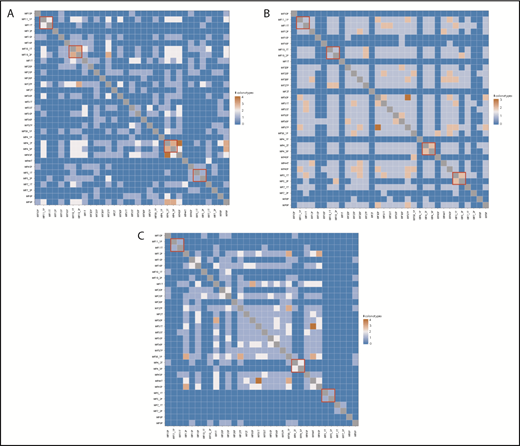
Shared T-cell clonotypes. The 10 most frequent CDR3 sequences identified using WES were tested for overlap. The red boxes denote the TCRα (A), TCRβ (B), and TCRγ (C) clonotypes shared in tumor and plaque lesion pairs collected from each individual patient.
Shared T-cell clonotypes. The 10 most frequent CDR3 sequences identified using WES were tested for overlap. The red boxes denote the TCRα (A), TCRβ (B), and TCRγ (C) clonotypes shared in tumor and plaque lesion pairs collected from each individual patient.
Discussion
In this article, we demonstrate that the TCR repertoire in MF can be assessed by probe-capture–based WES and simultaneously identifies TCRγ, TCRβ, and TCRα rearrangement. This method has the advantage of identifying TCRα locus rearrangements that do not amplify reliably with multiplex PCR because of the large number of V and J genes. To date, all data on TCRα were gathered with RNA-seq,23,24 and very little is known about the diversity of TCRα at the DNA level. Another advantage of our approach is the use of exome data to estimate the percentage of malignant cells in the sample, eliminating the need for arbitrary thresholds of reactive T-cell contamination in the samples.
The disadvantage of our method is its lower robustness compared with PCR-based methods with regard to capturing the entire TCR repertoire in the sample. WES/WTS yielded hundreds, rather than thousands, of TCRα and TCRβ clonotypes; although they were sufficient to analyze TCR rearrangement in tumor cells, it did not allow for comprehensive estimation of the entire T-cell diversity. The number of detected clonotypes was linearly dependent on sequencing depth and does not reach saturation at the depth of 348 million reads, where a maximum of 390 TCRα clonotypes and 109 TCRβ clonotypes could be detected in whole-blood samples. It is possible that, with further improvements in capture-probe design, the robustness of the technique could be increased to also study low-frequency clonotypes.
Analysis of the TCR repertoire in MF by WES led to unexpected conclusions regarding the nature of clonal expansion of malignant cells. By comparing the proportion of tumor-derived DNA in the sample with the relative frequencies of TCRγ, TCRβ, and TCRα clonotypes, we found evidence for the existence of multiple, rather than single, malignant T-cell clonotypes. Especially informative were the cases in which the proportion of monoclonal TCRγ rearrangement matched the proportion of tumor-derived DNA, indicating that the sample was composed of a population of malignant cells sharing an identical TCRγ clonotype (eg, cases MF4_2T, MF4_3P, MF5_1T, MF5_2P, MF7_1T, MF8P, MF9P, MF11T, MF11_1P; Figures 3 and 4). Instead of the expected TCRβ monoclonality, we detected 2 to 7 TCRβ clonotypes and multiple TCRα clonotypes. This indicates that, at least in some cases of MF, the initial transformation does not happen at the level of skin-resident memory T cells but possibly much earlier, during lymphocyte development after completion of TCRγ rearrangement but before initiation of TCRβ and TCRα recombination. Thus, all malignant cells inherit the identical TCRγ CDR3 sequences, but not TCRβ or TCRα, which would be different in the subclones descending from the same precursor. Other groups that performed TCR sequencing in CTCL also found evidence of oligoclonality.25 Recently, Ruggiero et al,23 using ligation-anchored PCR for mRNA amplification and sequencing of TCRα and TCRβ in Sézary syndrome, found an oligoclonal, rather than monoclonal, pattern in 4 of 10 patients, and a polyclonal TCR repertoire was reported in subgroups of patients with peripheral T-cell lymphoma, not otherwise specified, or angioimmunoblastic T-cell lymphoma. Supportive evidence also comes from the studies showing multiple TCRβ transcripts in CTCL with the CNA of chromosome 7 containing TCRβ.26 It is unlikely that malignant T cells are able to recombine TCR in the periphery because the essential recombination-activating genes RAG-1 and RAG-2 are not active in mature T cells or in CTCL.27 Moreover, in our WTS data set there is no evidence of RAG1/2 expression (data not shown). Previous findings that chromosomal breaking points in CTCL contain RAG heptamer sequences reinforce our conclusion that initial stages of malignant transformation happen early during lymphocyte development when RAG enzymes are active.28
We have also considered the possibility that the observed clonotypic heterogeneity in MF is caused by malignant transformation of multiple cells in an inflammatory infiltrate.29 Previous studies have indicated that Staphylococcus aureus in skin microbiota provide an antigen drive for MF. This hypothesis was supported by higher than expected usage of Vβ segments involved in the recognition of staphylococcal superantigens (eg, TRBV20 or TRBV5.1).12,22,23,30,31 We could not confirm those observations; on the contrary, we found that MF clonotypes, including those shared between patients, contain Vα and Vβ segments that are found at a very low frequency in peripheral blood or inflamed skin (eg, pseudogenes TRAV11, TRAV28, TRAV31, TRBV12-1, TRBV22-1).32,33 We hypothesize that the putative increased frequency of pathogen-recognizing Vβ usage identified in previous studies may be due to the presence of reactive T cells in the sample, which was minimized in our material that was microdissected and enriched in neoplastic cells.
In conclusion, we have demonstrated that probe-capture based WES is a useful and straightforward approach to identify clonotypic composition in MF. Our data show that CTCL is clonotypically heterogeneous, which strongly suggests that the initial malignant transformation may take place at the stage of the T-cell precursor rather than the mature T cell, as currently believed. The clinical implications of clonotypic heterogeneity for diagnosis and prognosis remain to be further investigated. However, it is conceivable that clonotypic heterogeneity is a feature of a more general phenomenon of tumor heterogeneity, which is known to have a profound impact on tumor prognosis and response to therapy.24,25 It remains to be seen whether clonotypic heterogeneity is correlated with clinical outcomes and whether this phenomenon is present in other T-cell lymphomas.
The full-text version of this article contains a data supplement.
Acknowledgments
The authors thank Rachel Doucet and the nursing staff of Kaye Edmonton Clinic for help with sample collection.
This work was supported by grants from the Canadian Dermatology Foundation (CDF RES0035718), the University of Alberta, Bispebjerg Hospital (unrestricted research grant [R.G.]), and the Danish Cancer Society (Kræftens Bekæmpelse R124-A7592 Rp12350).
Authorship
Contribution: A.I. designed the experiments, analyzed the data, and wrote the manuscript; A.I. and S.O. performed the experiments; J.P. and D.H. performed CNA analysis and tumor purity calculations; W.W. and G.K.-S.W. provided input on the technical aspects of the experiments and edited the manuscript; T.S. helped with sample collection and recruitment of patients for the study; R.G. supervised the experiments and data analysis and edited the manuscript; and all authors approved the final version of the manuscript.
Conflict-of-interest disclosure: The authors declare no competing financial interests.
Correspondence: Aishwarya Iyer, Division of Dermatology, Department of Medicine, University of Alberta, 260 HRMC, 114th St and 85th Ave, Edmonton, AB T6G 2R3, Canada; e-mail: aiyer2@ualberta.ca.

