

Key Points
Induced miR-155 expression promotes vincristine sensitivity in DLBCL cell lines.
High miR-155 expression is associated with superior clinical outcome in patients with DLBCL of the GCB subclass.

Abstract
A major clinical challenge of diffuse large B-cell lymphoma (DLBCL) is that up to 40% of patients have refractory disease or relapse after initial response to therapy as a result of drug-specific molecular resistance. The purpose of the present study was to investigate microRNA (miRNA) involvement in vincristine resistance in DLBCL, which was pursued by functional in vitro analysis in DLBCL cell lines and by outcome analysis of patients with DLBCL treated with rituximab, cyclophosphamide, doxorubicin, vincristine, and prednisone (R-CHOP). Differential miRNA expression analysis identified miR-155 as highly expressed in vincristine-sensitive DLBCL cell lines compared with resistant ones. Ectopic upregulation of miR-155 sensitized germinal-center B-cell-like (GCB)–DLBCL cell lines to vincristine, and consistently, reduction and knockout of miR-155 induced vincristine resistance, documenting that miR-155 functionally induces vincristine sensitivity. Target gene analysis identified miR-155 as inversely correlated with Wee1, supporting Wee1 as a target of miR-155 in DLBCL. Chemical inhibition of Wee1 sensitized GCB cells to vincristine, suggesting that miR-155 controls vincristine response through Wee1. Outcome analysis in clinical cohorts of DLBCL revealed that high miR-155 expression level was significantly associated with superior survival for R-CHOP-treated patients of the GCB subclass, independent of international prognostic index, challenging the commonly accepted perception of miR-155 as an oncomiR. However, miR-155 did not provide prognostic information when analyzing the entire DLBCL cohort or activated B-cell–like classified patients. In conclusion, we experimentally confirmed a direct link between high miR-155 expression and vincristine sensitivity in DLBCL and documented an improved clinical outcome of GCB-classified patients with high miR-155 expression level.
Introduction
Diffuse large B-cell lymphoma (DLBCL) is the most frequent type of non-Hodgkin’s lymphoma, characterized by great heterogeneity regarding clinical presentation, tumor biology, and prognosis.1 Gene expression profiling (GEP) defines cell-of-origin subtypes reflecting normal B-cell differentiation stages and permits classification of DLBCL into activated B-cell-like (ABC) and germinal-center B-cell–like (GCB), which differ in pathogenic activation mechanisms, genetic aberrations, and clinical outcome.2,3 Although this classification has expanded our biological understanding of DLBCL, molecular mechanisms related to treatment response and resistance are still not fully understood.
The addition of rituximab (R) to the multiagent chemotherapy regimen cyclophosphamide, doxorubicin, vincristine, and prednisolone (CHOP) has increased DLBCL survival substantially; however, 30% to 40% of patients ultimately die of relapse or refractory disease because of treatment resistance.4-6 As a consequence, novel treatments and predictive biomarkers are urgently warranted, and equally important, improved biological understanding is required for mechanisms leading to resistance. Several clinical trials have aimed at improving the R-CHOP regimen by dose adjustments, cycles, or add-on drugs, but with limited benefit, emphasizing that increased knowledge of R-CHOP resistance is still highly relevant.7-9 The antimitotic drug vincristine has been used as anticancer therapy for more than 40 years and is a cornerstone for efficacy of R-CHOP because of its broad cytotoxic effect, limited bone marrow suppression, and high tolerability.10,11 Despite wide use of vincristine, little is known about determinants of vincristine resistance in treatment of DLBCL, a caveat when attempting to improve clinical outcome.
Recent studies demonstrate that noncoding RNAs, and in particular microRNAs (miRNAs), play important roles in the pathogenesis of DLBCL.12-14 miRNAs regulate gene expression by targeting mRNA for translational repression or degradation and are involved in cardinal physiologic and pathologic processes.15 Aberrant miRNA expression is a common feature of malignancies and has been linked to chemotherapy resistance.16-18 One of the most extensively studied miRNAs in normal B-cell differentiation and hematological cancers is miR-155,19,20 which acts as an oncomiR in the pathogenesis and aggressiveness of DLBCL.21 In line, miR-155 levels in patients with ABC are significantly higher compared with those detected in patients classified as having GCB,19 and transgenic mice overexpressing miR-155 spontaneously develop DLBCL,22 emphasizing its importance in lymphomagenesis.
Early detection of drug-specific resistance is of pivotal importance to successful cancer therapy, and defining miRNA involvement could provide information on resistance mechanisms of the drug and make miRNAs themselves biomarkers and treatment targets. Because vincristine is a cornerstone in the treatment of DLBCL, we studied the involvement of miRNAs in the response to this antimitotic drug. To pinpoint miRNAs controlling vincristine response, 13 DLBCL cell lines were subjected to systematic dose-response experiments and grouped as resistant, intermediate, or sensitive.23 Global miRNA expression profiling of these cell lines in untreated condition was performed and miRNAs differentially expressed between vincristine sensitive and resistant cell lines were identified, showing miR-155 to be highly expressed in vincristine-sensitive cells. Hence, experimental manipulations of miR-155 expression using lentiviral gene delivery in DLBCL cells were performed to determine the functional effect of miR-155 in vincristine response, and subsequently a prognostic value of miR-155 was documented in 2 independent R-CHOP-treated DLBCL cohorts.
Materials and methods
Cell lines
DLBCL cell lines (supplemental Table 1) were cultured at 37°C in a humidified atmosphere of 95% air and 5% CO2 with RPMI1640 medium, 10% fetal bovine serum, and 1% penicillin/streptomycin. HEK293T cells were maintained in Dulbecco’s modified Eagle medium containing 5% fetal bovine serum and 1% penicillin/streptomycin. All cell lines were authenticated by DNA barcoding23 and examined for mycoplasma infection.
Clinical samples
Diagnostic biopsies from 73 patients with DLBCL (supplemental Table 2) were collected in agreement with the RetroGen research protocol and reviewed and approved by the health ethic committee of the North Denmark Region (approval jr. no. N-20140099), allowing exemption from the Declaration of Helsinki requirement of informed consent according to sections 3 to 5 in the Danish Act on Research Ethics Review of Health Research Projects. Informed consent was waived, as this notifiable database research project did not involve any health risks and, under the given conditions, could not otherwise put a strain on the trial subject. In addition, it would be impossible or disproportionately difficult to obtain informed consent or proxy consent, respectively, because of the use of archival samples and because several patients have died since collection. Of the 73 patients with DLBCL, 69 were treated with standard R-CHOP. In addition, we used Gene Expression Omnibus data (GSE1084624 and GSE313123 ).
Dose-response assays
Vincristine dose-response screens were performed on DLBCL cell lines, as previously described.23,25 Each cell line was subjected to 18 increasing concentrations for 48 hours, and dose-responses were evaluated using a 3-(4,5 dimethylthiazol-2-yl)-5-(3-carboxymethoxyphenyl-2-(4-sulfophenyl)-2H-tetrazolium assay.
RNA extraction
RNA was extracted using a protocol combining TRIzol (Invitrogen) and mirVana miRNA Isolation Kit (Ambion/ThermoFisher Scientific)26 or a RNAqueous Micro scale RNA Isolation kit (<500 000 cells; ThermoFisher Scientific). RNA integrity and concentration were determined using an Agilent 2100 Bioanalyzer and NanoDrop ND-1000 spectrophotometer, respectively.
Microarray profiling
miRNA expression profiling was performed using GeneChip miRNA 1.0.2 arrays (Affymetrix), as previously described,17 and CEL files are deposited at Gene Expression Omnibus (GSE72648). GEP of clinical samples and transduced SU-DHL-5 cells was performed using Affymetrix GeneChip HG-U133 Plus2.0 arrays. CEL files were generated using the Affymetrix Gene-Chip Command Console Software and deposited at Gene Expression Omnibus (GSE109027). Data comply with Minimum Information About a Microarray Experiment requirements.
Reverse transcription quantitative polymerase chain reaction
miR-155 expression was determined by TaqMan miRNA reverse transcription quantitative polymerase chain reaction (RT-qPCR; Thermo Fisher Scientific). Two independent cDNA syntheses were conducted and pooled before amplification qPCR analysis (hsa-miR-155 [002623], RNU6B [001093], RNU24 [001001]). Each sample was analyzed in triplicate, using Mx3000P (Stratagene/Agilent Technologies). miRNA expression was normalized to RNU6B and RNU24 and log2 transformed.
Plasmid construction
A lentiviral vector containing multiple cloning sites for insertion of PCR-amplified miRNA sequences was generated.27,28 The sequence encoding pri-miR-155 was amplified from HeLa cells, using primers 5′-AAAGCGGCCGCCATCTTTTAATTGCCAATTTCTCTACC-3′ and 5′-AAAGCGGCCGCGTTTAAGGTTGAACATCCCAGT-GACC-3′. Fragments were NotI-digested and inserted into Bsp120I digested plasmid from corynebacterium callunae (pCCL) with a multiple cloning site (MCS) immediately downstream of the H1 promoter (H1) and phosphoglycerate kinase promotor (PGK) controlling enhanced green fluorescent protein (eGFP) (pCCL/H1-MCS-PGK-eGFP). For miR-155 inhibition, a Tough Decoy (TuD)–expressing construct with high miRNA-suppressive capacity was generated by a 2-step cloning strategy.29,30 DNA sequences containing inhibitor sequence flanked by NheI/AscI sites were synthesized and cloned into pUC57 by GeneScript. Inhibitor sequences were cleaved from pUC57 and cloned into AvrII/AscI-digested pCCL/PGK-eGFP.H1-MCS. Sequences including TuD were PCR-amplified from lentiviral vectors encoding H1 driven inhibitor, using 5′-AAAAGGTACCGTATGAGACCACCCTAGCCC-3′ and 5′-AAAAGGTACCCAGAGAGACCCAGTACAAGC-3′. KpnI-digested PCR products were cloned into KpnI-digested pCCL/PGK-eGFP.
To test functionality, sense and antisense oligonucleotides harboring miR-155 target sequence were annealed and cloned into NotI/XhoI-digested psiCHECK-2 vector (Promega).29 Co-transfections of HEK293T cells were performed with 7 ng pCCL/U1-miRNA.PGK-eGFP, 14ng psiCHECK-miRtarget ,and 80 ng pCCL/PGK-eGFP-TuD, using X-tremeGENE 9 (Roche). Renilla and Firefly luciferase expression levels were measured 48 hours posttransfection, using Dual-Glo Luciferase Reporter Assay System (Promega). Renilla luciferase activity was normalized to Firefly and presented relative to negative control (pCCL/PGK-eGFP).
All plasmids were verified by sequencing (GATC; Konstanz, Germany).
Lentivirus production and transduction
To generate lentiviral vectors, 1 × 10⁷ HEK293T cells were seeded in 25 mL Dulbecco’s modified Eagle medium. Twenty-four hours after seeding, cells were transfected with 9.07 µg pMD.2G, 7.26 µg pRSV-Rev, 31.46 µg pMDIg/p-RRE, and 31.46 µg lentiviral transfer vector. Both 48 and 72 hours posttransfection, viral supernatant was harvested, filtered (0.45 µm), and ultracentrifuged. Virus yield was determined by measurements of p24 capsid protein, using p24 Antigen ELISA Kit (XpressBio). DLBCL cells were seeded at 300 000 cells/mL in 1 mL standard RPMI and transduced with virus corresponding to 85 ng p24. DLBCL cell lines SU-DHL-5, OCI-Ly7, NU-DHL-1, and RIVA were selected on the basis of ABC/GCB classification, resistance/sensitivity to vincristine, and lentiviral transducibility.27 RT-qPCR was used to confirm changes in miR-155 expression.
CRISPR-Cas9 knockout
Single guide RNA (sgRNA) was designed to target the functional part of MIR155HG (supplemental Figure 1). Sense and antisense oligonucleotides encoding the sgRNA were annealed and cloned into pLV/CRISRP-v2, using BsmbI site.31 OCI-Ly7 was transduced with LV/CRISPR-sgRNA-miR-155 or LV/CRISPR-sgRNA-control, the latter without target in the human genome (5′-ACGGAGGCTAAGCGTCGCAA-3′) and subjected to puromycin selection (0.5 µg/mL). After 2 weeks, gDNA was extracted using standard NaCl/EtOH precipitation protocol, and gDNA encompassing the Cas9 cut sites was amplified using 5′-AACTCCGAAGAGCGGTT-3′ and 5′-GGTTGAACATCCCAGTGACC-3′. Indel frequencies were determined by sequence-based Tracking of Indels by Decomposition analysis.32
miR-155 knockout clones from single-cell expansion were generated by seeding 96-well plates at concentrations of 0.5 cell/well in 50 µL standard RPMI, 100 µL conditioned medium, and 50 µL RPMI containing 55% fetal bovine serum and 3% penicillin/streptomycin. Tracking of Indels by Decomposition analysis and RT-qPCR was performed in individual clones.
Dose-response screen of transduced cells
Transduced cells and miR-155 knockout clones were seeded at 3 × 10⁵ cells/mL in 1 mL standard RPMI. Cells were exposed to vincristine for 48 hours, and viable cells were counted using trypan blue exclusion. Transduced cells were treated with 2 concentrations of vincristine (0.0005-0.001 µg/mL), whereas miR-155 knockout cells were exposed to 0.0005, 0.001, and 0.0015 µg/mL. Transductions and functional assays were performed in triplicate in 2 independent assays.
Western blot
Cell lysates were prepared using RIPA Lysis Buffer supplemented with complete miniprotease inhibitors, and protein concentration was determined using BCA Pierce (Thermo Fisher Scientific). Western blotting analysis was performed following standard Bio-Rad procedures loading 20 µg total protein. Antibodies used were β-actin (1:10 000, Abcam, ab6276), Wee1 (1:1,000, Santa Cruz Biotechnology, sc-5285), Ship-1 (1:1000, Santa Cruz Biotechnology, sc-8425), and rabbit-anti-mouse IgG (1:10 000, Abcam, ab6728).
Double drug analysis
Wee1 inhibitor MK-1775 (Selleck chemical) was dissolved in dimethyl sulfoxide. OCI-Ly7 cells were seeded in 96-well plates at a density of 0.25 × 10⁶ cells/mL, 24 hours before drug was added. Cells were exposed to 0.0015 µg/mL vincristine, 400 nM MK-1775, or 0.0015 µg/mL vincristine and 400 nM MK-1775 for 48 hours, and metabolically active cells were determined by 3-(4,5 dimethylthiazol-2-yl)-5-(3-carboxymethoxyphenyl-2-(4-sulfophenyl)-2H-tetrazolium-containing CellTiter 96 Reagent at a concentration of 20% of pre-additional well content. Absorbance was measured at 492 nm (BMG, LABTECH).
Statistical analysis
Statistical analyses were performed with R (v.3.3.3).33 Array-based miRNA and gene expression data were cohort-wise background corrected and normalized at the probe and gene level, applying a Robust Multichip Average approach,34 respectively.
Differential miRNA expression analysis was performed using the limma Bioconductor package (v.3.26.9),35 setting P < .05 and FC > |2| as the significance threshold.
To increase statistical power, external R-CHOP restricted cohorts3,24 were combined into a meta-cohort. The meta-cohort was batch corrected using ComBat implemented in the sva Bioconductor package (v.3.18.0),36,37 and miR-155 expression was quantified through the MIR155HG probe set 229437_at included in HG-U133 Plus2.0 GeneChip. Validity of array-based quantification was confirmed through correlation analysis, with RT-qPCR quantified miR-155 expression in the in-house cohort.
Confounding effects of ABC/GCB subclasses and Cheson response evaluation on miR-155 expression were investigated through simple linear regression analysis. Survival analyses were performed using Kaplan-Meier and log-rank test statistics for progression-free survival (PFS) and overall survival (OS). Furthermore, simple and multiple Cox proportional hazards regression analyses were conducted using an additive model with international prognostic index, ABC/GCB, and miR-155 expression (dichotomized by median split into low and high or as a continuous variable) as independent confounders. Linear regression and survival analyses were conducted for all patients with DLBCL and restricted to ABC and GCB classified patients, respectively.
Gene set enrichment analysis (GSEA) was performed for transduced cells (miR-155 vs control and TuD-155 vs control), using the GSEA desktop application (v.3.0)38 with preranked gene lists, 2000 permutations of gene set randomization, and default settings otherwise. GSEA was restricted to gene sets included in the Hallmark collection from the Molecular Signatures Database (v.6.0),38,39 excluding sets with fewer than 15 or more than 500 genes. Gene sets with normalized P ≤ .05 and FDR q ≤ 0.25 were considered significantly enriched.
If not mentioned otherwise, 2-sided Student t tests were performed to evaluate statistical significance, and significance thresholds were set to 0.05.
Results
Identification of vincristine response-specific miRNAs
DLBCL cell lines subjected to vincristine dose-response screens were ranked according to their sensitivity, using area under the dose-response curve, and trichotomized into groups of sensitive, intermediate, and resistant cells (supplemental Table 1).23,25 To identify miRNAs associated with vincristine response, global miRNA profiling was conducted for each cell line in untreated condition, and subsequent differential miRNA expression analysis between vincristine-sensitive and vincristine-resistant cell lines identified 15 differentially expressed miRNAs (supplemental Table 3). Low miR-155 expression displayed the strongest association to vincristine resistance and was selected for further analyses (supplemental Figure 2). Of notice, miR-155 was the top candidate irrespective of split strategy used to categorize cell lines as sensitive and resistant (4 sensitive, 5 intermediate, and 4 resistant; 6 sensitive and 7 resistant; data not shown).
Downregulation of miR-155 promotes vincristine resistance
To substantiate involvement of miR-155 in vincristine response, lentiviral vectors encoding pri-miR-155 or TuD-155 for stable up- and downregulation, respectively, were designed (Figure 1A).
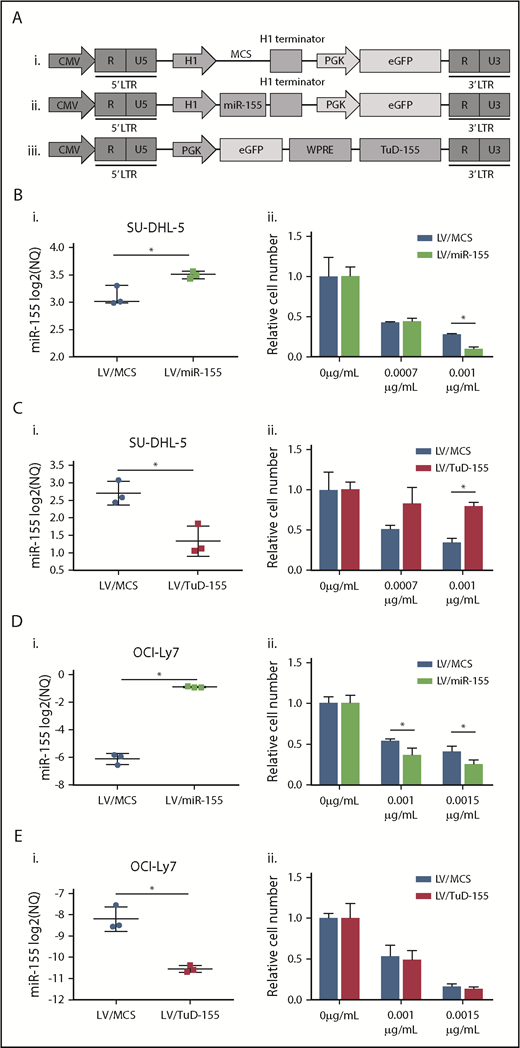
Changes in miR-155 expression in GCB-DLBCL cell lines affect vincristine response. (A) Schematic overview of lentiviral vector plasmids used as control (i), for expression of miR-155 (ii) and TuD-155 (iii) inhibitor in fusion with eGFP. (B-E) Up- and downregulation of miR-155 was detected by RT-qPCR in (Bi,Ci) SU-DHL-5 and (Di,Ei) OCI-Ly7 cells and followed by vincristine dose-response analysis. (Bii,Cii,Dii,Eii) Drug response is illustrated as percentage of living cells related to the no-drug treated condition. CMV, cytomegalovirus promoter; LTR, long terminal repeat; NQ, normalized quantity; PGK, phosphoglycerate kinase promoter; WPRE, woodchuck hepatitis virus posttranscriptional regulatory element.
Changes in miR-155 expression in GCB-DLBCL cell lines affect vincristine response. (A) Schematic overview of lentiviral vector plasmids used as control (i), for expression of miR-155 (ii) and TuD-155 (iii) inhibitor in fusion with eGFP. (B-E) Up- and downregulation of miR-155 was detected by RT-qPCR in (Bi,Ci) SU-DHL-5 and (Di,Ei) OCI-Ly7 cells and followed by vincristine dose-response analysis. (Bii,Cii,Dii,Eii) Drug response is illustrated as percentage of living cells related to the no-drug treated condition. CMV, cytomegalovirus promoter; LTR, long terminal repeat; NQ, normalized quantity; PGK, phosphoglycerate kinase promoter; WPRE, woodchuck hepatitis virus posttranscriptional regulatory element.
Two GCB-DLBCL cell lines, SU-DHL-5 and OCI-Ly7, that are intrinsically sensitive and resistant, respectively, to vincristine with high and low levels of endogenous miR-155 (supplemental Table 1) were transduced. Forty-eight hours posttransduction, the expression level of miR-155 was significantly increased by lentiviral vectors encoding pri-miR-155 and reduced by TuD-155 (Figure 1BI-EI). Ectopic expression of miR-155 did not have toxic effects because total cell number was unchanged (supplemental Figure 3). Moreover, GSEA conducted for transcriptional profiles of transduced SU-DHL-5 cells revealed that top enriched gene sets detected in miR-155 overexpressing cells compared with controls were associated with G2/M checkpoints and mitotic spindle assembly. Consistently, those gene sets were enriched in control samples when compared with cells with miR-155 knock-down (supplemental Tables 4 and 5; supplemental Figure 4). Based on the antimitotic effect of vincristine, those results suggest that miR-155 and vincristine affect comparable biological processes.
Induction of miR-155 significantly increased vincristine sensitivity in both GCB cell lines, and decreased miR-155 expression consistently caused vincristine resistance in intrinsic vincristine-sensitive SU-DHL-5 cells, whereas no change in response was observed in the vincristine-resistant cell line OCI-Ly7 (Figure 1Bii-Eii). Because downregulation of miR-155 did not affect vincristine response in OCI-Ly7, 2 miR-155 knockout clones were generated (supplemental Figure 5; Figure 2B). As a result of miR-155 depletion, cell viability decreased, whereas no difference between vector control and the parental wild-type counterpart was observed (Figure 2A). Furthermore, miR-155 knockout increased vincristine resistance over a range of concentrations (Figure 2C), indicating that miR-155 functionally affected vincristine response in DLBCL cells of the GCB subclass.
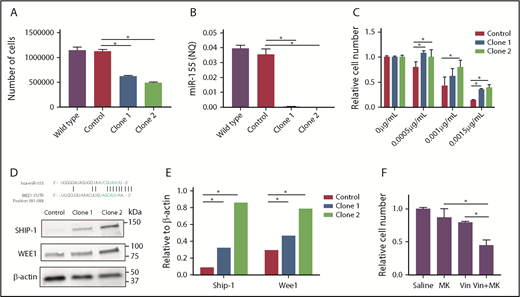
miR-155 knockout experiments. Two independent miR-155 knockout clones were generated in OCI-Ly7 cells by the CRISPR-Cas9 technology. Wild-type accounts for untransduced OCI-Ly7 cells, whereas control is an OCI-Ly7 population subjected to a sgRNA not targeting the human genome. (A) Cell proliferation was determined by the trypan blue exclusion method after 48 hours of growth in wild-type, control cells, and miR-155 knockout clones. (B) miR-155 expression detected by RT-qPCR. (C) Vincristine dose-response analysis using 0.0005 µg/mL, 0.001 µg/mL, and 0.0015 µg/mL. Drug response is illustrated as percentage of living cells related to the no-drug condition. (D) Detection of Wee1 protein by western blotting. β-actin was used as loading control and Ship-1, a validated target of miR-155,53 as positive control. (E) Quantification of western blot bands. Ship-1 and Wee1 levels are depicted as relative to β-actin levels. (F) Chemical inhibition of Wee1 by MK-1775. Wild-type OCI-Ly7 cells were exposed to saline, 400 nM MK-1775, 0.0015 µg/mL vincristine or 400 nM MK-1175 and 0.0015 µg/mL vincristine for 48 hours, and the number of metabolically cells were determined by 3-(4,5 dimethylthiazol-2-yl)-5-(3-carboxymethoxyphenyl-2-(4-sulfophenyl)-2H-tetrazolium assay. Drug response is presented as the number of cells relative to the no-drug condition. MK, MK-1775; Vin, vincristine.
miR-155 knockout experiments. Two independent miR-155 knockout clones were generated in OCI-Ly7 cells by the CRISPR-Cas9 technology. Wild-type accounts for untransduced OCI-Ly7 cells, whereas control is an OCI-Ly7 population subjected to a sgRNA not targeting the human genome. (A) Cell proliferation was determined by the trypan blue exclusion method after 48 hours of growth in wild-type, control cells, and miR-155 knockout clones. (B) miR-155 expression detected by RT-qPCR. (C) Vincristine dose-response analysis using 0.0005 µg/mL, 0.001 µg/mL, and 0.0015 µg/mL. Drug response is illustrated as percentage of living cells related to the no-drug condition. (D) Detection of Wee1 protein by western blotting. β-actin was used as loading control and Ship-1, a validated target of miR-155,53 as positive control. (E) Quantification of western blot bands. Ship-1 and Wee1 levels are depicted as relative to β-actin levels. (F) Chemical inhibition of Wee1 by MK-1775. Wild-type OCI-Ly7 cells were exposed to saline, 400 nM MK-1775, 0.0015 µg/mL vincristine or 400 nM MK-1175 and 0.0015 µg/mL vincristine for 48 hours, and the number of metabolically cells were determined by 3-(4,5 dimethylthiazol-2-yl)-5-(3-carboxymethoxyphenyl-2-(4-sulfophenyl)-2H-tetrazolium assay. Drug response is presented as the number of cells relative to the no-drug condition. MK, MK-1775; Vin, vincristine.
In addition, ABC cell lines RIVA and NU-DHL-1, characterized by intrinsically intermediate response to vincristine and comparably high endogenous expression of miR-155 (supplemental Table 1), were similarly analyzed. Applying the TuD model system decreased miR-155 expression in RIVA cells; however, it did not cause unambiguous effect on vincristine sensitivity (supplemental Figure 6BI-BII). Although functionality of the model systems was confirmed (supplemental Figure 7),28 transduction with LV/miR-155 in RIVA and LV/TuD-155 in NU-DHL-1 did not generate significant changes in intracellular levels of miR-155, and consequently, vincristine dose-response analysis was not performed (supplemental Figure 6AI,DI). Overexpression of miR-155 in NU-DHL-1 cells did not affect vincristine response either (supplemental Figure 6CI-CII), indicating that miR-155 does not play a pivotal role in vincristine response in ABC cells as opposed to GCB cells.
The cell-cycle checkpoint gene WEE1 is a direct target of miR-155
To identify target genes of miR-155 with an effect on vincristine response, transcriptional profiles of ectopic miR-155 expressing SU-DHL-5 cells were analyzed. On the basis of the antimitotic effect of vincristine, resistance mechanisms could be related to cell cycle processes, and thus negatively correlated genes associated with gene ontologies of cell cycle processes were selected (n = 64; supplemental Table 6).
To investigate whether selected genes were potential miR-155 targets, miR-155-mRNA interaction was investigated using well-documented miRNA prediction algorithms (TargetScan, miRDB, microT-CDC, and microRNA.org) and TarBase, a database of experimentally validated miRNA-mRNA interactions. Only 1 gene, WEE1, was predicted as a putative miR-155 target by all algorithms, and was found as experimentally verified in TarBase. Notably, the miR-155 binding site of WEE1 is actively recognized by miR-155 in luciferase-based reporter assays,40,41 and in agreement, induced protein level of Wee1 was observed in miR-155 knockout clones (Figure 2D-E). WEE1 encodes a kinase controlling G2/M phase by inhibitory phosphorylation of Cdk1, through which Wee1 also affects sensitivity to antimicrotubule drugs.42 In accordance, chemical inhibition of Wee1 in wild-type OCI-Ly7 cells decreased the number of living cells and enhanced killing when given in combination with vincristine (Figure 2F).
Prognostic effect of miR-155 expression in GCB-DLBCL
The relationship between miR-155 expression and ABC/GCB subclasses was examined in the in-house cohort, for which miR-155 expression was assayed by RT-qPCR. Higher expression of miR-155 was observed in the ABC subclass (supplemental Figure 8), in accordance with previous observations.19
To investigate the prognostic value of miR-155, dichotomized miR-155 expression was analyzed for association with OS and PFS in R-CHOP-treated patients. Because miR-155 is differentially expressed between patients with ABC and GCB-DLBCL, which display different pathogenesis and prognosis, survival analysis was performed both overall and according to ABC and GCB subclasses. A tendency for association between miR-155 and OS and PFS was observed in the entire DLBCL cohort and for GCB-classified patients, with low miR-155 expression characterizing poor outcome (Figure 3; supplemental Figure 9).
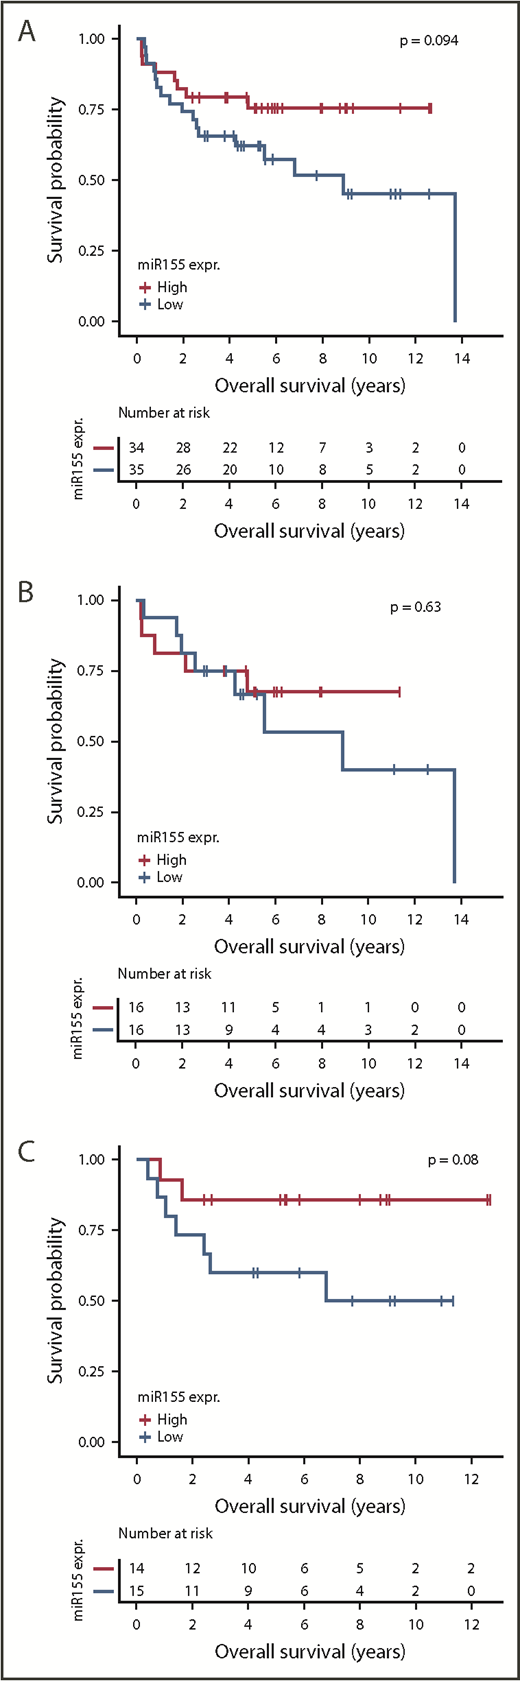
Analysis of prognostic effect of miR-155 expression. Kaplan-Meier plots depicting OS of R-CHOP-treated patients with DLBCL in the in-house cohort. The analysis was conducted for all patients with DLBCL (A), ABC-classified patients (B), and GCB-classified patients (C). For each cohort, patients were dichotomized by median split of miR-155 expression.
Analysis of prognostic effect of miR-155 expression. Kaplan-Meier plots depicting OS of R-CHOP-treated patients with DLBCL in the in-house cohort. The analysis was conducted for all patients with DLBCL (A), ABC-classified patients (B), and GCB-classified patients (C). For each cohort, patients were dichotomized by median split of miR-155 expression.
To verify this trend, we investigated the prognostic value in an independent meta-cohort of 701 patients with DLBCL, in which miR-155 expression was quantified through the precursor MIR155HG. In the in-house cohort, mature miR-155 expression measured by RT-qPCR was highly correlated to its precursor measured by microarray (supplemental Figure 10), supporting array-based miR-155 expression assessment. Analysis of these data revealed differential expression of miR-155 between ABC and GCB-DLBCL (supplemental Figure 8), consistent with the in-house cohort.
When evaluating the prognostic effect of miR-155 expression, prognostic stratification was confirmed within the GCB subclass, with significantly shorter OS and PFS of patients with low levels of miR-155 (Figure 4). However, miR-155 expression did not provide prognostic information within the ABC subclass or the entire cohort. These observations were supported by simple Cox proportional hazards regression analysis (Table 1), and are in accordance with the in-house cohort.
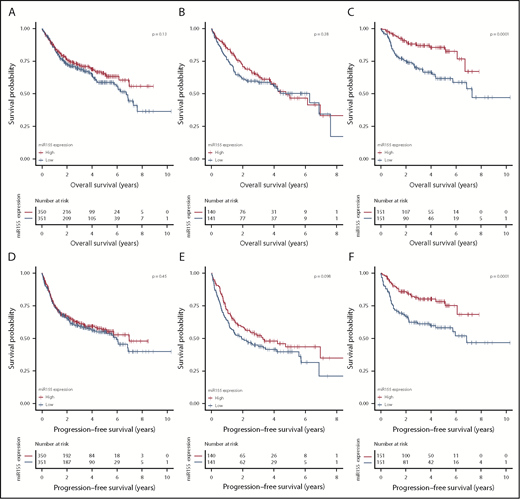
Analysis of association between OS and PFS and miR-155 expression. Kaplan-Meier plot depicting OS (A-C) and PFS (D-F) of R-CHOP-treated patients with DLBCL in the meta-cohort, consisting of R-CHOP–restricted Lymphoma/Leukemia Molecular Profiling Project and International DLBCL Rituximab-CHOP Consortium MD Anderson Project data. Before analysis, data were ComBat normalized to compensate for study-wise batch effect. Analyses were conducted for all patients with DLBCL (A,D), ABC-classified patients (B,E), and GCB-classified patients (C,F). For each cohort, patients were dichotomized by median split of MIR155HG expression.
Analysis of association between OS and PFS and miR-155 expression. Kaplan-Meier plot depicting OS (A-C) and PFS (D-F) of R-CHOP-treated patients with DLBCL in the meta-cohort, consisting of R-CHOP–restricted Lymphoma/Leukemia Molecular Profiling Project and International DLBCL Rituximab-CHOP Consortium MD Anderson Project data. Before analysis, data were ComBat normalized to compensate for study-wise batch effect. Analyses were conducted for all patients with DLBCL (A,D), ABC-classified patients (B,E), and GCB-classified patients (C,F). For each cohort, patients were dichotomized by median split of MIR155HG expression.
MIR155HG expression is an IPI-independent prognostic marker for R-CHOP-treated patients with GCB-DLBCL
| n | no. | Simple | Multiple | |||||
|---|---|---|---|---|---|---|---|---|
| HR | 95% CI | P | HR | 95% CI | P | |||
| All DLBCL | ||||||||
| miR-155 | ||||||||
| Low | 293 | 90 | 1 | — | ||||
| High | 293 | 107 | 1.17 | 0.88-1.54 | .28 | — | — | — |
| IPI | ||||||||
| 0-1 | 71 | 6 | 1 | 1 | ||||
| 2-3 | 314 | 84 | 3.76 | 1.64-8.61 | .0017 | 3.42 | 1.49-7.84 | .0038 |
| 4-5 | 201 | 106 | 9.61 | 4.22-21.88 | 7.19e-08 | 8.29 | 3.62-18.98 | 5.73e-07 |
| Subclass | ||||||||
| ABC | 242 | 105 | 1 | 1 | ||||
| GCB | 248 | 58 | 0.45 | 0.33-0.62 | 1.09e-06 | 0.55 | 0.40-0.76 | .00032 |
| UC | 96 | 34 | 0.73 | 0.50-1.08 | .11 | 0.71 | 0.48-1.05 | .089 |
| ABC-DLBCL | ||||||||
| miR-155 | ||||||||
| Low | 121 | 57 | 1 | — | ||||
| High | 121 | 48 | 0.78 | 0.53-1.14 | .20 | — | — | — |
| IPI | ||||||||
| 0-1 | 15 | 2 | 1 | — | ||||
| 2-3 | 125 | 38 | 3.57 | 0.86-14.89 | .080 | — | — | — |
| 4-5 | 102 | 65 | 10.37 | 2.51-42.87 | .0012 | — | — | — |
| GCB-DLBCL | ||||||||
| miR-155 | ||||||||
| Low | 124 | 41 | 1 | 1 | ||||
| High | 124 | 17 | 0.40 | 0.23-0.71 | .0017 | 0.46 | 0.26-0.81 | .0071 |
| IPI | ||||||||
| 0-1 | 48 | 2 | 1 | 1 | ||||
| 2-3 | 140 | 32 | 6.22 | 1.49-25.97 | .012 | 5.91 | 1.42-24.69 | .015 |
| 4-5 | 60 | 24 | 12.53 | 2.96-53.06 | .0006 | 11.10 | 2.61-47.15 | .0011 |
Array-based miR-155 expression and outcome were analyzed by simple and multiple Cox proportional hazards regression analyses for OS. IPI (international prognostic index) score information was not available for all patients, thus cohort sizes are reduced in this setting (115 samples were removed). MIR155HG expression was dichotomized by median split in each of the individual cohorts: all DLBCL patients, ABC-classified patients, and GCB-classified patients.
—, value not available because variables were only included in multiple Cox proportional hazards regression analysis if significant results were obtained in simple Cox proportional hazards regression analysis; CI, 95% lower and upper confidence intervals; HR, hazard ratio; n, number of samples; no., number of events.
In addition, multiple Cox proportional hazards regression analysis was conducted to test the prognostic value of miR-155 when combined with other prognostic tools of DLBCL. For multiple Cox regression analysis, independent variables were only included in the model if significant results were obtained when performing simple Cox regression analyses. The analysis revealed that the prognostic value of miR-155 was independent of the well-established international prognostic index in the GCB subclass, irrespective of dichotomized or continuous miR-155 expression (Table 1; supplemental Table 7). Thus, miR-155 identifies a subgroup with inferior prognosis among GCB-classified patients. In accordance, patients with stable or progressive disease at time of response evaluation43 display lower levels of miR-155 than patients in complete remission (supplemental Figure 11), supporting the association between low miR-155 expression and vincristine resistance.
Discussion
In a 2-step strategy, we defined miRNA involvement in vincristine resistance in DLBCL, first by elucidating the biological role of miRNAs in vincristine response by functional analysis and second by evaluating the biomarker potential in 2 independent R-CHOP-treated DLBCL cohorts. Identification of vincristine response-specific miRNAs documented miR-155 as highly expressed in vincristine-sensitive DLBCL cell lines, and functional validation confirmed a direct link between miR-155 expression and vincristine response in DLBCL cells. To compensate for cell line-specific biological effects, analyses were performed in 2 ABC and GCB-DLBCL cell lines, strengthening the biological interpretation. Induction of miR-155 increased vincristine sensitivity in GCB cells, with the strongest phenotype obtained in vincristine-resistant OCI-Ly7. The endogenous level of miR-155 is relatively low in OCI-Ly7, supporting significantly increased effect on vincristine response on induction. Only a complete knockout generated by indel introduction induced clear cellular resistance in OCI-Ly7, showing that TuD-155-directed reduction of already low miR-155 levels was not sufficient to cause phenotypic alterations. When applying similar approaches in ABC cells, no unambiguous association between miR-155 and vincristine response was observed. However, as a result of high endogenous miR-155 expression in ABC cells, it may be challenging to further increase miR-155 levels. In GCB cells, in contrast, lentiviral intervention altered the intracellular level of miR-155 independent of endogenous levels, suggesting a more stringent and complex regulation of miR-155 in ABC-DLBCL. Of notice, miR-155 is regulated by a feedback loop through NF-κB signaling, a pathway reported to be constitutively active in ABC-DLBCL.44,45
GSEA revealed that ectopic expression of miR-155 affected G2/M checkpoints and genes involved in mitotic spindle assembly. In accordance, the cell-cycle checkpoint gene WEE1 was inversely correlated with miR-155 in exogenously modified GCB-DLBCL cells, and in addition, induced levels of Wee1 protein were observed in miR-155 knockout clones. Although Wee1 is an experimentally verified target of miR-155,41 it has not previously been validated in DLBCL cells, which is of great importance, as affected targets vary depending on the cell type in which the miRNA is expressed.46
A study by Visconti et al.42 reported that the Fcp1-Wee1-Cdk1 axis controls spindle assembly checkpoints (SAC), which ensures proper chromosome segregation by delaying mitosis exit until mitotic spindle assembly.47 Antimicrotubule drugs, including vincristine, impede mitotic spindle assembly by targeting microtubules, leading to the activation of SAC and extension of mitosis, which promotes apoptosis.47,48 Resistance to these types of drugs has been related to the ability of cancer cells to slip through the SAC and exit mitosis prematurely, and thereby resist killing.48,49 Activation of Wee1 stimulates SAC slippage,42 suggesting that increased vincristine resistance mediated by miR-155 knockout could occur through upregulation of Wee1 and increased Wee1 signaling. However, it is important to emphasize that this study only addresses miR-155 signaling through Wee1. miR-155 could mediate vincristine resistance by regulating other targets as well, yet comprehensive target gene analysis was not the focus in this study.
Genetic and chemical inhibition of Wee1 strengthens the SAC, prolongs mitosis, and enhances killing of vincristine-treated acute lymphoblastic leukemia cells.42,50 In agreement, MK-1775, a chemical inhibitor of Wee1, boosted the effect of vincristine in GCB-DLBCL cells in this study. Interestingly, MK-1775 potentiated the cytotoxic effect of doxorubicin, another vital component of R-CHOP,51 supporting combination therapy of R-CHOP and MK-1775 in relapsed or refractory DLBCL.
miR-155 is involved in numerous processes that could affect drug response, including MAPK, PI3K/AKT, and RhoA signaling.52-55 In line, decreased miR-155 expression in epidermoid carcinoma cells increased cisplatin resistance by increasing the amount of Wee1 protein,56 similar to the mechanism of miR-155-induced vincristine resistance reported in this study. Furthermore, suppression of miR-155 was found to reverse doxorubicin resistance in lung cancer cells, whereas it did not affect the response in DLBCL cells, highlighting the tissue-specific effect of a particular miRNA.13,57 Whether miR-155 has an effect on other compounds of R-CHOP is unknown. However, rituximab exerts its action through CD20, whereas cyclophosphamide has alkylating properties and furthermore induces cytokine release, leading to antibody-mediated elimination,58 all of which are mechanisms differing from those of vincristine. Thus, miR-155 does most likely not affect rituximab and cyclophosphamide response through Wee1, but has the potential through other targets.
To evaluate the prognostic effect of miR-155, expression levels were analyzed for association with clinical outcome. It is noteworthy that the clinical outcome is a result of the entire R-CHOP regimen, and therefore, we investigated the prognostic potential of miR-155 regardless of its association to vincristine response. Investigation of the meta-cohort demonstrated decreased OS and PFS for patients with GCB-DLBCL with low MIR155HG expression. Notably, miR-155 identifies a subgroup of GCB-DLBCL with inferior clinical outcome comparable to ABC-classified patients. The beneficial effect of miR-155 on clinical outcome was a surprising observation when considering the commonly accepted perception of miR-155 as an oncomiR, yet documenting that the effect of a particular miRNA is dependent on the cell type in which it is expressed.
When examining the association between miR-155 and the ABC/GCB subclasses, it was confirmed that miR-155 is more expressed in ABC-DLBCL,19 which is in accordance with the role of miR-155 as an oncomiR, as ABC-classified patients have a dismal prognosis. Furthermore, clinical analysis revealed that miR-155 only displayed prognostic value within the GCB subclass, highlighting the molecular heterogeneity between the 2 molecular subclasses of DLBCL. These findings, in combination with the different functional effect of miR-155 on vincristine response in ABC and GCB cells, suggest that miR-155 affects different targets, depending on the cell of origin.
Contradictory to the beneficial effect of miR-155 observed in this study, Iqbal et al13 reported high miR-155 expression to be associated with R-CHOP treatment failure in DLBCL. However, unlike the current study, patients with DLBCL were divided according to survival risk and not miR-155 expression, and furthermore, without subtype-specific focus. In addition, by dichotomizing patients with DLBCL on miR-155 expression, Zhong et al59 documented inferior prognosis of patients with DLBCL with high miR-155 levels, whereas no prognostic stratification was observed in the study of Go et al.60 Yet, to the best of our knowledge, this is the first prognostic evaluation of miR-155 with a DLBCL subtype-specific focus, thereby taking the different pathogenesis of the molecular subclasses into consideration.
In conclusion, experimentally, we confirm a direct functional link between miR-155 expression and vincristine response in DLBCL. This role is supported by prognostic evaluation in 2 independent DLBCL cohorts treated with R-CHOP, documenting a significantly improved clinical outcome of GCB-classified patients with high miR-155 expression. The data suggest that the role of miR-155 on vincristine response is important enough to affect OS and PFS of patients with GCB-DLBCL treated with R-CHOP.
The full-text version of this article contains a data supplement.
Acknowledgments
The authors greatly appreciate the technical assistance from Louise Hvilshøj Madsen and Helle Høholt, Department of Hematology, Aalborg University Hospital, Aalborg, Denmark.
This study was supported by grants from The Danish Cancer Society and The North Region Research Foundation, Denmark.
Authorship
Contribution: H.D., A.S.R., and K.D. designed the research; H.D., M.X., X.T., Y.P., K.E.Y., and K.D. collected the data; H.D., L.R., M.N.P., D.S.J., and E.A.T. performed experiments; H.D., J.G.M., and K.D. optimized the experimental setup; H.D., A.A.S., and M.B. performed statistical analysis and generated the figures; H.D. wrote the paper; and all authors contributed to data interpretation and critically revised and approved the final manuscript.
Conflict-of-interest disclosure: The authors declare no competing financial interests.
Correspondence: Karen Dybkær, Department of Clinical Medicine/Aalborg University and Department of Hematology, Aalborg University Hospital, Sdr Skovvej 15, 9000 Aalborg, Denmark; e-mail: k.dybkaer@rn.dk.

