

Key Points
First external validation of the PRIMA-PI as a robust clinical tool to identify high-risk patients with symptomatic, advanced FL.
The PRIMA-PI has a higher specificity compared with the FLIPI and FLIPI-2 because of improved risk stratification in patients >60 years.

Abstract
The Follicular Lymphoma (FL) International Prognostic Index (FLIPI) and FLIPI-2 are well-described clinical risk models. Age >60 years at diagnosis is a risk factor in both scores. Recently, we showed that older age is not associated with higher risk of disease progression or inferior treatment efficacy. Instead, shorter survival of older patients results mainly from an increased risk of nonrelapse deaths. This questions the value of age as a meaningful component of scores intended to predict disease-specific survival. The newly proposed PRIMA-prognostic index (PRIMA-PI) only includes β2-microglobulin levels and bone marrow infiltration as risk factors. Here, we independently validate the PRIMA-PI in a clinical trial cohort of 475 patients with advanced FL who uniformly received cyclophosphamide, doxorubicin hydrochloride, vincristine sulfate, prednisone, and rituximab (R-CHOP) as frontline therapy. The PRIMA-PI separated 3 similar sized risk cohorts with 5-year progression-free survival (PFS) rates of 74%, 59%, and 39%, respectively (P < .0001). Furthermore, we compare the PRIMA-PI with the FLIPI and FLIPI-2. We demonstrate that the PRIMA-PI has the highest specificity to identify high-risk patients (80% for 5-year PFS) because of its superior risk stratification in patients >60 years (73% vs 33% [FLIPI] and 47% [FLIPI-2] for 5-year PFS). Thus, the PRIMA-PI is a promising clinical tool to stringently identify patients at highest risk of poor outcome after frontline R-CHOP for advanced FL, and is particularly useful in patients with older age. Further validation in non–R-CHOP treated cohorts is needed.
Introduction
Advanced follicular lymphoma (FL) is a heterogeneous but mostly indolent disease.1 However, there is an unmet medical need for about 20% of patients who have early progression of disease (POD) and short overall survival (OS).2,3 Several clinical risk models are available to predict OS and progression-free survival (PFS). Older age (ie, >60 years) is a component of the widely used FL International Prognostic Index (FLIPI), and the subsequently established FLIPI-2.4,5 However, we recently showed that tumors from older patients are not enriched for gene mutations that are associated with high-risk disease. Furthermore, we demonstrated that standard immunochemotherapy is equally effective in older patients, and that their shorter survival results mainly from an increased rate of nonrelapse deaths.6 This questions the role of age as a meaningful component of prognostic indices intended to predict disease-specific survival and guide tailored treatment approaches. Recently, a novel age-independent risk classifier has been proposed. The so-called PRIMA-prognostic index (PRIMA-PI) includes only β2-microglobulin levels (>3 mg/dL) and bone marrow infiltration, and was designed to predict PFS for patients with advanced FL in need of systemic treatment.7 An independent validation of this tool and a head-to-head comparison with other risk models, in particular with the FLIPI-2, are desired.8 Here we report an external validation of the PRIMA-PI and compare its performance to the FLIPI and FLIPI-2. In addition, we analyze the performance of the 3 scores across different age groups.
Methods
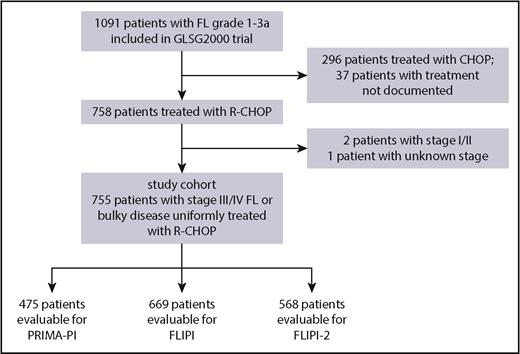
The study cohort was derived from the GLSG2000 trial9 of the German Low Grade Lymphoma Study Group. Within this trial, patients were initially randomized to either cyclophosphamide, doxorubicin hydrochloride, vincristine sulfate, and prednisone (CHOP) or CHOP plus rituximab (R). After randomization was stopped, additional patients were assigned to R-CHOP treatment.10 For this study, we included 755 patients with grade 1-3A FL with stage III/IV disease or localized disease considered ineligible for curative radiotherapy, who were in need of treatment and received R-CHOP as frontline treatment (Figure 1; supplemental Tables 1 and 2A-C).6 The median follow-up for OS for this cohort was 6.0 years (95% confidence interval [CI], 5.6-6.3). R maintenance was not part of the study treatment. Patients who received consolidative autologous stem cell transplantation were censored at the time of transplant. The study was carried out in accordance with the modified Declaration of Helsinki. The trial was approved by the institutional review board, and all participants gave written informed consent. The primary end point of this study was PFS (ie, the end point the PRIMA-PI was developed for). PFS events included progression, relapse, and death. PFS and OS were calculated from time of treatment initiation. POD was defined as previously described3 and included relapse, progression, and refractory disease at the end of induction treatment. The PRIMA-PI was calculated as previously described.7
Statistical analyses were carried out with the statistical software R (version 3.5.1) using the packages survival_2.42-6, prodlim_2018.04.18, and ggplot2_3.0.0. The Kaplan-Meier method was used to describe time-to-event end points. Sensitivity and specificity of risk scores for time-to-event end points were estimated with the inverse probability of censoring weighting approach (R package timeROC_0.3). The c-index was calculated with the R package survcomp_1.3.
Results
First, we aimed to independently validate the PRIMA-PI. A total of 475 patients representative of the entire study cohort were evaluable for PRIMA-PI (Figure 1; supplemental Table 1; supplemental Figure 1). The score separated 3 cohorts composing 31% (148/475), 39% (186/475), and 30% (141/475) of patients with a 5-year PFS of 74% (95% CI, 66-83), 59% (95% CI, 51-69), and 39% (95% CI, 30-50), respectively (P < .0001; Figure 2). The 5-year OS rates for the 3 PRIMA-PI cohorts were 89% (95% CI, 84-96), 94% (95% CI, 90-98), and 72% (95% CI, 63-81), respectively (P < .0001; supplemental Figure 2).
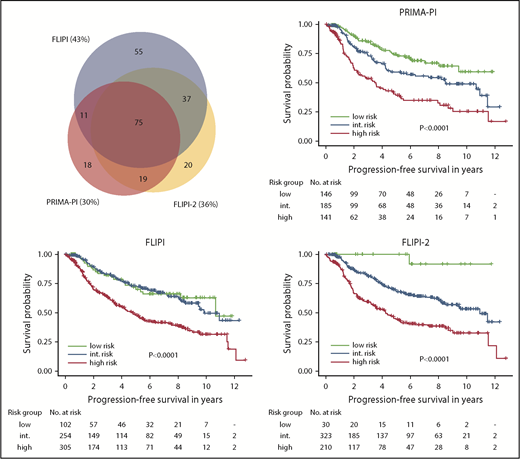
PFS according to PRIMA-PI, FLIPI, and FLIPI-2. Kaplan-Meier curves showing PFS of risk cohorts defined by the 3 scores. Log-rank P values are shown in the graph. Sizes and relations of high-risk cohorts identified by the 3 scores are shown by a scaled Venn diagram (only patients evaluable for all scores). int., intermediate.
PFS according to PRIMA-PI, FLIPI, and FLIPI-2. Kaplan-Meier curves showing PFS of risk cohorts defined by the 3 scores. Log-rank P values are shown in the graph. Sizes and relations of high-risk cohorts identified by the 3 scores are shown by a scaled Venn diagram (only patients evaluable for all scores). int., intermediate.
Next, we compared the PRIMA-PI with the FLIPI and FLIPI-2, focusing on their performances to identify high-risk patients. The high-risk cohorts identified by FLIPI, FLIPI-2, and PRIMA-PI comprised 46% (307/669), 37% (211/568), and 30% (141/475) of patients, respectively (supplemental Table 2A; Figure 2). The 5-year PFS rates of the high-risk cohorts as defined by FLIPI, FLIPI-2, and PRIMA-PI were 48% (95% CI, 42-55), 44% (95% CI, 37-53), and 39% (95% CI, 30-50) (Figure 2); the 5-year OS rates were 79% (95% CI, 74-84), 78% (95% CI, 72-84), and 72% (95% CI, 63-81), respectively (supplemental Figure 2). The FLIPI had the highest sensitivity (66% for 5-year PFS and 75% for 5-year OS), whereas the PRIMA-PI had the highest specificity (80% for 5-year PFS and 77% for 5-year OS; Table 1). The subset of patients with high-risk FLIPI, FLIPI-2, and PRIMA-PI experiencing POD within 24 months was 28% (68/241), 35% (60/172), and 39% (39/99), respectively (supplemental Figure 3). C-indexes for the 3 scores were similar for PFS (FLIPI, 0.72; standard error [SE], 0.03; FLIPI-2, 0.73 [SE, 0.03]; and PRIMA-PI, 0.73 [SE, 0.03]) and OS (FLIPI, 0.77 [SE, 0.04]; FLIPI-2, 0.78 [SE, 0.04], and PRIMA-PI, 0.77 [SE, 0.05]; Table 1).
Performance metrics of PRIMA-PI, FLIPI, and FLIPI-2
| All patients | Patients ≤60 y | Patients >60 y | |||||||
|---|---|---|---|---|---|---|---|---|---|
| PRIMA-PI | FLIPI | FLIPI-2 | PRIMA-PI | FLIPI | FLIPI-2 | PRIMA-PI | FLIPI | FLIPI-2 | |
| High-risk patients, n (%) | 141/475 (30) | 307/669 (46) | 211/568 (37) | 79/316 (25) | 119/422 (28) | 79/364 (22) | 62/159 (39) | 188/247 (76) | 132/204 (65) |
| PFS | |||||||||
| Patients evaluable, n | 472 | 661 | 563 | 313 | 416 | 359 | 159 | 245 | 204 |
| 5-y PFS (95% CI), % | 39 (30-50) | 48 (42-55) | 44 (37-53) | 50 (36-69) | 50 (39-63) | 52 (39-69) | 31 (21-46) | 47 (40-55) | 42 (34-52) |
| Sensitivity (SE), % | 43 (4.3) | 66 (3.5) | 58 (3.9) | 32 (6.0) | 42 (5.4) | 30 (5.3) | 53 (5.8) | 84 (3.5) | 82 (4.2) |
| Specificity (SE), % | 80 (3.3) | 60 (3.3) | 68 (3.4) | 84 (3.9) | 79 (3.5) | 83 (3.6) | 73 (5.7) | 33 (4.8) | 47 (5.5) |
| c-index (SE) | 0.73 (0.03) | 0.72 (0.03) | 0.73 (0.03) | 0.72 (0.06) | 0.74 (0.04) | 0.71 (0.05) | 0.71 (0.05) | 0.65 (0.06) | 0.75 (0.05) |
| OS | |||||||||
| Patients evaluable, n | 475 | 669 | 568 | 316 | 422 | 364 | 159 | 247 | 204 |
| 5-y OS (95% CI), % | 72 (63-81) | 79 (74-84) | 78 (72-84) | 84 (73-97) | 83 (75-92) | 85 (75-96) | 61 (50-76) | 76 (70-83) | 75 (67-83) |
| Sensitivity (SE), % | 59 (7.3) | 75 (5.3) | 72 (6.3) | 43 (13.3) | 57 (10.8) | 44 (12.5) | 67 (8.3) | 83 (5.4) | 84 (6.2) |
| Specificity (SE), % | 77 (2.8) | 54 (2.7) | 63 (2.8) | 80 (3.5) | 73 (3.2) | 80 (3.1) | 72 (4.6) | 29 (3.7) | 41 (4.4) |
| c-index (SE) | 0.77 (0.05) | 0.77 (0.04) | 0.78 (0.04) | 0.71 (0.10) | 0.75 (0.07) | 0.68 (0.10) | 0.74 (0.06) | 0.65 (0.07) | 0.74 (0.07) |
Finally, we separately analyzed the performances of the 3 risk scores in younger (≤60 years) and older patients (>60 years). Although the FLIPI, FLIPI-2, and PRIMA-PI classified similar sized fractions of patients as high risk in younger patients (28% [119/422] vs 22% [79/364] vs 25% [79/316]), the fractions of patients classified as high risk by either risk score differed in older patients: 76% (188/247) vs 65% (132/204) vs 39% (62/159), respectively (supplemental Table 2B-C; Figure 3). Likewise, PFS and OS of patients classified as high risk by either risk score were not different in younger patients: the 5-year PFS rates were 50% (95% CI, 39-63), 52% (95% CI, 39-69), and 50% (95% CI, 36-69) for high-risk FLIPI, FLIPI-2, and PRIMA-PI; the 5-year OS rates were 83% (95% CI, 75-92), 85% (95% CI, 75-96) and 84% (95% CI, 73-97), respectively. In contrast, in older patients, PFS and OS differed for those classified as high risk by the different risk scores: the 5-year PFS rates were 47% (95% CI, 40-55), 42% (95% CI, 34-52), and 31% (95% CI, 21-46) for high-risk FLIPI, FLIPI-2, and PRIMA-PI; the 5-year OS rates were 76% (95% CI, 70-83), 75% (95% CI, 67-83), and 61% (95% CI, 50-76), respectively (Figure 3; supplemental Figure 4). Finally, the specificities of the FLIPI, FLIPI-2, and PRIMA-PI were similar in younger patients: 79%, 83%, and 84% for 5-year PFS, and 73%, 80%, and 80% for 5-year OS, respectively. In contrast, the specificity of the FLIPI, FLIPI-2, and PRIMA-PI largely differed for older patients: 33%, 47%, and 73% for 5-year PFS, and 29%, 41%, and 72% for 5-year OS, respectively (Table 1).
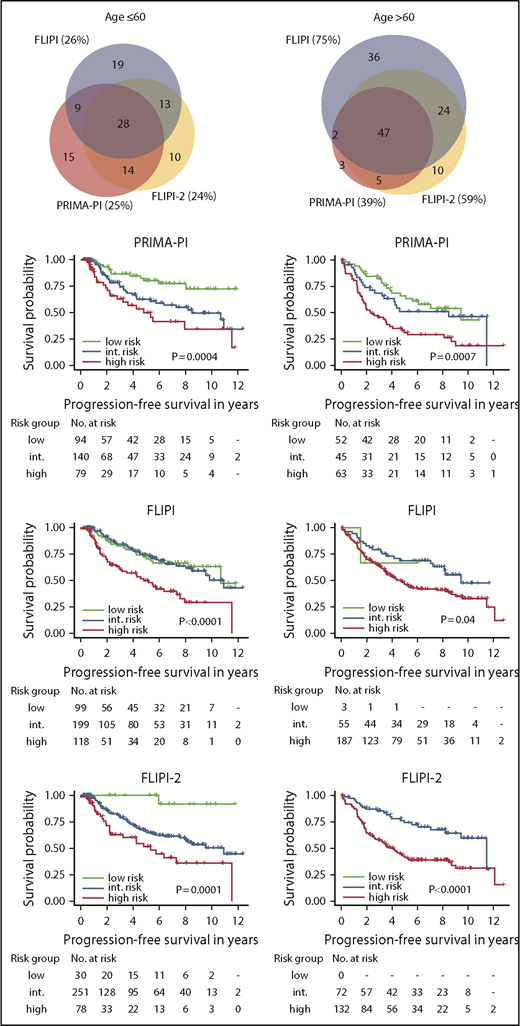
PFS according to the PRIMA-PI, FLIPI, and FLIPI-2 by age. Kaplan-Meier curves showing PFS of risk cohorts defined by the 3 scores for patients ≤60 years (left) and >60 years (right). Log-rank P values are shown in the graph. Sizes and relations of high-risk cohorts identified by the 3 scores are shown by a scaled Venn diagram (only patients evaluable for all scores).
PFS according to the PRIMA-PI, FLIPI, and FLIPI-2 by age. Kaplan-Meier curves showing PFS of risk cohorts defined by the 3 scores for patients ≤60 years (left) and >60 years (right). Log-rank P values are shown in the graph. Sizes and relations of high-risk cohorts identified by the 3 scores are shown by a scaled Venn diagram (only patients evaluable for all scores).
Discussion
The PRIMA-PI is the first risk score specifically designed to predict PFS in patients with advanced FL in need of systemic treatment.7 Here, we independently and externally validate the PRIMA-PI in a cohort of patients with symptomatic, advanced FL who uniformly received R-CHOP as frontline treatment. Our results confirm the findings of the original publication demonstrating that the PRIMA-PI separates 3 similar sized risk groups with distinct PFS. However, also similar to the original publication, there was no significant difference for OS for the low- and intermediate-risk cohort.
This is the first study to directly compare the PRIMA-PI with both the FLIPI and the FLIPI-2. We find that the PRIMA-PI classified the smallest fraction of patients as high risk and had the highest specificity among the 3 clinical risk scores. Stringent (eg, with high specificity) identification of patients at highest risk of poor outcome with standard frontline immunochemotherapy is a major medical need, as we aim to optimize treatment approaches for this smaller subgroup, while avoiding overtreatment and excess toxicity for the larger subgroup of patients with truly indolent disease.
On the other hand, risk scores may also be used to identify patients with favorable treatment outcome who could be candidates to de-escalate therapy (eg, the FLIPI-2 identifies a small low-risk group with outstanding PFS and OS after standard R-CHOP). Unfortunately, the subgroup of patients who may benefit most from less toxic therapies, that is, older patients with low-risk disease, cannot be identified by the FLIPI-2 because of its design.
Because the FLIPI and FLIPI-2 contain age >60 years as a risk factor, we separately analyzed the performances of the 3 scores for patients ≤60 and >60 years. While the fraction of patients classified as high risk, their 5-year PFS and 5-year OS rates were essentially identical for the 3 risk scores in younger patients; both the FLIPI and FLIPI-2 clearly overestimated the number of high-risk patients in older patients. The specificities of the FLIPI and FLIPI-2 for 5-year PFS and 5-year OS were <50%, clearly limiting their clinical utility in patients >60 years. In contrast, the PRIMA-PI is an age-independent tool and identified a much smaller cohort as high risk (<40% of patients), thereby maintaining a high specificity for 5-year PFS and 5-year OS (>70%).
Importantly, our study cohort only partially reflects real-world FL patients. All our patients were considered eligible to receive R-CHOP, thereby selecting for younger and medically fit patients. Thus, additional validation of the PRIMA-PI in other cohorts, including patients who receive the now widely used bendamustine-containing regimens is needed.
In addition to the robust performance of the PRIMA-PI across different age cohorts, the remarkable simplicity of this risk score will facilitate its use in prospective clinical trials and eventually in clinical routine. Furthermore, the PRIMA-PI is a promising backbone for more comprehensive risk models integrating molecular and tumor biological factors.11,12
In conclusion, the novel age-independent clinical risk classifier PRIMA-PI is a simple and robust clinical tool to stringently identify a subgroup of patients at highest risk of poor outcome after immunochemotherapy for symptomatic, advanced FL. Compared with the FLIPI and FLIPI-2, the PRIMA-PI has the highest specificity to identify high-risk patients because of its improved risk stratification in patients >60 years. Thus, the PRIMA-PI is a promising clinical tool to select high-risk patients who should be prioritized for nonstandard therapies within clinical trials.
The full-text version of this article contains a data supplement.
Acknowledgments
This work was supported by a Dr. Mildred Scheel postdoctoral fellowship of the Deutsche Krebshilfe (57406718) (S.A.), the Max-Eder Program of the Deutsche Krebshilfe (110659) (O.W.), and the Deutsche Forschungsgemeinschaft (DFG-SFB/CRC-1243, TP-A11) (O.W.).
Authorship
Contribution: S.A. and O.W. designed and performed the research, analyzed data, and drafted the manuscript; V.J., A.P., and E.H. performed and oversaw statistical analyses; S.H., C.S., A.-K.Z., and M.U. were involved in collecting and analyzing clinical data; and M.D. and W.H. supervised the study and contributed to the preparation of the manuscript.
Conflict-of-interest disclosure: The authors declare no competing financial interests.
Correspondence: Oliver Weigert, Department of Medicine III, University Hospital, Ludwig-Maximillans-Universität Munich, Laboratory for Experimental Leukemia and Lymphoma Research, Max-Lebsche Platz 30, 81377 Munich, Germany; e-mail: oliver.weigert@med.uni-muenchen.de.

