

Key Points
NPM1 mutations are rare in MDS and MDS/MPN and appear as dominant and stable events through the disease course.
Intensive chemotherapy and allogeneic SCT are associated with improved outcomes in selected patients with NPM1-mutant MDS or MDS/MPN.

Abstract
Nucleophosmin (NPM1) mutations are common in acute myeloid leukemia and are associated with high remission rates and prolonged survival with intensive chemotherapy. NPM1 mutations are rare in myelodysplastic syndromes (MDS) or myelodysplastic/myeloproliferative neoplasm (MDS/MPN), and the clinical outcomes of these patients, when treated with intensive chemotherapy, are unknown. We retrospectively evaluated the clinicopathologic characteristics and the impact of therapy in 31 patients with MDS or MDS/MPN and NPM1 mutations. Next-generation sequencing was performed at diagnosis in 22 patients. Median age was 62 years (range, 19-86). Twenty-four patients (77%) had normal karyotype, and all had multilineage dysplasia. Most patients could be classified as MDS with excess blasts (19/31, 61%). NPM1 mutations were detected at a median allele frequency of 0.38 (range, 0.09-0.49). Mutation burden did not correlate with bone marrow blast frequency, and its clearance seemed to be associated with decreased morphologic dysplasia. Ten of the 31 patients (32%) received cytotoxic chemotherapy, 20 (65%) hypomethylating agents, and 1 (4%) lenalidomide. Sequential sequencing was available in 16 (52%) patients, and mutation burden correlated with disease status and response to therapy. Patients treated with chemotherapy had higher complete response rates (90% vs 28%, P = .004), longer median progression-free survival (not reached vs 7.5 months, P = .023), and overall survival (not reached vs 16 months, P = .047). Intensive chemotherapy and allogeneic stem cell transplantation (SCT) may be associated with improved clinical outcomes in patients with NPM1-mutated MDS or MDS/MPN who are candidates for this form of therapy.
Introduction
Nucleophosmin 1 (NPM1) is a nucleocytoplasmatic chaperone involved in multiple protein–protein interactions and cell functions.1 Mutations in NPM1 are detected in 20% to 30% of patients with acute myeloid leukemia (AML), as well as in 50% to 60% of patients with AML with normal karyotype,2 and are usually stable during disease evolution. The presence of NPM1 mutations in AML is associated with distinct clinical-pathological features2 and favorable outcomes when treated with intensive chemotherapy,3 particularly in the absence of cooccurring DNTM3A and FLT3-ITD mutations, with NPM1-mutated AML being considered a distinct subtype of AML in the revised 2017 World Health Organization (WHO) subclassification. In vitro studies support the greater chemosensitivity of NPM1-mutated compared with NPM1–wild-type leukemic blasts.4 In contrast, the frequency of NPM1 mutations in patients with a diagnosis of myelodysplastic syndrome (MDS) or myelodysplastic/myeloproliferative neoplasm(MDS/MPN)5 is low, ranging from 0% to 9%,6-8 with an overall frequency of 2%.8 Most of these are reported as small case series. NPM1-mutated MDS and MDS/MPN patients have an aggressive clinical course, with a high rate of AML transformation.8 However, the outcomes of these patients with different treatment modalities, including intensive chemotherapy, have not been defined. In addition, the mutational dynamics through disease evolution in these patients is not understood.
Although the distinction between AML and MDS is arbitrarily defined at 20% blasts, treatment decisions in the clinic are based, in part, based on this threshold. Hence, it is important to understand this subgroup of MDS because it is biologically plausible that they are more akin to AML, regardless of blasts percentage. Although NPM1 mutations do not define AML,9 previous groups have suggested that NPM1 mutations in myeloid neoplasms may warrant classification as AML, even in the presence of <20% bone marrow (BM) blasts8 ; however, there are no robust molecular or clinical data to support such a classification.
In this study, we evaluated the histopathological, mutational, and clinical features of our cohort of patients with NPM1-mutated MDS. We then evaluated whether the presence of mutations in NPM1 similarly predicts favorable outcomes with chemotherapy in patients with MDS. This analysis includes the largest series of NPM1-mutated MDS and MDS/MPN patients reported thus far and suggests that the presence of NPM1 mutations in these patients may be associated with similar features to AML and improved outcomes when treated with cytotoxic chemotherapy.
Materials and methods
Patients and samples
We evaluated a total of 31 patients with newly diagnosed NPM1-mutated MDS or MDS/MPN treated from 2009 until 2018. All cases were reviewed by 2 hematopathologists and were diagnosed using the 2008 or 2016 WHO criteria. Six-color multiparametric flow cytometry was used to evaluate the immunophenotype of blasts at diagnosis. Additional multiparametric flow cytometry evaluating hematopoietic progenitor (CD34+/CD38+) and hematopoietic stem cell (HSC; CD34+/CD38−) compartments, as previously reported,10 was performed in 1 patient (supplemental Methods). Conventional karyotyping was performed on fresh BM aspirate using standard procedures and reported following the International System for Human Cytogenetic Nomenclature 2013. Patients were classified using the revised 2016 WHO classification.9 Prognostic risk was calculated using the International Prognostic Scoring System (IPSS)11 and revised IPSS (IPSS-R).12
Targeted gene-sequencing analysis
Genomic DNA was extracted from whole BM aspirate samples at the time of diagnosis. Detection of NPM1 mutations was performed prospectively by polymerase chain reaction (PCR), followed by fragment sizing using capillary electrophoresis/GeneScan on patients evaluated from 2009 to 2012 and by targeted amplicon-based next-generation sequencing (NGS) using 28, 53, or 81 gene panels, as previously described,13 in patients evaluated from 2012 to 2018. This analysis was performed within the University of Texas MD Anderson Cancer Center Clinical Laboratory Improvement Amendments–certified Molecular Diagnostics Laboratory at the Department of Hematopathology after informed consent (additional details can be found in supplemental Methods). For NGS-based analysis, the limit of detection for variant calling was 2%. Previously described somatic mutations registered in the Catalogue of Somatic Mutations in Cancer (http://cancer.sanger.ac.uk/cosmic) were considered potential driver mutations.
In addition, PCR-based DNA analysis was performed to detect internal tandem duplications and codon 835/836 point mutation in FLT3 in all patients. Multiplex PCR using fluorescently labeled primers was performed, followed by detection and sizing of PCR products using capillary electrophoresis. For detecting point mutations in codons 835/836, restriction enzyme digestion of the PCR products was performed prior to capillary electrophoresis. The lower limit of detection (analytical sensitivity) of this assay was ∼1% of mutant DNA in a background of wild-type DNA. The ratio of the area under the peak of mutant over total (mutant + wild-type) FLT3 was used to determine the mutant allele burden. Response was defined following 2006 International Working Group criteria.14
Statistical analysis
Generalized linear models were used to study the association of overall response rates (ORRs), complete response (CR), and risk factors. Overall survival (OS) was calculated as the number of months from MDS diagnosis to death or last follow-up. Time to transformation was calculated as the number of months from MDS diagnosis to transformation to leukemia. Progression-free survival (PFS) was calculated as the number of months from MDS diagnosis to disease relapse or progression/transformation to leukemia. Patients who were alive at their last follow-up were censored on that date. The Kaplan-Meier product limit method! was used to estimate the median OS, PFS, and time to leukemia transformation. Univariate Cox proportional hazards were used to identify the association between survival and potential risk factors. Statistical analysis was performed using SPPS version 22 statistical software (IBM).
Results
Clinical characteristics of patients with NPM1-mutated MDS
A total of 1900 patients with newly diagnosed MDS or MDS/MPN was evaluated between 2009 and 2018. Among these, 31 (1.6%) had detectable NPM1 mutations. Patient characteristics are detailed in Table 1. Median age was 62 years (range, 19-86). By IPSS criteria, 1 patient (3%) was classified as low risk, 1 (3%) as intermediate-1, 16 (52%) as intermediate-2, and 13 (42%) as high-risk. According to IPSS-R, 13 (42%) were classified as intermediate risk, 12 (39%) as high risk, and 6 (19%) as very high risk. Six (19%) patients had chronic myelomonocytic leukemia (CMML), 3 (10%) had MDS/MPN unclassifiable, and the remaining had MDS, including 1 patient with MDS with isolated del(5q). Most patients were classified as MDS with excess blasts (MDS-EB; 19/31, 61%), with 3 (10%) being classified as MDS-EB-1 and 16 (52%) being classified MDS-EB-2. The median BM blast percentage was 10% (range 0% to 19%). Twenty-four (77%) patients had normal karyotype. Characteristics of individual patients are detailed in supplemental Table 1. Ten patients had a second BM aspiration performed after the initial diagnostic BM procedure and prior to treatment start, within a median of 22 days (range, 6-49). An increase in BM blast percentage between the 2 time points was only observed in 2 patients, and blast percentage remained <20% in all patients (supplemental Figure 1). To determine whether patients with NPM1-mutated MDS have distinct clinical features, we compared their clinical characteristics with those of 558 NPM1 wild-type MDS or MDS/MPN patients evaluated during the same time period and in whom the same NGS panels were used as the sequencing platform (supplemental Table 2). Patients with NPM1-mutated MDS were younger (median age, 62 vs 69 years, P < .001), more likely to be female (55% vs 33%, P = .02), had lower hemoglobin (8.7 vs 9.9 g/dL, P = .001), had higher median BM blast percentage at diagnosis (10% vs 4%, P < .001), and had a higher frequency of normal karyotype (81% vs 47%, P < .001) compared with NPM1 wild-type patients.
Clinical characteristics of patients with myelodysplastic syndromes and NPM1 mutations
| Variable | Total population (N = 31) | Treated with HMAs (n = 20) | Treated with chemotherapy (n = 10) | P |
|---|---|---|---|---|
| Age, mean (SD), y | 62 (19-86) | 65 (32-86) | 52 (19-71) | .026 |
| Males, n (%) | 13 (42) | 11 (55) | 2 (20) | .074 |
| Hemoglobin, mean (SD), g/dL | 8.7 (8.2-9.2) | 8.6 (7.8-9.2) | 8.9 (8.1-9.9) | .387 |
| WBC, mean (SD), × 109/L | 7.9 (4.5-11.3) | 6.9 (4.0-9.7) | 10.4 (0.7-20.1) | .339 |
| Platelets, mean (SD), × 109/L | 85 (63-107) | 97 (64-129) | 65 (34-95) | .202 |
| ANC, mean (SD), × 109/L | 2.9 (0.5-5.2) | 2.5 (0.9-4.0) | 3.9 (0.2-11.3) | .570 |
| Median PB blasts, mean (SD), % | 1 (0-16) | 1 (0-14) | 2 (0-16) | .785 |
| Median BM blasts, mean (SD), % | 10 (0-19) | 10 (0-17) | 14 (4-19) | .076 |
| WHO diagnosis, n (%) | .500 | |||
| MDS-EB-1 | 3 (10) | 3 (15) | 0 (0) | |
| MDS-EB-2 | 16 (52) | 9 (45) | 7 (70) | |
| MDS del(5q) | 1 (3) | 0 (0) | 0 (0) | |
| MDS/MPN-U | 2 (6) | 1 (5) | 1 (10) | |
| aCML | 1 (3) | 0 (0) | 1 (10) | |
| CMML-0 | 1 (3) | 1 (5) | 0 (0) | |
| CMML-1 | 2 (6) | 2 (10) | 0 (0) | |
| CMML-2 | 3 (10) | 2 (10) | 1 (10) | |
| T-MDS* | 2 (6) | 1 (5) | 0 (0) | |
| IPSS, n (%) | .399 | |||
| Low | 1 (3) | 1 (5) | 0 (0) | |
| Intermediate-1 | 1 (3) | 0 (0) | 1 (10) | |
| Intermediate-2 | 16 (52) | 11 (55) | 4 (40) | |
| High | 13 (42) | 8 (40) | 5 (50) | |
| IPSS-R, n (%) | .577 | |||
| Intermediate | 13 (42) | 8 (40) | 4 (40) | |
| High | 12 (39) | 9 (45) | 3 (30) | |
| Very high | 6 (19) | 3 (15) | 3 (30) | |
| Karyotype, n (%) | .306 | |||
| Normal | 24 (77) | 16 (80) | 8 (80) | |
| del(5q) | 1 (3) | 0 (0) | 0 (0) | |
| Complex† | 1 (3) | 1 (5) | 0 (0) | |
| del(9q) | 2 (7) | 2 (10) | 0 (0) | |
| del(20q) | 1 (3) | 0 (0) | 1 (10) | |
| Trisomy 21 | 1 (3) | 1 (5) | 0 (0) | |
| Not available | 1 (3) | 0 (0) | 1 (10) | |
| Transplant, n (%) | 13 (42) | 6 (30) | 7 (70) |
One patient was treated with single-agent lenalidomide and is included only in the total population.
aCML, atypical chronic myeloid leukemia; ANC, absolute neutrophil count; HMAs, hypomethylating agents; MDS-U, MDS unclassifiable; PB, peripheral blood; SD, standard deviation; T-MDS, therapy-related MDS; WBC, white blood cell count.
Of the 2 patients with T-MDS, both were classifiable as MDS with multilineage dysplasias.
Complex, defined as the presence of ≥3 abnormalities.
Ten of the 31 patients (32%) received cytotoxic chemotherapy, 20 (65%) hypomethylating agents, and 1 (4%) lenalidomide. Specific treatment regimens are shown in supplemental Table 1 and included fludarabine, idarubicin, and cytarabine in 2 patients; cladribine, idarubicin, and cytarabine in 3 patients; fludarabine and cytarabine in 2 patients; idarubicin and cytarabine in 2 patients; and cytarabine, daunarubicin, and etoposide in 1 patient. Patients treated with chemotherapy were younger (median, 52 vs 65 years, P = .026) and had a nonsignificant trend toward having a higher BM blast percentage (median, 14% vs 10%, P = .076) compared with those treated with HMA therapy. The median time from diagnosis to treatment initiation was 15 days (range, 2-116). A total of 13 patients (42%) underwent allogeneic stem cell transplantation, including 7 patients treated with chemotherapy and 6 treated with HMAs. With a median follow-up of 17.6 months (range, 1-106), the median OS of these patients was 25.7 months (95% confidence interval [CI], 15.2-36.1; supplemental Figure 2), and the median PFS was 13.9 months (95% CI, 7.9-19.8; supplemental Figure 3). A total of 12 patients experienced transformation to AML after a median of 14 months (range, 7-34 months). All 12 patients still had the presence of the same NPM1 mutation. Among these, 9 had received therapy with HMAs, 1 had received lenalidomide, and 2 had received chemotherapy. First salvage therapy in patients who experienced relapse or transformation after initial therapy included chemotherapy in 4 (33%) and 1 (14%) patients, investigational agents in 2 (17%) and 1 (14%) patients, and HMA therapy in 2 (17%) and 1 (14%) patients treated with HMAs (n = 12) and chemotherapy (n = 7), respectively.
Morphological and immunophenotypic features of NPM1-mutated MDS
We performed a detailed evaluation of morphological and immunophenotypic features to assess dysplastic features and blast percentage independently by 2 investigators. In all cases, peripheral blood smears showed anisopoikilocytosis, dysgranulopoiesis, and anisocytosis of platelets. Elevated monocytes (>10% of cells) were seen in 10 (32%) patients; 6 patients had absolute monocytosis. Circulating blasts were present in 19 patients (61%) (median, 1%; range, 0-16). The BM was hypercellular in all cases (median cellularity, 95%; range, 30-100). Dysplasia (in >10% of cells) was observed in granulocytic precursors (30/30), erythroid precursors (28/29), and megakaryocytes (25/25) when there were sufficient cells for evaluation (supplemental Figure 4). The median BM monocytes was 7% (range, 1-23). At the time of initial presentation, the median BM blast percentage was 10% (range, 0-19). Three patients (10%) had blasts with Auer rods, causing 1 patient to be diagnosed with MDS-EB-2. Using the 2016 WHO classification, 22 patients were classified as having MDS (1 MDS with isolated del(5q), 3 MDS-EB-1, 16 MDS-EB-2, and 2 therapy-related myeloid neoplasms], and 9 patients were classified as having MDS/MPN, 6 of whom met the criteria for CMML. The remaining 3 MDS/MPN patients had elevated monocytes without absolute monocytosis: 1 met the criteria for atypical CML, and 2 were categorized as MDS/MPN unclassifiable; these could also be regarded as so-called “oligomonocytic chronic myelomonocytic leukemia” (chronic myelomonocytic leukemia without absolute monocytosis). None of these progressed to CMML until treatment initiation. Among patients with CMML, 3 had the proliferative type, and 3 had the dysplastic type.
By flow cytometry, all cases showed changes in the CD34+ aberrant cells, compatible with an underlying MDS or MDS/MPN. The blasts showed a typical myeloid immunophenotype with expression of CD13, HLA-DR, CD33, CD117, and CD38 and no expression of CD14. Expression of CD34 was observed in 21 (67%) patients. Monocytes exhibited CD56 expression in 4 of 28 patients evaluated.
To evaluate abnormalities in hematopoiesis and lineage differentiation, BM hematopoietic stem and progenitor cell (HSPC) and HSC population analyses were available in 1 patient (UPN19). Among the CD34+/CD38+ BM progenitor compartment, an increase in the frequency of granulo-monocytic progenitors (GMPs), a marked decrease in megakaryocytic-erythroid progenitors, and a mild reduction in common myeloid progenitors were observed, consistent with a GMP pattern of progenitor distribution (supplemental Figure 4), as has been previously reported in MDS10 and AML.15
Mutational landscape of NPM1-mutated MDS
Twenty-two patients underwent targeted NGS using a multigene NGS panel. The remaining patients underwent NPM1 mutation analysis by PCR/capillary electrophoresis. The mutational profiles of all patients are shown in Figures 1 and 2. Mutations in genes other than NPM1 were observed in 18 patients in whom NGS was available. FLT3 mutations were observed in 3 patients.


Variant allele frequencies (VAFs) of identified mutations in patients with NPM1-mutated MDS and MDS/MPN. Clonal composition, including the VAF of each individual driver mutation, identified within patients with NPM1-mutated MDS and MDS/MPN with available NGS data and ≥1 additional detectable mutation. Median VAF of NPM1 mutations is 0.38 (range, 0.09-0.49), with NPM1 mutations appearing in major clones in all patients with the exception of UPN 4, UPN 22, and UPN 25, as observed. *Patient had normal karyotype by conventional karyotyping.
Variant allele frequencies (VAFs) of identified mutations in patients with NPM1-mutated MDS and MDS/MPN. Clonal composition, including the VAF of each individual driver mutation, identified within patients with NPM1-mutated MDS and MDS/MPN with available NGS data and ≥1 additional detectable mutation. Median VAF of NPM1 mutations is 0.38 (range, 0.09-0.49), with NPM1 mutations appearing in major clones in all patients with the exception of UPN 4, UPN 22, and UPN 25, as observed. *Patient had normal karyotype by conventional karyotyping.
NPM1 mutations, in patients in whom NPM1 sequencing was obtained by NGS, involved codon 288 (W288fs) in exon 11 in 20 patients, codon 290 (W290fs) in exon 11 in 1 patient, and codon 269 (I269fs) in exon 11 in 1 patient. Detected NPM1 mutations were present with a median variant allele frequency (VAF) of 0.38 (range, 0.09-0.49). In 26 (84%) patients, NPM1 mutation was present at a VAF ≥0.2. Identified mutations and their VAFs at the time of diagnosis for each patient in whom additional mutations were identified are detailed in Figure 2.
There was no correlation between NPM1 VAF and BM or peripheral blood blast percentage (Figure 3).
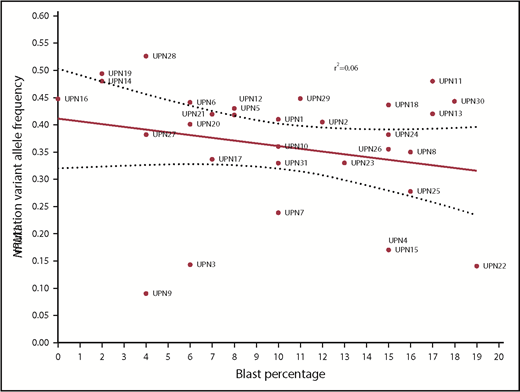
Correlation between BM blast percentage and VAF of NPM1 mutations at the time of diagnosis.
Correlation between BM blast percentage and VAF of NPM1 mutations at the time of diagnosis.
Clinical outcomes of patients with NPM1-mutated MDS based on treatment modality
A total of 30 patients with NPM1-mutated MDS was treated with induction chemotherapy or HMAs. Two patients were not evaluable for response: 1 as a result of early 4-week mortality and 1 lost to follow-up. Responses were evaluated with BM aspiration after cycle 1 of therapy, and then every 1 to 3 cycles in all patients irrespective of therapy type. The median number of administered cycles was 4 (range, 1-6) in patients treated with intensive chemotherapy regimens and 6 (range, 1-23) in patients treated with HMAs. The ORR was 89% (25/28), including CR in 14 patients (50%), marrow CR (mCR) in 5 patients (18%), mCR with hematological improvement in 2 patients (7%), partial response in 2 patients (7%), and hematological improvement in 2 patients (7%). Patients treated with chemotherapy had a trend toward higher ORR (100% vs 83%, P = .533) and significantly higher CR rates (90% vs 28%; OR, 23; 95% CI, 2.3-235.5; P = .004) compared with patients treated with HMAs (Table 2). In patients treated with HMAs, the median number of cycles to best response was 3 (range, 1-9). All patients treated with chemotherapy achieved CR (10 patients) or mCR (1 patient) after 1 cycle of therapy.
Response outcomes of patients with NPM1-mutated MDS based on type of therapy
| Response | Total (N = 28)* | Chemotherapy (n = 10)* | HMAs (n = 18)* | OR (95% CI) | P |
|---|---|---|---|---|---|
| ORR | 25 (89) | 10 (100) | 15 (83) | 0.83 (0.68-1.0) | .533 |
| PD | 3 (11) | 0 (0) | 3 (17) | 0.83 (0.68-1.0) | .533 |
| HI | 3 (11) | 0 (0) | 3 (17) | 0.78 (0.61-0.99) | .265 |
| mCR† | 7 (25) | 1 (10) | 6 (33) | 0.22 (0.2-2.2) | .364 |
| PR | 2 (7) | 0 (0) | 2 (11) | 0.89 (0.75-1.0) | .524 |
| CR | 14 (50) | 9 (90) | 5 (28) | 23.4 (2.3-235.5) | .004 |
HI, hematological improvement; mCR, marrow CR; OR, odds ratio; PD, progressive disease; PR, partial response.
Data are n (%).
Two patients had mCR with hematological improvement without meeting the criteria for CR.
With a median follow-up of 30.1 months (95% CI, 22.0-38.2), chemotherapy was associated with longer OS compared with HMAs (median survival, not reached [NR] vs 16 months; P = .047) (Figure 4A). Treatment with chemotherapy was also associated with a significantly longer PFS compared with HMA-based therapy (NR vs 7.5 months, P = .023) (Figure 4B). A trend toward longer time to transformation was also observed in patients treated with chemotherapy (median, NR vs 19.8 months; P = .125) (supplemental Figure 5). Patients who proceeded to allogeneic stem cell transplantation had favorable survival outcomes compared with patients not receiving transplant (median OS, NR vs 22.1 months; P = .012). When evaluating the impact of transplant on each treatment group, it was not associated with significantly improved survival in patients treated with chemotherapy (2-year OS, 80% vs 100%; P = .655), but it was associated with improved OS among patients treated with HMAs (2-year OS, 67% vs 28%; P = .025) (Figure 5). Of note, the median follow-up of patients treated with chemotherapy with no transplant (UPN 10, UPN 18, and UPN 30; supplemental Table 1) was 17.6 months (range, 14-24) compared with 23.5 months (range, 8.5-90.6) in those treated with chemotherapy and subsequent transplant. By univariate analysis, none of the other detected mutations influenced survival (supplemental Table 3). Of note, all 3 patients with FLT3-ITD mutations were treated with frontline HMAs: 1 achieved mCR as best response and proceeded to transplant; 1 achieved hematological improvement, subsequently relapsed, and died prior to receiving salvage therapy; and 1 had progressive disease after 2 cycles of therapy and did not receive salvage therapy. In addition, VAF and clonal hierarchy of NPM1 mutations were not associated with OS or time to transformation (supplemental Table 3). Finally, no significant differences in OS or time to transformation were observed when evaluating survival outcomes based on IPSS-R category (supplemental Figures 6 and 7).

Survival outcomes of patients with NPM1-mutated MDS based on frontline therapy. Kaplan-Meier estimates of OS (A) and PFS (B) based on therapy type. Chemotherapy, cytotoxic AML-like chemotherapy regimens.
Survival outcomes of patients with NPM1-mutated MDS based on frontline therapy. Kaplan-Meier estimates of OS (A) and PFS (B) based on therapy type. Chemotherapy, cytotoxic AML-like chemotherapy regimens.
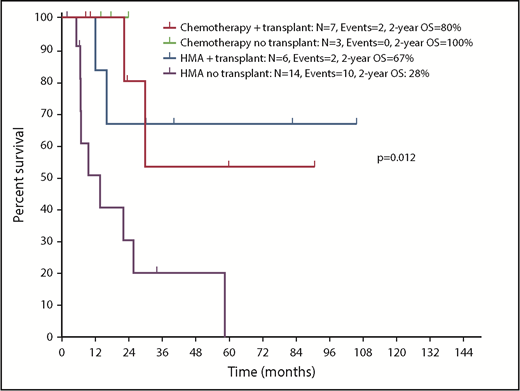
Kaplan-Meier estimate of survival based on therapy and allogeneic stem cell transplantation in patients with NPM1-mutated MDS and MDS/MPN.
Kaplan-Meier estimate of survival based on therapy and allogeneic stem cell transplantation in patients with NPM1-mutated MDS and MDS/MPN.
Mutational dynamics during disease evolution and therapy
To study the mutational dynamics of NPM1 mutations in MDS, BM sequencing at different time points of disease evolution was performed in 16 patients (52%) (Figure 6). Among these 16 patients, the presence of NPM1 mutation correlated with disease status, and, mutation clearance, evaluated by the use of the same NGS platform, was observed in all patients who achieved CR and who had sequencing at the time of remission (n = 5). Mutation clearance at the time of CR was associated with clearance of trilineage dysplasia (Figure 7). NPM1 mutations were detected at the time of disease recurrence or progression in all patients. Previously undetected mutations or cytogenetic abnormalities were also observed at relapse and transformation (UPN 4, UPN 7, UPN 22, UPN 24, UPN 25, UPN 28, and UPN 30). A subset of patients had high NPM1 VAFs at the time of diagnosis, despite proportionally lower BM blast percentages (UPN 6, UPN 19, UPN 21, UPN 26, and UPN 27); in such patients, NPM1 mutation VAF changes did not correlate with changes in the blast population. In contrast, a second group of patients could be observed in whom dynamic changes in NPM1 mutation burden correlated with changes in blast percentages (UPN 4, UPN 22, UPN 25, UPN 28, and UPN 30).
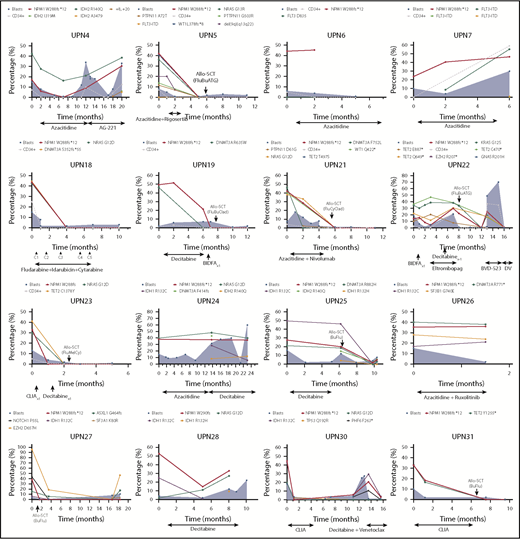
Dynamics of blast percentage and mutational burdens throughout the course of therapy. Blast percentages observed by BM morphologic evaluation are represented over time as blue shaded areas, with blast populations defined by flow cytometry represented as dotted gray lines. VAFs of somatic mutations are depicted over time in each patient. Clearance of NPM1 mutations can be observed in patients who respond to therapy (UPN 4, UPN 5, UPN 18, UPN 22, UPN 23, UPN 27, UPN 28, UPN 30, and UPN 31) or after allogeneic stem cell transplantation (UPN 19 and UPN 21). Disease relapses or progression were invariably associated with resurgence of NPM1 mutations, with correlation between mutation burden and blast population (UPN 4, UPN 7, UPN 22, UPN 24, UPN 25, UPN 28, and UPN 30). Acquisition of new clonal abnormalities was associated with transformation or relapse in a number of patients (UPN 4, UPN 7, UPN 22, UPN 24, UPN 25, UPN 28, and UPN 30). CLIA, cladribine, idarubicin, cytarabine.
Dynamics of blast percentage and mutational burdens throughout the course of therapy. Blast percentages observed by BM morphologic evaluation are represented over time as blue shaded areas, with blast populations defined by flow cytometry represented as dotted gray lines. VAFs of somatic mutations are depicted over time in each patient. Clearance of NPM1 mutations can be observed in patients who respond to therapy (UPN 4, UPN 5, UPN 18, UPN 22, UPN 23, UPN 27, UPN 28, UPN 30, and UPN 31) or after allogeneic stem cell transplantation (UPN 19 and UPN 21). Disease relapses or progression were invariably associated with resurgence of NPM1 mutations, with correlation between mutation burden and blast population (UPN 4, UPN 7, UPN 22, UPN 24, UPN 25, UPN 28, and UPN 30). Acquisition of new clonal abnormalities was associated with transformation or relapse in a number of patients (UPN 4, UPN 7, UPN 22, UPN 24, UPN 25, UPN 28, and UPN 30). CLIA, cladribine, idarubicin, cytarabine.
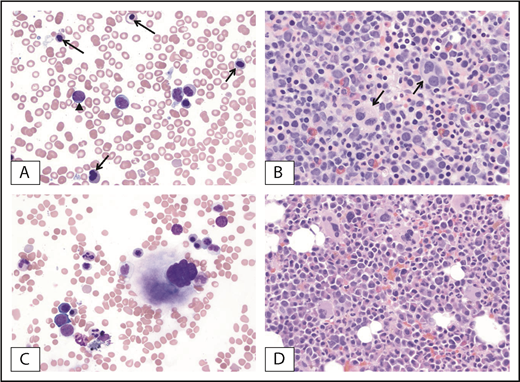
Morphologic clearance of dysplastic features at the time of complete remission and NPM1 mutation clearance. (A) Pretreatment BM from a patient with MDS-EB with NPM1 mutation. Dysplastic erythroblasts (arrows) and granulocytes with increased blasts (arrowhead) are observed. (B) Dysplastic megakaryocytes (arrows) within a hypercellular BM. (C-D) Posttreatment BM of the same patient at the time of mutation clearance demonstrates clearance of blasts and regenerating hematopoietic cells without dysplastic changes. Original magnification ×500; Wright-Giemsa (A,C) and hematoxylin and eosin (B,D) stains.
Morphologic clearance of dysplastic features at the time of complete remission and NPM1 mutation clearance. (A) Pretreatment BM from a patient with MDS-EB with NPM1 mutation. Dysplastic erythroblasts (arrows) and granulocytes with increased blasts (arrowhead) are observed. (B) Dysplastic megakaryocytes (arrows) within a hypercellular BM. (C-D) Posttreatment BM of the same patient at the time of mutation clearance demonstrates clearance of blasts and regenerating hematopoietic cells without dysplastic changes. Original magnification ×500; Wright-Giemsa (A,C) and hematoxylin and eosin (B,D) stains.
Discussion
Mutations affecting the NPM1 gene are rare in patients with a diagnosis of MDS or MDS/MPN. In this study, we evaluated a cohort of NPM1-mutated MDS and MDS/MPN patients and described their clinicopathologic features and outcomes with different therapies. Treatment with chemotherapy as part of induction was associated with high CR rates, referral to allogeneic transplant, and improved PFS and OS among candidate patients with NPM1-mutated MDS and MDS/MPN.
HMAs are the standard of care for patients with higher-risk MDS.16 Historical data suggest that survival outcomes with intensive chemotherapy in patients with higher-risk MDS is poor, irrespective of age,17-19 with median survival of 12 months compared with 22 months with decitabine and 2-year survival rates of 32% with chemotherapy compared with 63% with decitabine in patients younger than 60 years of age. The presence of certain genomic abnormalities, such as TET220,21 and TP5322,23 mutations, has been associated with favorable rates of response to these agents. The concept that specific mutations, such as DNMT3A,24 FLT3-ITD,25 or IDH1/2,26 or fusion proteins, such as CBFB-MYH11/AML1-ETO27 or PML-RARA,28 may confer increased sensitivity to specific therapies has been reported with other agents. The presence of NPM1 mutations in AML represents another such example, with this subgroup of patients having high remission rates and favorable prognosis with chemotherapy regimens and worse outcomes with HMA therapy,29-31 as well as in vitro sensitivity to all-trans retinoic acid (ATRA)32 and XPO133 inhibition, which has led to exploring the use of ATRA/arsenic trioxide (ATO) in the treatment of these patients.34 The prognosis with specific therapies has not yet been described in other entities, such as MDS or MDS/MPN. In our study, patients with NPM1-mutated MDS or MDS/MPN treated with intensive chemotherapy experienced high ORRs (100%) and CR rates (90%), as well as favorable PFS and OS, which were higher than those achieved with HMAs. CR rates of this magnitude have not been reported in historical data describing the activity of intensive chemotherapy in higher-risk MDS, which did not induce significantly higher CR rates compared with decitabine (43% vs 52%, P = .09).18 Although limited by the small patient numbers, this suggests that the presence of NPM1 mutations in MDS may similarly be used as a biomarker to select therapy. However, it is important to note that patients who were treated with chemotherapy were significantly younger than patients who received HMAs and could exhibit selection bias because they were thought to be better candidates for this therapy and, thus, were expected to have better outcomes. However, the survival outcomes of this group of patients were better than those observed in historical data reported by Kantarjian et al18 and Ravandi et al.19 Also, 7 of 10 of these patients, as a result of their younger age and high-risk disease based on IPSS and IPSS-R, proceeded to allogeneic stem cell transplantation after achieving CR. Although outcomes of the 3 patients who received chemotherapy without transplant were favorable, the follow-up time is short compared with those who proceeded to transplant. This limits our ability to conclude that chemotherapy alone is the optimal strategy. This is particularly true when the patient population receiving chemotherapy and transplant is younger and, therefore, expected to have better outcomes. Among patients who were initially treated with HMAs, consolidation with subsequent allogeneic stem cell transplantation showed clear improvement in survival outcomes, suggesting that transplant may be beneficial in this context. However, all transplanted patients within the HMA-treated cohort were 70 years or younger and could also be expected to have better outcomes than the older population who are not candidates for this form of therapy. Further multicenter prospective studies will be needed to determine the need for transplant in these patients, particularly in the setting of frontline treatment with chemotherapy, as well as whether addition of other agents, such as ATRA/ATO, may have a role in NPM1-mutant MDS and MDS/MPN.
Similar to what previous studies have described in NPM1-mutated AML, we observed cooccurrence of DNMT3A, TET2, and NRASG12D mutations in our cohort of NPM1-mutated MDS patients.3 However, the frequency and clonal size of FLT3 mutations were small, as anticipated in an MDS cohort. This may suggest that acquisition of FLT3 mutations in these patients leads to rapid progression to overt leukemia. Further supporting this concept, and as previously reported,35 transformation to AML was observed in 1 patient (UPN 7) after acquiring an FLT3-ITD mutation during the course of therapy with azacitidine. In addition, as is the case in NPM1-mutated AML, NPM1 mutations were stable during the course of disease. In patients who achieved complete remission, clearance of NPM1 mutation was observed at the time of remission in all evaluable patients, with reappearance of the NPM1-mutant clone at the time of disease relapse. Review of BMs in patients in whom the NPM1 mutation became undetectable revealed that clearance of the mutation was associated with concurrent clearance of blasts and of trilineage dysplasia. However, the use of deeper-sequencing techniques, such as NPM1 reverse-transcription PCR, would be necessary to confirm deep molecular responses.
Although NPM1 mutations likely occur at the level of the common myeloid progenitor,36 it is possible that distinct cells of origin may drive different phenotypes and lead to development of AML in some patients and a stable MDS phase in others. Although no progenitor-specific sequencing was available in our study, HSPC/HSC population analysis in 1 patient with high whole-BM NPM1 VAF revealed a GMP pattern of differentiation. This differentiation pattern has not only been described in MDS,10 it has also been shown to be characteristic of AML.15 This may support the hypothesis proposed by other groups8 that NPM1 mutations, at least in a subgroup of patients, may characterize AML. In fact, in our study population, we observed similar time to transformation and OS among different IPSS-R categories. Based on our results and those of previous mouse models,1 in which NPM1+/− mice exhibited myeloproliferation and dyspoiesis with hypercellular erythroid precursors and accumulation of mature myeloid cells, it is possible that NPM1 mutations may truly occur in MDS and MDS/MPN as a secondary mutation that may ultimately contribute to the development of leukemia. This could be observed in our study in patients who had likely subclonal NPM1 mutations with VAF < 20% and who had a similar risk for progressing to AML compared with those with high VAF. In fact, previous studies suggest that, in a subset of patients with secondary AML arising from an underlying MDS or CMML, mutations in NPM1 can occur as a late event.37 In addition, NPM1 mutations in MDS and MDS/MPN are associated with poor outcome and a higher rate of progression to AML when treated with nonchemotherapeutic approaches.38
There are several limitations to the current analysis. First, although the cohort is the largest and most comprehensively studied series to date, the sample size is small because of the low frequency of NPM1 mutations in MDS, which limits our ability to draw definite conclusions for the optimal therapeutic approach for these patients. In addition, as a result of the retrospective nature of this study, we could not account, with precision, for the reasons that lead to selection of chemotherapy vs HMA therapy. They likely include age and patient fitness, as well as the presence of high blast count and normal karyotype, and these patient characteristics might have impacted the improved outcomes with chemotherapy and transplant. Also, only a subset of patients had a more detailed sequencing analysis, and this focused on a limited number of candidate genes in a subset of them. Whole-exome sequencing of NPM1-mutated MDS samples will allow better identification of other cooperating genomic abnormalities. Additionally, cell-specific sequencing to evaluate the clonal architecture of HSCs and HSPCs in these patients will be required to better define whether NPM1 mutations should define AML, irrespective of blast percentage.
In conclusion, our study is the first to describe the clinical outcomes of patients with MDS and NPM1 mutations after intensive chemotherapy vs HMAs. Our data support that patients with NPM1-mutant MDS or MDS/MPN who are candidate for intensive therapeutic approaches and allogeneic stem cell transplantation may have improved outcomes compared with historical data and may benefit the most from chemotherapy when feasible, rather than MDS-based treatment approaches, despite the presence of <20% blasts. This sets the basis for the proposal of prospective multicenter studies to confirm these data, the potential benefit of transplant, and whether NPM1 mutations should define AML, irrespective of blast percentage.
Presented in abstract form at the 58th annual meeting of the American Society of Hematology, San Diego, CA, 4 December 2016.
The full-text version of this article contains a data supplement.
Acknowledgments
This work was supported by the Clinical Research Consortium, the Cancer Prevention Research Institute of Texas (RP100202) (G.G.-M.), the Edward P. Evans Foundation (G.G.-M.), the Red and Charline McCombs Institute for the Early Detection and Treatment of Cancer Award (K.T.), an Institutional Research Grant at the MD Anderson Cancer Center (K.T.), a National Institutes of Health, National Cancer Institute Leukemia Specialized Program of Research Excellence Career Development Grant (K.T.), MD Anderson Cancer Center Support Grant P30 CA016672, and by generous philanthropic contributions to MD Anderson’s MDS/AML Moon Shot Program (K.T., H.K., G.G.-M., and A.D.).
Authorship
Contribution: G.G.-M. and G.M.-B. designed the study, contributed patients, analyzed the data, and participated in writing the manuscript; H.K. participated in data collection, analyzing the data, and writing the manuscript; M.A.S., R.S.K., A.D., E.J., T. Kadia, F.R., C.D., G.B., K.T., T. Kuzmanovic, J.M., K.S., and M.K. contributed patients and participated in analyzing the data and writing the manuscript; S.P. collected and analyzed data; C.B.-R. performed histopathological analysis; K.P. performed sequencing analysis; I.G.-G. and S.C. performed BM hematopoietic stem cell compartment analysis, analyzed the data, and contributed to writing the manuscript; and R.K.-S. reviewed BM morphologic, flow cytometry, and genetic findings, analyzed the data, and contributed to writing the manuscript.
Conflict-of-interest disclosures: The authors declare no competing financial interests.
Correspondence: Guillermo Garcia-Manero, Department of Leukemia, University of Texas MD Anderson Cancer Center, 1515 Holcombe Blvd, Houston, TX 77015; e-mail: ggarciam@mdanderson.org.

