

Key Points
TAP activity wanes during monocyte to-DC-differentiation, thus enabling efficient cytotoxic T lymphocyte stimulation.
In monocytes, TAP localizes to endosomes, and upon differentiation to DCs, it travels to the ER and lysosomes and shows decreased activity.

Abstract
Dendritic cells (DCs) take up antigen in the periphery, migrate to secondary lymphoid organs, and present processed antigen fragments to adaptive immune cells and thus prime antigen-specific immunity. During local inflammation, recirculating monocytes are recruited from blood to the inflamed tissue, where they differentiate to macrophages and DCs. In this study, we found that monocytes showed high transporter associated with antigen processing (TAP)–dependent peptide compartmentalization and that after antigen pulsing, they were not able to efficiently stimulate antigen-specific T lymphocytes. Nevertheless, upon in vitro differentiation to monocyte-derived DCs, TAP-dependent peptide compartmentalization as well as surface major histocompatibility complex I turnover decreased and the cells efficiently restimulated T lymphocytes. Although TAP-dependent peptide compartmentalization decreased during DC differentiation, TAP expression levels increased. Furthermore, TAP relocated from early endosomes in monocytes to the endoplasmic reticulum (ER) and lysosomal compartments in DCs. Collectively, these data are compatible with the model that during monocyte-to-DC differentiation, the subcellular relocation of TAP and the regulation of its activity assure spatiotemporal separation of local antigen uptake and processing by monocytes and efficient T-lymphocyte stimulation by DCs.
Introduction
Dendritic cells (DCs) are important sentinels of the immune system that translate innate immune activation into adaptive immunity. During homeostasis, DCs residing in secondary lymphoid organs such as the spleen or lymph nodes are derived from specialized DC precursors, whereas on mucosal surfaces of the lung, intestine, and other organs, DCs are constantly renewed from monocytes.1-3 During inflammation, monocytes are recruited and differentiate to DCs.4-9 Molecular signatures of human DC subsets located in tissues show that, in addition to classical DCs derived from dedicated precursors (pre-DCs), monocyte-derived DCs (moDCs) are found as well.10 To become potent T-lymphocyte stimulators, immature DCs (imDCs) need to receive stimuli that promote DC maturation. Mature DCs (mDCs) express costimulatory molecules and enhanced levels of major histocompatibility complex (MHC) I/II molecules.11 Monocytes that took up antigen before extravasation into tissue can retain antigen to make it available for presentation after differentiation to DCs.12,13 Whereas the presentation of antigenic peptides derived from intracellular proteins on MHC I (the canonical MHC I pathway) is conferred by all nucleated cells, peptide presentation derived from extracellular proteins is restricted to professional antigen-presenting cells (pAPCs). In cross-presentation, peptides derived from exogenous proteins are presented via MHC I on pAPCs to induce antigen-specific cytotoxic T lymphocytes (CTLs).14 During viral infections, cross-presentation is a key mechanism to harness adaptive immunity against infected cells.15,16
While the molecular mechanisms of antigen processing, peptide trafficking, and loading on MHC II have been described in detail,17-20 the corresponding routes for MHC I, and in particular the site of MHC I loading for cross-presentation, are less clear. The intracellular trafficking pathways of MHC I have been intensively studied in cell lines, whereas these mechanisms have been addressed in primary DCs only in few studies that were mainly carried out in murine bone marrow–derived DCs.21 In the canonical MHC I pathway, transport and loading of antigenic peptides are mediated by the peptide loading complex (PLC). The PLC comprises the heterodimeric transporter associated with antigen processing 1 (TAP1) and TAP2, the MHC I heavy chain/β2-microglobulin (β2m) dimer, the MHC I–specific chaperon tapasin, the oxidoreductase ERp57, and the lectin-like chaperone calreticulin.22-25 After successful MHC I loading, the PLC disassembles to release the stable peptide/MHC I complex, which subsequently migrates through the secretory pathway to the cell surface.26 Several components of the MHC I machinery, including TAP1, TAP2, and tapasin, are upregulated during DC maturation.27,28
Two pathways have been proposed for cross-presentation, the “cytosolic” and the “vacuolar” pathway, which are named according to the site of antigen degradation.29 Cross-presentation via the cytosolic pathway is thought to be TAP dependent and involves the transfer of exogenous proteins from endocytic compartments to the cytosol, where they are processed by the proteasome. The resulting peptides are either subsequently translocated by TAP into the endoplasmic reticulum (ER) lumen for MHC I loading or into the endocytic compartment to which TAP, MHC I molecules, and components of the peptide loading machinery are routed by Sec22b.30-33
In vitro, all human blood, lymph node, and tonsil-derived DC subsets have been shown to cross-present antigens upon stimulation.34-38 In vitro–generated moDCs are considered as a model of inflammatory DCs, and they are used for immunotherapeutic purposes.39 Importantly, moDCs cross-present antigens.40 However, the roles of different human DC subsets for the activation of CTLs are still only poorly understood. In particular, it is unclear whether the varying capacity of different DC subsets to cross-present antigen is associated with their intrinsic configuration, the inflammatory environment, or the nature of the antigen. Our study revealed that moDCs show an enhanced T-lymphocyte restimulation capacity and an increased half-life of cell-surface peptide/MHC I complexes when compared with monocytes. These changes were associated with reduced TAP-dependent peptide transport activity and TAP relocation from endosomes in monocytes to ER and lysosomal compartments in imDCs and mDCs. Thus, by directly and quantitatively studying antigen transport in immunologically relevant cells, we reconciled the contradiction between reduced TAP-dependent peptide transport and an increased T-lymphocyte priming capacity of DCs by identifying TAP relocation during differentiation from monocytes to DCs.
Materials and methods
Isolation of PBMCs and monocytes from whole blood samples
Buffy coats from healthy donors were kept at 37°C before it was subjected to Ficoll separation for 20 minutes at 900g. The peripheral blood mononuclear cell (PBMC) layer was isolated and washed twice with MACS buffer (2 mM EDTA, 0.1% bovine serum albumin [BSA] in Dulbecco’s phosphate-buffered saline [PBS]). CD14+ monocytes were isolated from PBMCs using CD14 MicroBeads (Miltenyi) with an AutoMACS Pro Separator. After separation, cells were seeded in CellGro serum-free DC medium (CellGenix) at a concentration of 1 × 10⁶ cells/mL.
In vitro differentiation of moDCs
For the generation of imDCs, monocytes were incubated for 5 days in CellGro medium supplemented with 1000 U/mL human granulocyte-macrophage colony-stimulating factor (Cell Genix) and interleukin-4 (IL-4; Cell Genix). imDCs were further matured for 3 days by adding 10 ng/mL tumor necrosis factor α (TNF-α; PeproTech), 10 ng/mL IL-1β (PeproTech), 1000 U/mL IL-6 (PeproTech), and 1 µg/mL prostaglandin E2 (Cayman).41
Restimulation of HCMV-specific CD8+ memory T lymphocytes
Monocytes or imDCs of HLA-A*03+ donors were pulsed for 24 hours with 25 µg human cytomegalovirus (HCMV) IE1 recombinant protein (Miltenyi), washed, and then matured to mDCs for 8 days. CD8+ T lymphocytes were isolated via MACS and seeded in CellGro medium supplemented with 10% human AB serum for 2 days. DCs and T lymphocytes were cocultured at a ratio of 1:4 for 12 days. The medium was supplemented with IL-21 at the beginning and then with IL-7 every 4 days. Cells were immunolabeled with an anti-CD8 monoclonal antibody (BD Bioscience) and an IE1-pentamer (ProImmune).42
Antigen-specific expansion of cytotoxic CD8+ T lymphocytes using artificial APCs
Untouched CD8+ T lymphocytes were isolated from PBMCs of HLA-A*02:01+ CMV-seropositive donors by MACS (Miltenyi Biotec). Informed consent was obtained from all donors as approved by the Ethics Committee (Hannover Medical School, 2744-2015), and trial subject data were treated confidentially. For in vitro expansion of T lymphocytes, HCMV-specific CD8+ T lymphocytes were incubated with artificial antigen-presenting cells (aAPCs) in RPMI 1640 with 5% human AB serum (C.C.pro) and 50 U/mL IL-2 (PeproTech).43-45 aAPCs were generated by coupling HLA-A*02:01 molecules (Dimer X Becton Dickinson) pulsed with HLA*02:01-restricted HCMVpp65495-503 peptide (A02pp65NLV, NLVPMVATV, ProImmune) and anti-CD28 monoclonal antibodies (Becton Dickinson) onto Dynabeads (Life Technologies). The extent of expansion of HCMV-specific A02pp65NLV-positive T lymphocytes was assessed by pentamer immunolabeling (ProImmune).
Production of VSV-G pseudotyped lentiviral vector particles
HEK 293T cells were transfected with a 3-vector system consisting of pViFCGdBH, sgp.d2, and pMD.G2, and lentiviral vector titration was performed as described previously.46 Target genes expressed by this lentiviral vector system were fused C terminally to a fluorescent reporter protein (calnexinmCherry; calreticulinmCherry; ERmCherry [C-terminal KDEL sequence]; TAP1mVenus; TsnmCherry).
Flow cytometry
Immunolabeling of cells was performed in FACS buffer (2% BSA, 20 mM EDTA, 0.2% sodium azide in 1× PBS) with 10% polyglobin (Gamunex) for FcγR blocking for 20 minutes at 4°C. Cells were washed and resuspended in FACS buffer containing 0.25% paraformaldehyde (PFA). Samples were measured using an LSRII machine (BD Biosciences). Data were analyzed with FlowJo software (7.6.5/10).
Immunoblotting
Cells were lysed in reducing SDS sample buffer, denatured at 65°C for 10 minutes, and lysates were separated using 10% Tris-glycine gel chromatography. Monocytes were solubilized with 1% digitonin for 1 hour and then mixed with reducing SDS-sample buffer. Gels were blotted on polyvinylidene fluoride membranes and blocked in 5% milk in TBS-T before incubation with anti-TAP1 (148.3 hybridoma) antibody for 2 hours or anti-β-actin (1:15 000; Sigma-Aldrich) antibody for 1 hour. After 1 hour of incubation with goat anti-mouse horseradish peroxidase (Sigma), membranes were developed with Clarity Western ECL Reagent (BioRad).
MHC I half-life determination
A total of 2 × 10⁵ cells were incubated with saturating concentrations of biotin-coupled anti-MHC I antibody (clone W6/32). At different time points, cells were immunolabeled with an anti-MHC I antibody (clone W6/32) coupled with either PeCy5 or streptavidin-Alexa Fluor 488.
Confocal immunofluorescence microscopy
Images were acquired sequentially using Kalman filtering (4 times) with a 60× (U Plan S-Aby mouth 60×/1.35 numerical aperture) and 100× (PlanAPO 100×/1.45 numerical aperture oil) objectives. Data were collected with Fluoroview1000 (Olympus, microscope IX81) and analyzed with ImageJ. Monocytes were seeded in Labtek chambers and then washed with PBS-immunofluorescence (IF; Dulbecco’s PBS, 1 mM MgCl2, and 1 mM CaCl2, for IF) before fixing with 4% PFA for 10 minutes. After quenching for 10 minutes (50 mM glycine in PBS-IF), cells were permeabilized with 0.1% Triton X-100 for 20 minutes and incubated with 5% BSA/PBS-IF for 30 minutes. Subsequently, cells were incubated with primary antibody dilutions in 1% BSA/PBS-IF for 2 hours at room temperature (RT) and washed, and secondary antibody labeling was performed for 1 hour at RT in the dark. Nuclei were stained with 1:10 000 bisbenzimide in the dark for 2 minutes. After differentiation of DCs, they were washed twice with PBS-IF and fixed with 4% PFA for 10 minutes. Then blocking buffer IF (1× PBS with 3% BSA, 1.5% glycine, and 0.01% saponin) was added for 1 hour at RT. After blocking and permeabilization, cells were washed twice and antibody dilutions were added in antibody-buffer IF (1× PBS with 0.1% BSA and 0.01% saponin) with the same incubation steps as for monocyte staining.
Stochastic optical reconstruction microscopy (STORM)
For N-STORM superresolution microscopy, cells were seeded, fixed, and treated with primary antibodies as described above for immunofluorescence microscopy. Secondary antibodies carrying 2 fluorophores were acting as activator-reporter pairs. Labeling of the secondary antibodies with activator and reporter fluorophores was done following N-STORM instructions.
Electron microscopy
Monocytes were fixed in 2% paraformaldehyde + 0.2% glutaraldehyde in 0.1 M PHEM buffer (60 mM piperazine-N,N′-bis(2-ethanesulfonic acid), 25 mM N-2-hydroxyethylpiperazine-N′-2-ethanesulfonic acid, 2 mM MgCl2, and 10 mM EGTA, pH 6.9) and processed for ultrathin cryosectioning as previously described.47
Analysis of TAP-dependent peptide compartmentalization
The protocol was taken from Fischbach et al.48
Statistical analysis of immunofluorescence
An R-based script was generated for semiautomated computational analysis of immunofluorescence photos.
Visualization of immunofluorescence
ImageJ (v1.46) was used. To identify transduced imDCs and mDCs, the intensity correlation analysis plug-in of ImageJ was used.
Results
Monocyte to imDC differentiation and mDC maturation is associated with major changes in the expression of cell surface markers. During moDC differentiation, CD14 expression of monocytes disappeared after 24 hours of incubation, while CD40 expression initially increased on a fraction of monocytes and then continuously increased (Figure 1A). CD86 expression was induced during imDC differentiation, declined on day 5, and then increased again during maturation. CD83 expression was induced only moderately on imDCs and strongly on mDCs, whereas MHC I expression slightly decreased during imDC differentiation and increased again during mDC maturation (Figure 1A). MHC II expression continuously increased until day 8 of incubation (Figure 1A).
![Figure 1. Monocytes and imDCs pulsed with recombinant IE1 protein and differentiated and/or matured to mDCs similarly restimulate HCMV-specific T-lymphocyte expansion, while only antigen-loaded mDCs induce cytokine expression in preexpanded T lymphocytes. (A) Surface marker expression during differentiation of monocytes (mono; day 0) to imDCs (day 5) and maturation to mDCs (day 8); 1 of 4 similar experiments is shown. (B) Restimulation of HLA-A*03+ HCMV-specific CD8+ T lymphocytes during incubation for 12 days with either IE1 pulsed monocytes or imDCs that were differentiated to mDCs (mono + IE1 and imDC + IE1, respectively) (means ± 95% confidence interval [CI], n = 4). **P ≤ .03, 2-tailed Mann-Whitney U test. (C) IL-2 and TNF-α expression of preexpanded HCMV+ T lymphocytes derived from HLA-A02:01+ donors cocultured with pp65-pulsed autologous monocytes or mDCs (means ± 95% CI, n = 3). Preexpanded T cells were additionally incubated with anti-CD28 antibody plus a crosslinking antibody (costim) to mimic costimulation. **P ≤ .005; *P ≤ .05; Kruskal-Wallis test with Dunn’s correction for multiple comparison.](https://ash.silverchair-cdn.com/ash/content_public/journal/bloodadvances/3/6/10.1182_bloodadvances.2018027268/2/m_advances027268f1.png?Expires=1765891373&Signature=sZV9ELTBttnQunuiQirFLe9c7ZCVmtsEXGhWFkBkHqc0K9~93PGPiM3F-n9MmqI97gHPlieRBtGEwCiELo04ewlXm1F372ewER8CMvi8RxcRxHdMC3VYNynxC8LnLKY~CsRqp2pG1yqsy-N8IK5Lq90bgPzLfHqBB0bkNvsFqMOa5~CODQAPuKGzbz5q4ENYXBd~c-rAH3bz2qeDlVx-LFwEUk0C~B-G~J1TcR7XR9THLrGYga9j8PUxFUG-lGPcb3p3Vlksb3~DgCcdb8M6MA7NsxI4FB1SsKiwCt4CrB~yEdsgnlIjQ7sk53eprP5drp52~PHZE8Zznxamvmnr7w__&Key-Pair-Id=APKAIE5G5CRDK6RD3PGA)
Monocytes and imDCs pulsed with recombinant IE1 protein and differentiated and/or matured to mDCs similarly restimulate HCMV-specific T-lymphocyte expansion, while only antigen-loaded mDCs induce cytokine expression in preexpanded T lymphocytes. (A) Surface marker expression during differentiation of monocytes (mono; day 0) to imDCs (day 5) and maturation to mDCs (day 8); 1 of 4 similar experiments is shown. (B) Restimulation of HLA-A*03+ HCMV-specific CD8+ T lymphocytes during incubation for 12 days with either IE1 pulsed monocytes or imDCs that were differentiated to mDCs (mono + IE1 and imDC + IE1, respectively) (means ± 95% confidence interval [CI], n = 4). **P ≤ .03, 2-tailed Mann-Whitney U test. (C) IL-2 and TNF-α expression of preexpanded HCMV+ T lymphocytes derived from HLA-A02:01+ donors cocultured with pp65-pulsed autologous monocytes or mDCs (means ± 95% CI, n = 3). Preexpanded T cells were additionally incubated with anti-CD28 antibody plus a crosslinking antibody (costim) to mimic costimulation. **P ≤ .005; *P ≤ .05; Kruskal-Wallis test with Dunn’s correction for multiple comparison.
Monocytes and imDCs pulsed with recombinant IE1 protein and differentiated and/or matured to mDCs similarly restimulate HCMV-specific T-lymphocyte expansion, while only antigen-loaded mDCs induce cytokine expression in preexpanded T lymphocytes. (A) Surface marker expression during differentiation of monocytes (mono; day 0) to imDCs (day 5) and maturation to mDCs (day 8); 1 of 4 similar experiments is shown. (B) Restimulation of HLA-A*03+ HCMV-specific CD8+ T lymphocytes during incubation for 12 days with either IE1 pulsed monocytes or imDCs that were differentiated to mDCs (mono + IE1 and imDC + IE1, respectively) (means ± 95% confidence interval [CI], n = 4). **P ≤ .03, 2-tailed Mann-Whitney U test. (C) IL-2 and TNF-α expression of preexpanded HCMV+ T lymphocytes derived from HLA-A02:01+ donors cocultured with pp65-pulsed autologous monocytes or mDCs (means ± 95% CI, n = 3). Preexpanded T cells were additionally incubated with anti-CD28 antibody plus a crosslinking antibody (costim) to mimic costimulation. **P ≤ .005; *P ≤ .05; Kruskal-Wallis test with Dunn’s correction for multiple comparison.
To study whether monocytes pulsed with protein and differentiated to moDCs restimulate antigen-specific T lymphocytes, we pulsed monocytes or imDCs from HLA-A*03+/HCMV+ donors with recombinant HCMV-derived immediate early protein 1 (IE1), differentiated the cells to mDCs, and then cocultured them with autologous T lymphocytes. IE1 pulsed monocytes and imDCs induced expansion of IE1-specific T lymphocytes (Figure 1B). Thus, mDCs differentiated from IE1 pulsed monocytes retain sufficient antigenic peptides to restimulate antigen-specific CD8+ T lymphocytes. To study whether monocytes had the capacity to restimulate T lymphocytes, we preexpanded HCMV-specific CD8+ T lymphocytes from HLA-A*02+/HCMV+ donors and cocultured them with HCMV capsid protein pp65-pulsed monocytes or mDCs for 24 hours. The expression of IL-2 and TNF-α in preexpanded T-lymphocytes was triggered by mDCs, but not by monocytes (Figure 1C). Addition of an anti-CD28 antibody plus a crosslinking antibody did not induce IL-2 and TNF-α expression of the preexpanded T lymphocytes cocultured with antigen-pulsed monocytes (Figure 1C). This indicated that the inability of monocytes to induce T-lymphocyte activation was not associated with the lack of expression of costimulatory molecules. Taken together, monocytes are able to acquire and retain antigen during differentiation to DCs for subsequent presentation of peptide/MHC I complexes to CD8+ T lymphocytes. However, monocytes are not able to restimulate preexpanded CTLs in a costimulation-independent manner.
For efficient CTL stimulation, peptide/MHC I complexes need to be exposed on the cell surface for a sufficiently long period of time. Therefore, we investigated the residence time of MHC I on the cell surface of monocytes and moDCs by staining surface MHC I with a biotinylated monoclonal antibody (mAb). MHC I that is newly expressed on the cell surface will not be decorated by the biotinylated mAb and can be quantified by a fluorophore-coupled MHC I antibody. After 1 hour of incubation, 50% of the MHC I decorated with the biotinylated mAb disappeared from the surface of the monocytes, while imDCs and mDCs showed only 30% reduction of the decoration with the biotinylated mAb (Figure 2A). Correspondingly, monocytes showed enhanced expression of newly expressed MHC I when compared with imDCs and mDCs (Figure 2B). On monocytes, newly expressed MHC I was detected already after 15 minutes of incubation, while imDCs and mDCs showed only little appearance of newly expressed MHC I, even after longer incubation times (Figure 2B). Thus, on monocytes, the residence time of surface MHC I is indeed reduced when compared with DCs.

Monocytes show a shorter surface MHC I half-life than DCs. (A) MHC I surface turnover of monocytes, imDCs, and mDCs examined at the indicated time points over 4 hours (red histograms). (B) Newly expressed MHC I on monocytes, imDCs, and mDCs examined at the indicated time points over 4 hours (light red histograms). The 4°C control was incubated for 4 hours and is shown in blue histograms. Graphs in panels A and B indicate the mean fluorescence intensity (MFI) of MHC I expression normalized to MFI values of time point 0 (means ± 95% CI, n = 6 for monocytes, imDC, and mDCs; 1 out of 4 independent experiments). **P ≤ .005; *P ≤ .05; Kruskal-Wallis test with Dunn’s correction for multiple comparison.
Monocytes show a shorter surface MHC I half-life than DCs. (A) MHC I surface turnover of monocytes, imDCs, and mDCs examined at the indicated time points over 4 hours (red histograms). (B) Newly expressed MHC I on monocytes, imDCs, and mDCs examined at the indicated time points over 4 hours (light red histograms). The 4°C control was incubated for 4 hours and is shown in blue histograms. Graphs in panels A and B indicate the mean fluorescence intensity (MFI) of MHC I expression normalized to MFI values of time point 0 (means ± 95% CI, n = 6 for monocytes, imDC, and mDCs; 1 out of 4 independent experiments). **P ≤ .005; *P ≤ .05; Kruskal-Wallis test with Dunn’s correction for multiple comparison.
Because the increased MHC I residence time on moDCs might be associated with decreased PLC activity, we next determined PLC-mediated compartmentalization of antigenic peptides using a recently described flow cytometry based method.48 Consistent with the MHC I residence time, TAP-dependent H3-derived reporter epitope RRYQNSTC(F)L labeled with fluorescein (NST-F) peptide compartmentalization was very abundant in monocytes, whereas it was reduced in imDCs and even further diminished in mDCs (Figure 3A). NST-F compartmentalization dramatically decreased already after one day of differentiation (Figure 3B). The TAP dependency of NST-F accumulation was verified by the inhibition of NST-F compartmentalization upon addition of ICP47 (Figure 3C), and selective semipermeablization was shown by loss of cytosolic GFP, while ER-resident mCherry expression was unaffected (supplemental Figure 1A). Thus, TAP-dependent peptide compartmentalization activity declines with fast kinetics within 1 day of moDC differentiation.
![Figure 3. TAP-dependent peptide compartmentalization wanes during moDC differentiation (A) TAP-dependent peptide compartmentalization of monocytes, imDCs, and mDCs. MFI values of the histograms are indicated (left). Compartmentalization was performed in the presence of adenosine triphosphate (ATP; red line) and adenosine diphosphate (ADP; blue filled) to control for unspecific accumulation. Percent transport of monocytes, imDCs, and mDCs normalized to MFI values of monocyte adenosine triphosphate samples (means ± 95% CI, n = 10). ***P ≤ .0001; Kruskal-Wallis test with Dunn’s correction for multiple comparisons. (B) TAP-dependent peptide compartmentalization during differentiation of monocytes to mDCs (1 of 4 similar experiments is shown [left]). Percent TAP-dependent peptide compartmentalization (means ± 95% CI, n = 8 [right]). ***P ≤ .0001; **P ≤ .001; Kruskal-Wallis test with Dunn’s correction for multiple comparison. (C) ICP47AT565-mediated inhibition of TAP-dependent peptide compartmentalization (means ± 95% CI, n = 6) in mDC. For ICP47AT565, a 50% inhibitory concentration value of 34 nM was calculated with a 95% CI from 24 to 46 nM. (D) Bright field images of monocytes, imDCs, and mDCs. Blue 4′,6-diamidino-2-phenylindole stain indicates the nucleus, whereas the white dashed line indicates the cell shape. Scale bars, 5 µm. (E) Intracellular TAP1 staining in monocytes, imDCs, and mDCs (means ± 95% CI, n = 5). (F) TAP1 immunoblotting of monocytes, imDCs, and mDCs. IT, isotype staining; ns, not significant.](https://ash.silverchair-cdn.com/ash/content_public/journal/bloodadvances/3/6/10.1182_bloodadvances.2018027268/2/m_advances027268f3.png?Expires=1765891373&Signature=W6-w0S26xMfRAG2Gv9xbICmTMTMoDO-FYcQC6oD667m-ucko66oPJNCI7Pun~Ozs5kF1jJNQ1WtAL5i60SwAPygySfSHLTD0qrXE6BX77HEEJ9nylTAx~n3fM-nc7KB0dcIRsYkx3Fk0y3CXpapQLndJym-1bUPRMVoHEXgYQATlIGhJaYbunoV2lCxrKS97tJ09sdzbJo06EtwzWoY1xSS9ExuteTaXmOZobynhZBk4~JOZIaHUga4nANBXcPG9Od-MKzyXHGYTLzQza9B2jQ-P6o2E~cQBuxMEOucscaQZtWacKBu36XUoTnpjYmHr0tBwQ7KSLUA0o2xRMtdP7Q__&Key-Pair-Id=APKAIE5G5CRDK6RD3PGA)
TAP-dependent peptide compartmentalization wanes during moDC differentiation (A) TAP-dependent peptide compartmentalization of monocytes, imDCs, and mDCs. MFI values of the histograms are indicated (left). Compartmentalization was performed in the presence of adenosine triphosphate (ATP; red line) and adenosine diphosphate (ADP; blue filled) to control for unspecific accumulation. Percent transport of monocytes, imDCs, and mDCs normalized to MFI values of monocyte adenosine triphosphate samples (means ± 95% CI, n = 10). ***P ≤ .0001; Kruskal-Wallis test with Dunn’s correction for multiple comparisons. (B) TAP-dependent peptide compartmentalization during differentiation of monocytes to mDCs (1 of 4 similar experiments is shown [left]). Percent TAP-dependent peptide compartmentalization (means ± 95% CI, n = 8 [right]). ***P ≤ .0001; **P ≤ .001; Kruskal-Wallis test with Dunn’s correction for multiple comparison. (C) ICP47AT565-mediated inhibition of TAP-dependent peptide compartmentalization (means ± 95% CI, n = 6) in mDC. For ICP47AT565, a 50% inhibitory concentration value of 34 nM was calculated with a 95% CI from 24 to 46 nM. (D) Bright field images of monocytes, imDCs, and mDCs. Blue 4′,6-diamidino-2-phenylindole stain indicates the nucleus, whereas the white dashed line indicates the cell shape. Scale bars, 5 µm. (E) Intracellular TAP1 staining in monocytes, imDCs, and mDCs (means ± 95% CI, n = 5). (F) TAP1 immunoblotting of monocytes, imDCs, and mDCs. IT, isotype staining; ns, not significant.
TAP-dependent peptide compartmentalization wanes during moDC differentiation (A) TAP-dependent peptide compartmentalization of monocytes, imDCs, and mDCs. MFI values of the histograms are indicated (left). Compartmentalization was performed in the presence of adenosine triphosphate (ATP; red line) and adenosine diphosphate (ADP; blue filled) to control for unspecific accumulation. Percent transport of monocytes, imDCs, and mDCs normalized to MFI values of monocyte adenosine triphosphate samples (means ± 95% CI, n = 10). ***P ≤ .0001; Kruskal-Wallis test with Dunn’s correction for multiple comparisons. (B) TAP-dependent peptide compartmentalization during differentiation of monocytes to mDCs (1 of 4 similar experiments is shown [left]). Percent TAP-dependent peptide compartmentalization (means ± 95% CI, n = 8 [right]). ***P ≤ .0001; **P ≤ .001; Kruskal-Wallis test with Dunn’s correction for multiple comparison. (C) ICP47AT565-mediated inhibition of TAP-dependent peptide compartmentalization (means ± 95% CI, n = 6) in mDC. For ICP47AT565, a 50% inhibitory concentration value of 34 nM was calculated with a 95% CI from 24 to 46 nM. (D) Bright field images of monocytes, imDCs, and mDCs. Blue 4′,6-diamidino-2-phenylindole stain indicates the nucleus, whereas the white dashed line indicates the cell shape. Scale bars, 5 µm. (E) Intracellular TAP1 staining in monocytes, imDCs, and mDCs (means ± 95% CI, n = 5). (F) TAP1 immunoblotting of monocytes, imDCs, and mDCs. IT, isotype staining; ns, not significant.
Since monocytes undergo fundamental morphological changes during DC differentiation, we next explored the possibility of altered subcellular TAP expression and location. Monocytes changed their rounded morphology and stretched out as DCs (Figure 3D; supplemental Figure 1B). Despite reduced TAP activity, TAP1 expression increased substantially in moDCs (Figure 3E-F). This observation was counterintuitive, considering (1) the decrease in TAP activity, (2) the prolonged half-life of MHC I surface expression, and (3) the enhanced antigen-presentation capacity of DCs. Interestingly, in monocytes, TAP1 did not colocalize with the cis Golgi-specific marker GM130 (supplemental Figure 2) or with the lysosomal marker LAMP1 or the ER-specific marker calnexin (CNX; Figure 4A, top row). Instead, TAP1 colocalized with the early endosomal marker EEA1 (Figure 4A, top row). In imDCs, TAP1 did not colocalize with EEA1 but showed moderate and strong colocalization with LAMP1 and CNX, respectively (Figure 4A, middle row). Similarly, mDCs showed colocalization of LAMP1/TAP1 and CNX/TAP1 (Figure 4A, bottom row), but not of GM130/TAP1 (supplemental Figure 2) and EEA1/TAP1 (Figure 4A, bottom row). Of note, the immunolabeling patterns of LAMP1 and CNX looked overall very similar in DCs. However, upon closer inspection, it became evident that in DCs, the immunolabeling of LAMP1 appeared in small distinct vesicles and was less homogeneously dispersed throughout the cytoplasm when compared with the immunolabeling of TAP1 and CNX. The Pearson coefficient as a measure of colocalization was significantly higher for EEA1/TAP1 in monocytes than in imDCs and mDCs (Figure 4B, left panel). Correspondingly, the Pearson’s coefficients for LAMP1/TAP1 and CNX/TAP1 in imDCs and mDCs were substantially higher than in monocytes (Figure 4B, middle and right panels). Thus, during differentiation of monocytes to imDCs, TAP1 relocates from EEA1+ compartments primarily to the CNX+ ER and partially to LAMP1+ compartments. This was further confirmed in transduced moDCs expressing a TAP1mVenus fusion protein (supplemental Figures 3 and 4). Of note, the endogenous subunit TAP2 strictly colocalized with overexpressed TAP1mVenus (supplemental Figures 3 and 4). Expression of calnexin-mCherry (CNXmCherry), calreticulin-mCherry (CRTmCherry), and tapasin-mCherry (TSNmCherry) in imDCs and mDCs revealed that the PLC components TSN, CRT, and TAP1 colocalized in the CNX+ compartment (supplemental Figures 3 and 4). In immunoelectron microscopy, we identified subcellular organelles morphologically and immunolabeled TAP1 with an mAb that was coupled with 15-nm gold particles. In monocytes, TAP1 was detected in the endosomes, but not in the ER (Figure 4C-D). Moreover, in monocytes, TAP located outside of the CRT+ compartment in EEA1+ organelles (supplemental Figure 5). STORM demonstrated that in mDCs, EEA1 and GM130 did not colocalize with TAP1 (Figure 4E, first row; supplemental Figure 6). Interestingly, whereas confocal microscopy data implied a partial colocalization of LAMP1 and TAP1, STORM revealed a strict colocalization of LAMP1 and TAP1 (Figure 4E, second row). Additionally, STORM analysis indicated that the colocalization of CNX and TAP1 detected in confocal microscopy derived from very closely adjacent, but still discrete, positioning (Figure 4E, third row). This may be explained by the fact that CNX is an ER-membrane protein, but not an integral component of the PLC. As a positive control for colocalization with TAP1, transduced mDCs expressing the HCMV-derived TAP inhibitor US6 were studied. As previously reported,49 TAP1 and US6 showed strict colocalization (supplemental Figure 6). Consistently, we also found oligosaccharyl transferase (OST) in endosomes of monocytes (Figure 4F), which is an integral part of the mammalian ER translocon. OST mediates N-core glycosylation of proteins in the ER lumen and is essential for trapping the reporter peptide NST-F used in the TAP-dependent peptide compartmentalization assay. Thus, both STORM and immunoelectron microscopy further confirmed the results obtained by confocal microscopy, ie, that in monocytes, TAP1 localizes to endosomes and in DCs to lysosomes and the ER (Figure 4G). Similar observations were made for TAP2 immunolabeling (data not shown). Interestingly, ex vivo–isolated BDCA3+ DCs showed a subcellular TAP localization similar to that detected in imDCs and mDCs (supplemental Figure 7). Hence, the gain of T-lymphocyte restimulation capacity, the increase in surface MHC I residence time, and the decrease in TAP-dependent peptide compartmentalization during moDC differentiation are correlated with a subcellular relocation of TAP.
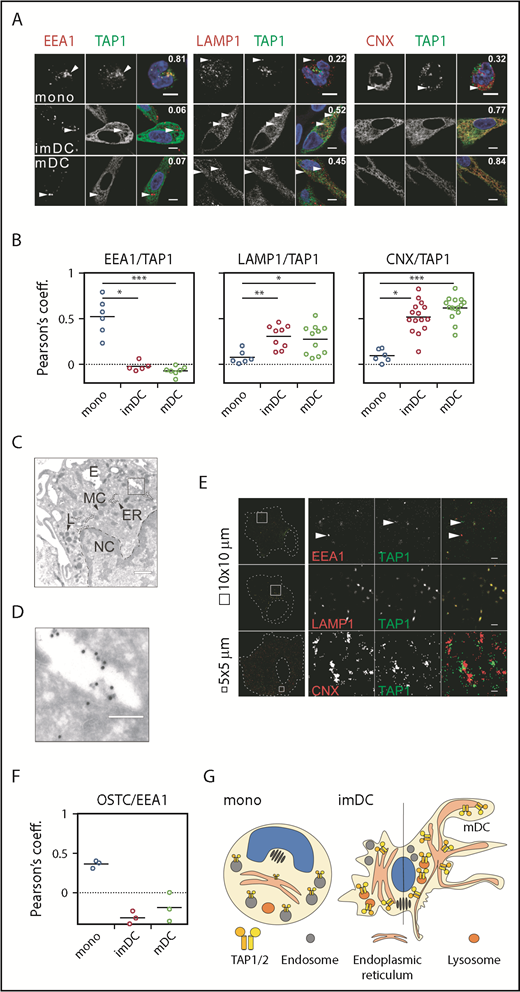
TAP location changes from endosomes to the ER and lysosomes. (A) Immunofluorescent staining of the early endosomes (EEA1), lysosomes (LAMP1), the ER membrane marker calnexin (CNX), and TAP1 in monocytes, imDCs, and mDCs. Scale bars, 5 µm. (B) Statistical analysis of Pearson coefficients obtained in 4 independent experiments (white circles represent donors; the mean is shown as a black line). ***P ≤ .0001; **P ≤ .001; *P ≤ .05; Kruskal-Wallis test with Dunn’s correction for multiple comparison. (C) Electron microscopy of monocytes. Scale bar, 500 nm. (D) Magnification of the area indicated in panel C. Scale bar, 150 nm. (E) Stochastic optical reconstruction microscopy (N-STORM) of mDCs stained for EEA1, LAMP1, CNX, and TAP1. Scale bars, 1 µm; CNX/TAP1 photo scale bar, 0.5 µm. One of 2 independent experiments is shown. (F) Statistical analysis of Pearson coefficients obtained in 2 independent experiments of OST and TAP1 costaining (white circles represent donors; the mean is shown as a black line). (G) Model of TAP relocalization during moDC differentiation. TAP is expressed in EEA1+ endosomes of monocytes and relocalizes to the ER (CNX+) and LAMP1+ lysosomes in moDCs. The size of TAP1/2 heterodimer in the cartoon is according to its protein expression level and inversely correlates with its activity. The nucleus is shown in blue and the Golgi apparatus as brown tubular structures. E, endosome, TAP1 (15-nm gold particles); ER, ER membrane stacks; L, lysosome; MC, mitochondria; NC, nucleus.
TAP location changes from endosomes to the ER and lysosomes. (A) Immunofluorescent staining of the early endosomes (EEA1), lysosomes (LAMP1), the ER membrane marker calnexin (CNX), and TAP1 in monocytes, imDCs, and mDCs. Scale bars, 5 µm. (B) Statistical analysis of Pearson coefficients obtained in 4 independent experiments (white circles represent donors; the mean is shown as a black line). ***P ≤ .0001; **P ≤ .001; *P ≤ .05; Kruskal-Wallis test with Dunn’s correction for multiple comparison. (C) Electron microscopy of monocytes. Scale bar, 500 nm. (D) Magnification of the area indicated in panel C. Scale bar, 150 nm. (E) Stochastic optical reconstruction microscopy (N-STORM) of mDCs stained for EEA1, LAMP1, CNX, and TAP1. Scale bars, 1 µm; CNX/TAP1 photo scale bar, 0.5 µm. One of 2 independent experiments is shown. (F) Statistical analysis of Pearson coefficients obtained in 2 independent experiments of OST and TAP1 costaining (white circles represent donors; the mean is shown as a black line). (G) Model of TAP relocalization during moDC differentiation. TAP is expressed in EEA1+ endosomes of monocytes and relocalizes to the ER (CNX+) and LAMP1+ lysosomes in moDCs. The size of TAP1/2 heterodimer in the cartoon is according to its protein expression level and inversely correlates with its activity. The nucleus is shown in blue and the Golgi apparatus as brown tubular structures. E, endosome, TAP1 (15-nm gold particles); ER, ER membrane stacks; L, lysosome; MC, mitochondria; NC, nucleus.
Discussion
Here, we provide evidence that the acquisition of T-lymphocyte restimulation capacity during moDC differentiation is associated with (1) an increase in the residence time of cell-surface MHC I molecules, (2) a decrease in TAP-dependent peptide compartmentalization, (3) an increase in TAP expression, and (4) TAP relocation from early endosomes in monocytes to the ER and lysosomes in moDCs. Thus, in moDCs, TAP activity seems to be regulated not by its abundance, but rather by its subcellular location and eventually by the presence of accessory proteins at the corresponding subcellular sites.
We found that antigen-pulsed monocytes conferred antigen-specific T-lymphocyte restimulation after differentiation to DCs. While this is in accordance with several previous reports,13,50,51 only one recent publication described electron-dense compartments in which antigenic peptides were stored during moDC differentiation.12 This motivated us to further address the cell-intrinsic T-lymphocyte restimulation capacity of monocytes. We chose donors expressing the HLA-A*02 allele that was previously shown to display its peptide repertoire in a partially TAP-independent manner. The HLA alleles A*01, A*03, A*11, A*24, B*15, and B*27 are loaded primarily in a TAP-dependent manner,52-54 whereas the alleles A*02, A*23, B*07, and B*08 are rather independent of TAP.55-58 Of note, US6-expressing moDCs carrying A*02/B*07 alleles also showed slightly reduced MHC I surface levels (supplemental Figure 8A), while the MHC II levels were unaffected (supplemental Figure 8B), suggesting a partial dependence of the A*02/B*07 alleles on TAP. We used HLA-A*02+ HCMV pp65 pulsed monocytes and imDCs to stimulate preexpanded pp65-specific T lymphocytes. Only pp65-pulsed imDCs, but not pulsed monocytes activated preexpanded pp65-specific T lymphocytes, as shown by IL-2 and TNF-α expression after 24 hours of coculture. Only when pulsed monocytes were differentiated to DCs, as indicated by our experiments with the IE1 antigen, they were able to confer T-lymphocyte stimulation. This suggested that monocytes were readily taking up protein from which the antigenic peptides derived, but that they were not able to restimulate T lymphocytes. Given the high functional plasticity of monocytes that are abundantly present in human blood compared with their differentiated counterparts, it is likely that monocytes will undergo phenotypic changes more readily in response to changes in the microenvironment.
We further deciphered the changes in antigen presentation with respect to antigen compartmentalization between monocytes and moDCs. TAP activity decreased in monocytes already after 24 hours of differentiation and remained low in moDCs. At the same time, the cell-surface residence time of MHC I molecules increased on DCs. At first glance, this seems counterintuitive, since APCs should not be restricted in loading of antigenic peptides. However, it is likely that high TAP activity in monocytes favors a decreased residence time of immunogenic peptide/MHC I complexes on the cell surface, which may affect T-lymphocyte stimulation. It is also conceivable that in DCs, the peptide compartmentalization is restricted to compartments that are picked up weakly in our assay, since the accumulation of the peptide relies on its glycosylation to avoid retrotranslocation into the cytosol.
Since antigen-pulsed monocytes were not able to restimulate pre-expanded CTLs, but retained the antigen for T-lymphocyte presentation once differentiated to moDCs (Figure 1B-C), a change of the PLC localization in monocytes and DCs seemed likely. In monocytes, TAP was found in early endosomes, whereas colocalization with markers for the ER or lysosomes was not, or only very weakly, detected. Additionally, OST, a central component of N-linked protein glycosylation and a key element in our TAP activity assay, was also found in early endosomes (Figure 4F). This implies that monocytes contain specialized endosomal compartments that share certain ER-specific functions such as N-core glycosylation. The concept that endosomes and ER establish contact sites for signal transduction has already been shown in cell lines59 and offers an explanation of how ER-resident proteins find their way to endosomes. Therefore, it is possible that in monocytes, the antigen processing and loading pathways are on standby mode in cellular storage compartments and relocate to the ER and, to some degree, to lysosomes in moDCs. To provide further evidence connecting changes in TAP localization with the T-lymphocyte restimulation capacity, it would be desirable to visualize the fate of intracellular antigens and investigate the restimulation capacity when TAP is sequestered in endosomes during moDC differentiation. The exact share of TAP1 located to LAMP1+ compartments in the overall TAP1 pool in DCs also needs to be studied further. However, all lines of evidence (confocal microscopy of TAP1 immunolabeled by a monoclonal antibody, TAP1 expressed as a fusion protein, and detection of TAP1 by high-resolution microscopy) show that in moDCs, a subset of the TAP1 pool is present in LAMP1+ compartments. The interaction between the ER and late endosomes or lysosomes has been shown to take place between a sensor protein on late endosomes and proteins within the ER membrane.60 This could be a possible route for the trafficking of TAP1 and other components of the PLC to late endosomes/lysosomes.
Morphological changes that take place during moDC differentiation, including elongation of the cell body, development of dendrites, and increased TAP expression, have been reported before.27,41,61 We add furthermore a decline of TAP activity and its relocation from early endosomes to the ER and lysosomes that correlates with an enhanced surface residence time of peptide/MHC I complexes.
As mentioned earlier, all human DC subsets derived from different origins can cross-present antigens in vitro upon stimulation.34-38 In vivo, classical DCs are considered the optimal pAPCs.62 However, monocytes also play a crucial role in antigen presentation in vivo. They differentiate to DCs once recruited to the site of inflammation, where they readily take up antigens to cross-prime T lymphocytes. This has been shown, for example, upon microbial stimulation, where murine moDCs localize to the T-lymphocyte area of lymph nodes, where they show APC function similar to classical DCs.62,63 Whether comparable TAP activity and TAP localization can be observed in these in vivo DC subsets or whether this is a moDC-restricted phenomenon remains to be studied.
Taken together, our data indicate that during DC differentiation, TAP-dependent intracellular antigen compartmentalization diminishes and that subcellular TAP location changes. Efficient antigen presentation is associated with a reduction in MHC I turnover, thus assuring spatiotemporal separation of antigen uptake and antigen-dependent T-lymphocyte stimulation. Our discoveries provide a new view on antigen transport routes and further highlight the role of monocytes as potent antigen accumulators.
The full-text version of this article contains a data supplement.
Acknowledgments
The authors thank Werner Tegge, head of the technology platform for peptide and chemical synthesis at the Helmholtz Centre for Infection Research, for the synthesis of NST-F peptide. They especially thank the Blutspendedienst Niedersachsen-Sachsen-Anhalt-Thüringen-Oldenburg-Bremen gGmbH, Institut Springe, for providing buffy coats. They thank Bibiana Costa for help with MHC class I recycling experiments.
This work was supported by the German Research Foundation DFG (grant SFB854, Molecular Organisation of Cellular Communication in the Immune System Z01 [W.Z.] and B15 [U.K.]; grant SFB807, Membrane Transport and Communication [R.T.]; Cluster of Excellence–Macromolecular Complexes EXC 115 [R.T.]; and Cluster of Excellence–Resolving Infection Susceptibility EXC 2155 [U.K.]), the Hannover Biomedical Research School (M.D.), the Cusanuswerk and Stiftung Dey (F.H.), the Center for Infection Biology, and the Helmholtz Virtual Institute (VH-VI-424 “Viral Strategies of Immune Evasion”) (U.K.). This work was also supported by a European Research Council Advanced Grant (R.T.).
Authorship
Contribution: M.D., H.B., and N.K. designed and performed the experiments; S.T.-Z. and B.E.-V. provided the preexpanded T lymphocytes; M.M. performed the automated microscopy; F.H., J.B., and E.G. helped perform experiments; J.W. and F.K. provided the script for the semiautomated analysis of immune fluorescence data; H.J. and J.N. performed the immunoelectron microscopy; W.Z. provided the STORM technology; M.D. prepared the figures; M.D., N.K., and U.K. prepared the manuscript; H.B. and R.T. helped prepare the manuscript; and U.K. and R.T. conceived the ideas and directed the work.
Conflict-of-interest disclosure: The authors declare no competing financial interests.
The current affiliation for M.D. is Institut Curie, INSERM U932, Paris, France.
The current affiliation for H.B. is The Francis Crick Institute, London, United Kingdom.
The current affiliation for M.M. is Central Unit for Microscopy (ZEIM), Helmholtz Centre for Infection Research, Braunschweig, Germany.
The current affiliation for F.H. is Department of Internal Medicine 5–Hematology and Oncology, University Hospital of Erlangen, Erlangen, Germany.
The current affiliation for E.G. is Section for Viral Vaccines, Division of Virology, Paul Ehrlich Institute, Langen, Germany.
Correspondence: Ulrich Kalinke, Institute for Experimental Infection Research, TWINCORE, Feodor-Lynen-Str 7-9, Hannover 30625, Germany; e-mail: ulrich.kalinke@twincore.de; and Robert Tampé, Institute of Biochemistry, Biocenter, Goethe University Frankfurt, Max-von-Laue Str 9, 60438 Frankfurt, Germany; e-mail: tampe@em.uni-frankfurt.de.

