

Key Points
T-cell receptor antibodies were used to discriminate tumor and TILs in MF skin biopsies.
This showed a surprisingly similar phenotype on TILs between patients, whereas tumor phenotype clustered into 3 groups by HLA-DR.

Abstract
Immunotherapy is a valuable treatment for many cancer patients, and there is considerable interest in understanding the mechanisms of immune evasion to guide appropriate management. Mycosis fungoides (MF) is a malignant disorder of skin-homing CD4+ T cells, and it exhibits a highly variable clinical course during which the tumor-specific immune response may be an important determinant. An unusual feature of MF is that tumor-infiltrating lymphocytes (TILs) must attempt to control a malignant cell from within their own lineage. We obtained skin biopsies and blood from 43 patients with CD4+ MF and undertook a detailed phenotypic and functional analysis of CD4+ and CD8+ T cells. Clonotypic TCRBV staining allowed delineation of malignant and reactive CD4+ subsets. CD4+ and CD8+ TILs displayed a comparable “exhausted” phenotype that was characterized by expression of PD-1 and TIGIT but retained cytotoxic activity and production of interferon-γ and interleukin-17 in early-stage disease. In contrast, tumor cells were much more heterogeneous and were divided into 3 discrete subsets based on differential expression of HLA-DR: “cold” (DR−), “exhausted” (DR+ PD-1+), and “evasive” (DR++ PD-L1+) phenotypes. Disease progression was associated with increasing divergence of the tumor phenotype away from that of TILs and reduced functional activity within TILs. These observations reveal that the phenotype and function of TIL populations are constrained at all stages of disease, whereas the tumor evolves discrete phenotypic profiles of escape during clinical progression. The findings should help to direct appropriate immunotherapeutic interventions for individual patients.
Introduction
Tumor-specific immune responses play an important role in the control of malignant disease,1 and immunotherapy is now an effective therapy for many tumor subtypes.2,3 Mycosis fungoides (MF) is a T-cell lymphoma of the skin, generally of the CD4+ lineage, and it remains incurable with current therapy. Early-stage MF (IA-IIA) has an indolent course, although 25% of patients progress to advanced-stage MF (IIB-IV), which has a median survival of 3 years.4 No treatment has been shown to prolong survival, and therapy currently focuses on skin-directed therapies in early-stage disease and systemic therapy for advanced stages of disease.
Allogeneic stem cell transplantation can sometimes establish long-term disease control and reveals susceptibility of the tumor to a “graft-versus-leukemia” immune response. Despite this, there is little understanding of the features or potential importance of autologous tumor-specific immune responses. MF tumors acquire a wide range of genetic mutations,5,6 which could represent a potential source of neoantigens for recognition by tumor-infiltrating lymphocytes (TILs). Indeed, a substantial immune infiltrate is often observed, and CD8+ T-cell infiltration is correlated positively with disease control.7 PD-L1 expression on tumor cells is seen in some cases8,9 and may correlate with response to checkpoint blockade,10 although the overall response rate is relatively disappointing (∼15%-38%).9,11
Analysis of the immune microenvironment within MF could help to guide the rational introduction of immunotherapeutic management. However, the difficulty of distinguishing between the T-cell tumor cells and the reactive T-cell infiltrate remains a considerable challenge. Here, we used T-cell receptor (TCR)–based identification of the tumor population to undertake a detailed phenotypic and functional analysis of the CD4+ and CD8+ TILs and contrast this with features of the malignant cells. We demonstrate that TILs express a homogeneous phenotype and function across all patient groups, whereas tumor cells are markedly heterogeneous between different patients but fall into 3 broad groups based on the relative expression of HLA-DR. Moreover, disease progression is characterized by increasing divergence of the tumor cell phenotype away from that of TIL subpopulations. These observations should prove of value in understanding the mechanisms of tumor evasion and for guiding personalized immunotherapeutic interventions.
Methods
The study received ethical permission from the regional ethics committee (West Midlands–Coventry and Warwickshire Research Ethics Committee) on 8 January 2016, and all participants gave written informed consent as per the Declaration of Helsinki. A 6-mm punch biopsy and 20 mL of peripheral blood (PB) were taken from patients with MF. PB was analyzed from 10 age-matched healthy donors, and 2 patient skin biopsies were taken at sites of uninvolved normal skin.
Patients with patch, plaque, or tumor MF were selected. The 1 patient with Sézary syndrome had tumorous skin involvement. The age, stage, previous treatments, and time since diagnosis were recorded.
Generation of single-cell suspension
The biopsy was macerated with scalpels, added to 5 mL of growth media (RPMI 1640 [Sigma-Aldrich], 10% fetal calf serum, 1% L-glutamine, 1% penicillin-streptomycin) and 0.1% weight-to-volume ratio (w/v) collagenase D (Sigma-Aldrich) and placed on a rotator (Miltenyi Biotec) overnight at 37°C prior to filtration through a 70-μm filter. PB was diluted 1:1 with wash media (RPMI 1640 [Sigma-Aldrich], 1% penicillin-streptomycin), layered on Lymphoprep (Axis-Shield), and centrifuged at 2000 rpm for 30 minutes without brake. The PB mononuclear cell (PBMC) layer was extracted and washed twice (1500 rpm, 10 minutes) with wash media (Figure 1).
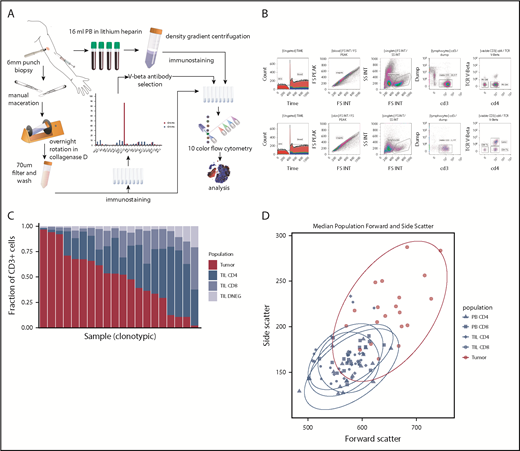
Method and cell population determination. (A) Illustration of method. (B) Example of flow cytometry gating of skin and PBMC samples. (C) Plot of T-cell constituent populations in clonotypic samples. In the penultimate 3 samples, the clonotypic population represented >40% of the CD4low (DNEG) population; in the last sample, the clonotype was >40% of the PB CD4+ cells. (D) Mean forward and side scatter of the 5 analyzed populations.
Method and cell population determination. (A) Illustration of method. (B) Example of flow cytometry gating of skin and PBMC samples. (C) Plot of T-cell constituent populations in clonotypic samples. In the penultimate 3 samples, the clonotypic population represented >40% of the CD4low (DNEG) population; in the last sample, the clonotype was >40% of the PB CD4+ cells. (D) Mean forward and side scatter of the 5 analyzed populations.
Analysis of TCRBV expression on T cells within tumor
Cells were suspended in 100 μL of MACS buffer (Oxoid Phosphate Buffered Saline, bovine serum albumin [0.5% w/v], and EDTA [0.07% w/v]) and stained with Fc blocker (TruStain FcX; BioLegend), followed by anti-CD3, -CD4, -CD8, -CD7, and -TCRBV region-specific antibodies for 30 minutes. After washing, viability dye was added (propidium iodide; Miltenyi Biotec), and cells were analyzed on a Beckman-Coulter Gallios flow cytometer at low speed. FCS3 files were analyzed in Kaluza (v1.5), and “clonograms” were generated based on TCRBV-specific staining. Nonclonotypic samples had peak TCRBV populations representing <25% of the repertoire, whereas clonotypic samples were defined as those representing >40% of the repertoire.
Flow cytometric analysis of immune checkpoint expression
Cells were stained with Fc blocker, anti-CD3 (SK7, APC-Cy7; BioLegend), anti-CD4 (OKT4, AF700; BioLegend), anti-CD8 (RPA-T8, BV510; BioLegend), the selected anti–TCR-Vβ (phycoerythrin [PE]/FITC; Beckman-Coulter), anti-CD14 (HCD14, PE/Dazzle 594; BioLegend), anti-CD19 (HIB19, PE/Dazzle 594; BioLegend), anti-CD56 (5.1H11, PE/Dazzle 594; BioLegend), anti–PD-1 (EH12.2H7, PE-Cy7; BioLegend), anti–PD-L1 (29E,2A3, BV421; BioLegend), anti–PD-L2 (MIH18, APC; BioLegend), anti-TIGIT (MBSA43, PerCP-EF710; eBioscience), anti–TIM-3 (F38-2E2, BV421; BioLegend), anti-LAG3 (11C3C65, AF647; BioLegend), anti-galectin 9 (PM1-3, PerCP-Cy5.5; BioLegend), anti–HLA-DR (LN3, PE-Cy7; BioLegend), anti–MHC-I (W6/32, PE-Cy7; BioLegend), anti-CD95 (DX2, BV421; BioLegend), and anti-Fas Ligand (NOK1, APC; BD Biosciences). Cells were stained for 30 minutes at 4°C, washed in MACS buffer, and stained with propidium iodide prior to analysis.
Identification of regulatory T cells
Cells were washed twice with phosphate buffered saline (PBS; Oxoid Phosphate Buffered Saline, Dulbecco A) prior to addition of fixable viability dye and Fc receptor blocker (BioLegend). Antibodies against CD3, CD4, CD8, CD25, and the identified “clonotypic” TCRBV were used to stain cells prior to permeabilization (Human FoxP3 Buffer Set; BD Biosciences) and staining with anti-FoxP3 (259D, AF647; BioLegend).
Intracellular cytokine staining
Cells were added to 1 mL of warm growth media supplemented with 1× protein transport inhibitor cocktail (eBioscience), with or without cell stimulation cocktail (eBioscience), and incubated at 37°C, 5% CO2 for 4 hours. Samples were agitated, washed twice with PBS, and resuspended in 10 μL of PBS. Fixable viability dye was added, followed by FcR block. Antibodies against CD3, CD4, CD8, and specific TCRBV were added, and samples were incubated in the dark for 20 minutes, washed, and resuspended. A total of 50 μL of 4% paraformaldehyde (Sigma-Aldrich) was added, and samples were vortexed, incubated for 15 minutes, washed in MACS buffer, resuspended in supernatant of 1% saponin (Sigma-Aldrich), and incubated for 10 minutes in the dark at room temperature. Intracellular cytokine antibodies (against interferon-γ [IFN-γ] B27 PerCP-Cy5.5; interleukin-4 [IL-4] MP4-25D2 PE-Cy7; IL-10 JES3-19F1 APC, and IL-17A BL168 BV421; BioLegend) were added to samples, which were incubated for 25 minutes in the dark at room temperature prior to washing and analysis.
Flow cytometric analysis
FCS3-format flow cytometry data were analyzed with Kaluza (Beckman-Coulter v1.5) using a sequential gating strategy to identify singlets, lymphocytes, and T cells and using a Boolean strategy to identify the 5 populations of interest: PB CD8 (CD3+ CD8+ PB), PB CD4 (CD3+ CD4+–specific Vβ− PB), TIL CD8 (CD3+ CD8+ skin), TIL CD4 (CD3+ CD4+–specific Vβ− skin), and tumor (CD3+ CD8−–specific Vβ+ skin). Specific parameters were obtained by gating on negative populations or by measuring geometric mean of fluorescence. The fluorescence was compensated using single-stained beads. Further analysis was performed in R.12 Geometric mean of fluorescence was transformed using the inverse hyperbolic sine, and then fold change was calculated by subtracting transformed skin expression from transformed PBMC expression.
Results
Staining with TCRBV-specific antibody can distinguish between tumor and TIL populations in many cases of MF
A total of 49 skin biopsies and blood samples was obtained from 43 patients, of whom 42 had MF stage IA (n = 7), IB (n = 17), IIA (n = 1), IIB (n = 14), IIIA (n = 1), or IVA2 (n = 2), and 1 had Sézary syndrome IVA1 (n = 1) with tumor-stage skin disease. If >1 biopsy was obtained from a patient, they were from different skin lesion types (eg, plaque and tumor) (Table 1).
Clinical features of patients
| Feature | Value |
|---|---|
| Diagnosis, n | |
| MF | 42 |
| Sézary syndrome* | 1 |
| Clinical characteristics | |
| Age, median (range), y | 67 (26-86) |
| Died | 6 (14) |
| Erythrodermic | 3 (6) |
| Patch-stage lesions | 4 (8) |
| Plaque-stage lesions | 21 (42) |
| Tumor-stage lesions | 19 (38) |
| Normal skin | 2 (4) |
| SCC (excluded) | 1 (2) |
| Pathological characteristics | |
| Large cell | 14 (33) |
| CD8 phenotype | 1 (2) |
| Ki67, median (range), % | 31 (0-100) |
| Folliculotropic | 21 (49) |
| Stage, n | |
| IA | 7 |
| IB | 17 |
| IIA | 1 |
| IIB | 14 |
| IIIA | 1 |
| IVA1 | 1 |
| IVA2 | 2 |
Unless otherwise noted, data are n (%).
SCC, squamous cell carcinoma.
With tumors showing large cell transformation.
A single TCRBV-specific antibody stained between 43.1% and 97.6% of the total CD4+ (n = 14) or CD4low (n = 4) T-cell repertoire in 18 patients (43%), and these samples were deemed clonotypic (Figure 1C). In 1 case of blood involvement, the clonotype represented >40% of the PB CD4 population but 12% of tissue CD4+ T cells. In contrast, peak TCRBV-specific staining ranged from 0.45% to 23.3% of cells in nonclonotypic samples. Clonotypic cells were assumed to represent the MF tumor lymphocytes, whereas CD4+ T cells that stained with the other TCRBV-specific antibodies were identified further as TILs. Importantly, the size and cellular complexity (as determined by forward scatter and side scatter, respectively, on fluorescence-activated cell sorting) were markedly increased on the tumor population (P < .0001, Wilcoxon rank-sum test [Wilcoxon]). CD7 expression was also downregulated on tumor cells in 4 of 5 cases examined. MF tumors expressed a range of TCRBV families, and no pattern of TCR conservation was observed within the group (data not shown).
Tumor-infiltrating CD4+ and CD8+ lymphocytes express a homogeneous PD-1+ TIGIT+ “exhausted” phenotype
In initial studies, we examined the membrane phenotype of CD4+ and CD8+ TILs and compared it with tumor and PB (PBMCs). CD4+ and CD8+ TILs exhibited coexpression of a range of exhaustion markers, and it was noteworthy that this phenotype was broadly similar in patients at different disease stage. Notably, CD4 TILs showed strong upregulation of PD-1 (P < .0001) and TIGIT (P < .0001) compared with PBMCs, although the levels of LAG-3 were low. TIM-3 expression was higher on TILs compared with patient PBMCs (P < .001 and P < .01 for CD8 and CD4) but not control PBMCs. Expression of MHC-I, MHC-II (HLA-DR), and Fas was markedly increased on TILs (P < .001, P < .0001, and P < .0001), but PD-L1 and PD-L2 levels were similar to blood (Figure 2). Analysis of T cells from skin biopsies of uninvolved areas showed lower expression of PD-1, Fas, TIGIT, and HLA-DR compared with TILs (data not shown). The coexpression profile of checkpoint proteins is a more reliable marker of functional T-cell exhaustion compared with single expression. As such, we also examined the pattern of coexpression of PD-1 and TIGIT on CD4+ and CD8+ TILs, which revealed that a median of >30% of TILs expressed PD-1 and TIGIT compared with <10% of cells within blood (supplemental Figure 1).
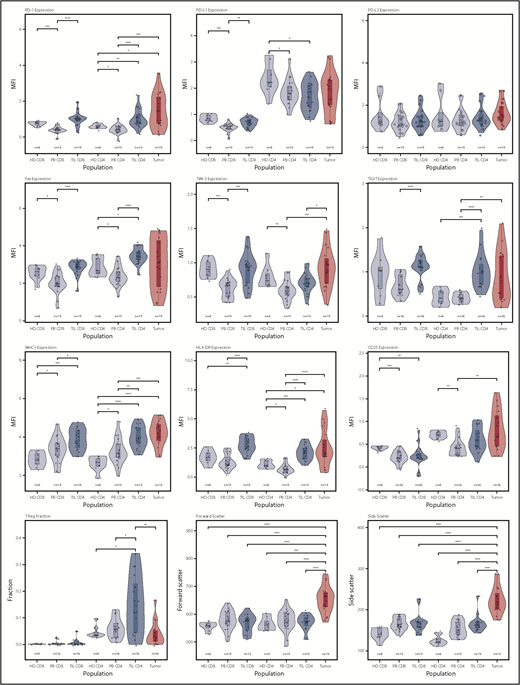
Violin plots of populations of interest for measured parameters. This shows the general trend for upregulation of immune checkpoint receptors on the TIL populations, as well as the heterogeneity of the tumor populations in specific markers, particularly PD-1, PD-L1, FasR, TIGIT, and HLA-DR. *P < .05; **P < .01; ***P < .001; ****P < .0001.
Violin plots of populations of interest for measured parameters. This shows the general trend for upregulation of immune checkpoint receptors on the TIL populations, as well as the heterogeneity of the tumor populations in specific markers, particularly PD-1, PD-L1, FasR, TIGIT, and HLA-DR. *P < .05; **P < .01; ***P < .001; ****P < .0001.
The proportion of regulatory T cells (Tregs) within TILs was determined by assessment of the Foxp3+ CD25+ subpopulation. Tregs were increased substantially compared with PBMCs, although a wide variation was observed between different tumors (median, 17%; range, 0-34% vs 6% PBMCs; P = .006, Wilcoxon signed-rank test [paired Wilcoxon]). Treg populations were low within blood, although an increase from 4% to 8% was seen with increasing clinical stage (group IB vs IIB, P = .04, Wilcoxon; data not shown).
Interestingly, the phenotype of CD8+ TILs was virtually identical to that of CD4+ TILs, with a PD-1+ TIM-3+ TIGIT+ Fas+ profile and increased levels of HLA class I and class II. Again, TIM-3 levels were lower on patient PBMCs compared with those from healthy donors.
This CD4+ and CD8+ TIL phenotype reveals that both subpopulations are undergoing sustained T cell signaling and is most likely to reflect chronic antigenic recognition of tumor.
Tumor cells display phenotypic heterogeneity and can be separated into 3 groups based on relative expression of HLA-DR
We next studied the phenotype of MF tumors and observed extreme heterogeneity compared with TILs (Figure 2). Interestingly, many tumors shared the same exhausted (PD-1+ TIM-3+ TIGIT+) phenotype that had been observed on TILs, and expression of PD-1 and TIGIT was remarkably high in some tumors. Fas and CD25 expression was also highly variable. Interestingly, PD-L1 and PD-L2 expression was not increased in MF, and there was no evidence of downregulation of MHC-I expression. HLA class II (HLA-DR) expression was highly variable, with different tumors characterized by absent, low, or high expression. Foxp3+ expression was observed at a median level of 2% (range, 0-17%; P < .001 vs CD4 TILs, paired Wilcoxon), indicating that MF tumors are not primarily of a regulatory phenotype, although Foxp3+ cells represented >10% of tumor cells in 2 tumors (Figure 2).
Principal component analysis was used to examine the pattern of coexpression of surface markers on tumors and TILs. This showed that CD4 and CD8 TILs clustered together closely, whereas tumor populations were distributed in 3 groups (Figure 3A).

Analysis of tumor groups. (A) Principal component analysis of 3 microenvironment populations (CD4 TILs, CD8 TILs, and tumor) in clonotypic samples demonstrates the similarity of the TIL populations across patients, as well as the heterogeneity of the tumor populations, which appear to cluster in 3 groups. (B) Heat map of the 3 tumor populations clustered using K-means into 3 groups: evasive, exhausted, and cold. The different phenotypes of these groups can be visualized, particularly in the PD-1, PD-L1, HLA-DR, FasR, and MHC-I parameters. The data are color-coded by fold change expression of surface marker vs PB equivalent subset (red = increase, blue = decrease). (C) Comparison of the 3 clusters’ phenotype, including CD4 and CD8 TILs. (D) tSNE dimension reduction of the representative samples from each subgroup. The “evasive” group is characterized by high PD-L1 tumor expression, compared with high PD-1 expression in the “exhausted” group. The “cold” group is characterized by low HLA-DR on the tumor cells, and the TIM-3+ TIL CD8+ subset can be seen here. *P < .05; **P < .01. ns, not significant.
Analysis of tumor groups. (A) Principal component analysis of 3 microenvironment populations (CD4 TILs, CD8 TILs, and tumor) in clonotypic samples demonstrates the similarity of the TIL populations across patients, as well as the heterogeneity of the tumor populations, which appear to cluster in 3 groups. (B) Heat map of the 3 tumor populations clustered using K-means into 3 groups: evasive, exhausted, and cold. The different phenotypes of these groups can be visualized, particularly in the PD-1, PD-L1, HLA-DR, FasR, and MHC-I parameters. The data are color-coded by fold change expression of surface marker vs PB equivalent subset (red = increase, blue = decrease). (C) Comparison of the 3 clusters’ phenotype, including CD4 and CD8 TILs. (D) tSNE dimension reduction of the representative samples from each subgroup. The “evasive” group is characterized by high PD-L1 tumor expression, compared with high PD-1 expression in the “exhausted” group. The “cold” group is characterized by low HLA-DR on the tumor cells, and the TIM-3+ TIL CD8+ subset can be seen here. *P < .05; **P < .01. ns, not significant.
K-means clustering was used to interrogate tumor subsets further and results were displayed as a heat map of protein expression in MF (Figure 3B). This demonstrates that the 3 groups can be separated, based on HLA-DR expression, into a small group that lacks expression of HLA-DR and virtually all other markers (n = 3), a dominant proportion of tumors that expresses HLA-DR together with PD-1 and TIGIT (n = 13), and a small proportion of MF with very high HLA-DR expression associated with Fas and PD-L1 expression (n = 4). On the basis of this profile, we chose to classify these subsets as “cold,” “exhausted,” and “evasive” tumors, which represent 17%, 66%, and 17% of all cases.
The TIL phenotype is comparable across all 3 tumor subtypes
To relate tumor phenotype to that of their associated TILs, we next examined the profile of coexpression across the 3 subgroups (Figure 3C). Importantly, the TIL profile was homogeneous across the 3 subsets and no difference in the “exhaustion” profile or proportion of Tregs was observed. Indeed, the only difference was a modest decrease in Fas expression on CD4+ TILs in the setting of “cold” tumors.
T-distributed stochastic neighbor embedding (tSNE) dimension reduction separated tumor and TIL subsets and allowed visualization of the relative magnitude of the 2 populations and the heterogeneity of surface expression within subpopulations. Although aggregate analysis of TILs had shown consistent upregulation of immune checkpoint inhibitory receptors, the tSNE plot did reveal some heterogeneity in receptor expression (Figure 3D). These findings show that the TIL phenotype is “frozen” across all subtypes of MF tumor and is not related to tumor phenotype.
TILs and tumor cells display differential profiles of cytokine production
We next examined the profile of cytokine production within TIL and tumor populations. T cells were stimulated with mitogens prior to assessment of IFN-γ, IL-4, IL-10, and IL-17 expression. Interestingly, substantial levels of cytokine production were observed from the TIL and tumor populations, indicating that both subsets retain some functional capacity.
Cytokine production from tumor cells was seen in almost all cases (Figure 4A). Secretion of IL-17 and IL-4 was particularly increased (P = .04, Wilcoxon), and the median percentage of tumor cells producing IFN-γ, IL-17, IL-4, and IL-10 was 8%, 21%, 11%, and 1%, respectively, although the range was wide.

Cytokine production. (A) Cytokine production in the T cell subsets. Production of IL-17 was high in the microenvironment in tumors and TILs. IL-4 production was elevated only in the tumor population. Tumor and TILs were capable of producing IFN-γ. IL-10 production occurred in a handful of tumor cases, but the median IL-10 production was highest in the CD4 TIL population. (B) tSNE clustering of cytokine data, which shows the T helper cell subsets of the immune response. This tumor was a producer of IL-17 and IL-4. *P < .05; **P < .01; ***P < .001; ****P < .0001.
Cytokine production. (A) Cytokine production in the T cell subsets. Production of IL-17 was high in the microenvironment in tumors and TILs. IL-4 production was elevated only in the tumor population. Tumor and TILs were capable of producing IFN-γ. IL-10 production occurred in a handful of tumor cases, but the median IL-10 production was highest in the CD4 TIL population. (B) tSNE clustering of cytokine data, which shows the T helper cell subsets of the immune response. This tumor was a producer of IL-17 and IL-4. *P < .05; **P < .01; ***P < .001; ****P < .0001.
Within nontumor CD4+ cells, the most striking feature was substantial IL-17 production within TILs and PBMCs. IFN-γ and IL-17 were also the predominant cytokines produced by CD8+ TILs (median, 46% and 48%, respectively), and IL-17 production within CD8+ PBMCs was substantially increased compared with control PBMCs (median, 29% vs 6%), revealing a powerful influence of MF on systemic cytokine production. tSNE plots revealed some heterogeneity of cytokine production within tumor and TIL subsets (Figure 4B).
The tumor cell phenotype diverges further from that of TILs during disease progression
We next assessed how the phenotype of tumors and TILs was related to disease stage or clinical progression. Clinical stage was correlated initially to the expression of individual surface proteins on all lymphoid populations (tumors, TILs, and PBMCs), but no correlations were observed after multiple testing correction. The 3 major phenotypic subsets of MF also were not related to clinical stage or degree of TIL infiltrate. A decrease in LAG-3 on CD4 and CD8 PBMCs (P = .027 and P = .016, Wilcoxon) was seen in relation to increasing stage.
However, because MF tumor phenotype had been observed to diverge markedly from that of TILs, we also investigated whether this dissimilarity was related to disease activity. As such, the Euclidean distance between tumor phenotype and CD4 TIL was determined for each sample and related to clinical factors.
As anticipated, the phenotype of individual CD4+ and CD8+ TIL populations was very similar to that of the mean CD4+ TILs, whereas tumor populations exhibited a significant divergence (Figure 5A). However, a markedly higher deviation from consensus TIL phenotype was apparent in advanced disease (tumor vs patch and plaque, P = .022, Figure 5B). As such, the phenotype of the tumor most closely resembles that of TILs in early-stage disease but diverges away from this during disease progression.
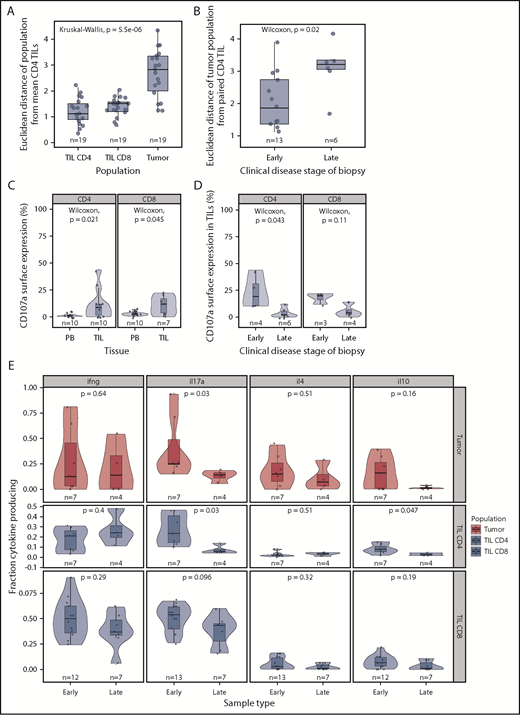
Phenotypic and functional changes with clinical stage. (A) Euclidean distance between the “average CD4+ TIL phenotype” and that of individual CD4+ TIL, CD8+ TIL, and MF tumor phenotypes. This demonstrates that the MF tumor phenotype diverges markedly from that of the TIL populations. (B) Euclidean distance between the CD4+ TIL phenotype and that of the MF tumor phenotype in relation to the clinical stage of the disease. Early-stage disease was defined as patch and plaque, whereas late-stage disease included only the tumor subtype. The MF phenotype is seen to diverge most markedly from that of the TIL populations in biopsies from patients with late-stage disease. (C) CD107a surface expression is higher in TILs compared with matched blood, suggesting recent microenvironment degranulation. (D) CD107a surface expression is lower with increasing clinical stage. (E) Cytokine production by stage, demonstrating a general trend for decreased cytokine production in later stages, significant in IL-17 and IL-10 in CD4 TILs.
Phenotypic and functional changes with clinical stage. (A) Euclidean distance between the “average CD4+ TIL phenotype” and that of individual CD4+ TIL, CD8+ TIL, and MF tumor phenotypes. This demonstrates that the MF tumor phenotype diverges markedly from that of the TIL populations. (B) Euclidean distance between the CD4+ TIL phenotype and that of the MF tumor phenotype in relation to the clinical stage of the disease. Early-stage disease was defined as patch and plaque, whereas late-stage disease included only the tumor subtype. The MF phenotype is seen to diverge most markedly from that of the TIL populations in biopsies from patients with late-stage disease. (C) CD107a surface expression is higher in TILs compared with matched blood, suggesting recent microenvironment degranulation. (D) CD107a surface expression is lower with increasing clinical stage. (E) Cytokine production by stage, demonstrating a general trend for decreased cytokine production in later stages, significant in IL-17 and IL-10 in CD4 TILs.
Disease progression is also associated with reduced functional activity within TIL populations
Finally, we contrasted cytokine production and cytotoxic activity in early-stage (patch or plaque) or late-stage disease (tumor). Cytokine production was decreased during disease progression, and the most significant reduction was in relation to IL-17 production: 4.7- and 1.3-fold decreases in median expression were observed within CD4+ TIL and CD8+ TIL populations, respectively (Figure 5E). A small decrease in IL-10 production was also seen in CD4+ TILs in late-stage disease (P = .047, Wilcoxon). CD107a expression was observed on 17% and 19% of CD4+ and CD8+ T cells, respectively, in early-stage disease, but this decreased markedly to 2% and 4% of cells within late-stage tumors (Figure 5C-D).
Discussion
The treatment of advanced MF remains poor, and immunotherapy may offer new opportunities.13,14 The introduction of checkpoint inhibitors is showing some promise, with objective and stable responses in 38% of patients in a recent report.11 As such, it is now important to understand the biological basis for the heterogeneity of disease response and identify opportunities for appropriate targeting of immunotherapy.9
TILs are correlated with clinical outcome in many tumors,15 and we were able to use TCRBV-specific staining to discriminate between TILs and tumor cells and contrast their phenotypic and functional features in early- and late-stage disease.16,17
The most striking feature of TILs was expression of a range of inhibitory checkpoint receptors in a profile typical of the “exhaustion” documented in other cancer settings. The profile was very similar between CD4+ and CD8+ populations and was characterized by coexpression of PD-1 and TIGIT. PD-1 expression is induced by chronic TCR engagement; it is likely that this reflects antigenic recognition of tumor cells, although we did not examine functional interactions within this study. Of note, the TIL phenotype was found to be strikingly homogeneous between patients and within individual patients at different stages of disease. This shows that the tumor-specific immune response is constrained in its degree of plasticity during disease progression.
In contrast, the phenotype of the MF tumor cell clustered into 3 distinct groups that were characterized by variable levels of HLA-DR expression: high, medium, and low. We term these groups as “cold” (HLA-DR−), “exhausted” (HLA-DR+ and PD-1+), and “evasive” (HLA-DR++ and PD-L1+). The “exhausted” subgroup was the most common and expressed high levels of PD-1, which must again reflect continued physiological TCR engagement or aberrant intracellular signaling. Nguyen et al18 also demonstrated PD-1 expression in >60% of cases of MF and showed this to be useful in the differential diagnosis from PD-1− tumors, such as cutaneous lymphoid dyscrasia or primary cutaneous anaplastic large cell lymphoma. High-level PD-1 expression on CD4+ T cells is also not a feature of inflammatory skin diseases, such as psoriasis.19
If PD-1 expression does indeed reflect chronic physiological TCR engagement, this suggests that local autoantigen recognition may play a role in development of disease.20 High levels of HLA-DR are observed on keratinocytes in MF and indicate the potential for peptide presentation to CD4+ T cells.21,22 In addition, it is possible that MF tumor cells recognize peptide targets on other tumor cells or TILs; functional studies will be required to address this question. Finally, it must also be considered that PD-1 expression may represent a response to aberrant TCR-associated signaling resulting from tumor-associated somatic mutations.23 Assessment of PD-1 expression on tumors may act as an important determinant of outcome, although interpretation of immunohistochemical and fluorescence-activated cell sorting–based assays can be challenging.24,25 In contrast to relatively high levels of PD-1 expression, PD-L1 was increased on only 35% of tumors and was observed in association with high HLA-DR. As such, our data, in contrast to some degree with other reports,8 suggest that the role of PD-L1 in MF tumor evasion may be less salient than in many other tumors. Fas and FasL also appear to be important regulators of clinical progression, and high levels were observed on TILs, although they were downregulated on CD4+ PBMCs26 during disease progression.27 Fas expression in MF is often associated with high levels of FLICE inhibitory protein28 and emphasizes that future work will be required to assess the relationship between somatic mutation and surface phenotype.29 These observations suggest that T cells are undergoing considerable proliferation within MF lesions, and high levels of Ki67 expression are indeed observed in cells within the epidermis, although not in dermal populations.30
The relative expression of HLA-DR was the major discriminating factor in relation to tumor phenotype. This might reflect recent TCR engagement,30 although HLA-DR is also expressed aberrantly on many tumors and correlates with PD-L1 expression and response to checkpoint blockade.31 The physiological role of HLA-DR expression in relation to immune surveillance is uncertain, because it may present peptide to tumor-specific CD4+ effector cells and Tregs. HLA-DR engagement can also instigate biochemical pathways that may directly favor tumor growth32 ; therefore, its role may go beyond antigen presentation. Of note, high-level HLA-DR expression on MF tumors did correlate with PD-L1 expression, but no differences were observed in the relative proportion of Tregs in this subgroup.
The measurement of cytokine production by tumors and TILs revealed a range of novel observations. Perhaps most significant was the finding that both groups were not functionally exhausted but retained high-level expression of cytokines. These cytokines could represent novel targets for therapy, and a common feature, which paralleled membrane phenotype, was that the pattern of production by TILs was largely homogeneous, whereas that of tumor cells exhibited considerable diversity. CD4+ and CD8+ TILs expressed a predominant pattern of IFN-γ and/or IL-17 production, seen in ∼25% and 50% of cells, respectively. Expression of IL-17 might represent selection for cells with potent tumor-specific activity or could simply reflect its role in cutaneous immune responses.33 Production of IL-4 and IL-10 was very low within the TIL groups. In contrast, tumors expressed high levels of cytokines, most notably IL-4 and IL-17, although the pattern varied markedly in different patients. The production of IL-4 supports previous reports showing a T helper 2 cell bias in MF and a direct role for IL-4 in suppression of T helper 1 cell cytokine production from TIL populations.16 IL-17 was also highly expressed by many tumors, as previously reported.34,35 Interestingly, the IFN-γ/IL-17 ratio within CD4+ and CD8+ PBMCs was 12.4 and 9.7, respectively, in healthy donors but fell to only 1.35 and 1.46 in patients. This systemic influence of MF has been observed previously and exemplifies how a localized cutaneous lesion can markedly influence cytokine production within the peripheral lymphoid repertoire.34,36
As previously reported, the expression of IL-17 decreased during disease progression.34 IL-23 is the major regulator of IL-17 production, and high levels of IL-23 are present within epidermal keratinocytes and dermal lymphocytes in patients with MF. Interestingly, expression is lower in patients with advanced disease and may explain the associated reduction in IL-17.37 Therefore, IL-17–IL-17R axis may represent a potential target for MF treatment, particularly in earlier-stage disease. Antibody-mediated blockade of IL-17 is highly effective in the treatment of psoriasis but has not, to our knowledge, been used in patients with MF.
The divergence of the tumor cell phenotype away from TILs increased during disease progression and would suggest that TILs act to control localized disease, but stochastic acquisition of genetic and epigenetic changes within the MF tumor lead to tumor evasion (Figure 6). This was confirmed by a decrease in degranulation and cytokine production by TILs in late-stage disease. Importantly, our study shows that tumor escape may occur along 3 major phenotypic pathways discriminated by the relative expression of HLA-DR.23 Given the significant heterogeneity of MF and the relatively limited sample size in our study, it will now be important that these observations are repeated on a confirmatory dataset.

Model to explain the clinical progression of mycosis fungoides. The MF clone produces a range of cytokines, predominantly IL-4 and IL-17, and initiates an immune response from TILs, even in early-stage disease. TILs develop an exhausted phenotype due to chronic engagement with tumor but continue to produce IFN-γ and IL-17. Disease progression occurs when the tumor evolves to attain 1 of 3 phenotypes that allow it to proliferate, despite continuing immune recognition from TILs. This state is associated with markedly reduced production of IL-17 by tumor and TIL populations.
Model to explain the clinical progression of mycosis fungoides. The MF clone produces a range of cytokines, predominantly IL-4 and IL-17, and initiates an immune response from TILs, even in early-stage disease. TILs develop an exhausted phenotype due to chronic engagement with tumor but continue to produce IFN-γ and IL-17. Disease progression occurs when the tumor evolves to attain 1 of 3 phenotypes that allow it to proliferate, despite continuing immune recognition from TILs. This state is associated with markedly reduced production of IL-17 by tumor and TIL populations.
Our findings uncover the complex phenotypic and functional relationships within tumor and TIL subpopulations in MF. These are likely to influence the efficacy of immunotherapy and may provide an explanation for the heterogeneous responses reported with immune checkpoint therapy. Therefore, characterization of the immune microenvironment may come to represent an important tool to guide personalized clinical management.
The full-text version of this article contains a data supplement.
Acknowledgments
The authors thank Richard Stevens for statistical advice, Vanessa Sternkopf and Allison Howles for help with clinic logistics and obtaining biopsies, Joanne Croudace for developing and teaching skin dissociation protocol, and Guido Frumento for providing age-matched healthy donor PBMCs.
This work was supported by the Medical Research Council.
Authorship
Contribution: P.M., J.J.S., and D.M. developed the idea for the experimental project; D.M. obtained consent from patients; D.M. and J.L.M. processed samples and carried out experiments with supervision by S.E. and H.P.; D.M. and J.L.M. analyzed results with supervision by N.D.; and D.M., J.J.S., and P.M. wrote the manuscript with input from S.E., H.P., and N.D.
Conflict-of-interest disclosure: J.J.S. has acted as a consultant for and received honoraria from Millennium Pharmaceuticals and Mallinckrodt and has served as a consultant for Innate Pharma and Actelion. The remaining authors declare no competing financial interests.
Correspondence: Duncan Murray, c/o Paul Moss, Denis Howell Building, Institute of Immunology and Immunotherapy, University of Birmingham, Birmingham BT15 2TH, United Kingdom; e-mail: duncanjamesmurray01@gmail.com.

