

Key Points
Therapy-related ALL is a distinct entity associated with poor-risk cytogenetics and inferior survival compared with de novo ALL.
Hematopoietic stem cell transplantation may improve outcomes and should be considered for all eligible patients with therapy-related ALL.

Abstract
Patients with therapy-related acute lymphoblastic leukemia (t-ALL) represent a small subset of acute lymphoblastic leukemia (ALL) patients who received genotoxic therapy (ie, chemotherapy or radiation) for a prior malignancy. These patients should be distinguished from patients with de novo ALL (dn-ALL) and ALL patients who have a history of prior malignancy but have not received cytotoxic therapies in the past (acute lymphoblastic leukemia with prior malignancy [pm-ALL]). We report a retrospective multi-institutional study of patients with t-ALL (n = 116), dn-ALL (n = 100), and pm-ALL (n = 20) to investigate the impact of prior cytotoxic therapies on clinical outcomes. Compared with patients with pm-ALL, t-ALL patients had a significantly shorter interval between the first malignancy and ALL diagnosis and a higher frequency of poor-risk cytogenetic features, including KMT2A rearrangements and myelodysplastic syndrome-like abnormalities (eg, monosomal karyotype). We observed a variety of mutations among t-ALL patients, with the majority of patients exhibiting mutations that were more common with myeloid malignancies (eg, DNMT3A, RUNX1, ASXL1), whereas others had ALL-type mutations (eg, CDKN2A, IKZF1). Median overall survival was significantly shorter in the t-ALL cohort compared with patients with dn-ALL or pm-ALL. Patients who were eligible for hematopoietic cell transplantation had improved long-term survival. Collectively, our results support t-ALL as a distinct entity based on its biologic and clinical features.
Introduction
Therapy-related myeloid neoplasms are well-characterized long-term complications of cytotoxic cancer therapy (ie, chemotherapy and radiation).1 The genotoxic effect on hematopoietic progenitor cells is linked to the increased risk of developing therapy-related myelodysplastic syndrome (MDS) and acute myeloid leukemia (AML).2 Both of these entities are recognized by the World Health Organization classification of myeloid neoplasms and have been associated with poor cytogenetic and molecular features, lower response rates to standard therapies, and inferior survival outcomes.3 A subset of patients who have received cytotoxic therapies for a prior malignancy may also develop therapy-related acute lymphoblastic leukemia (t-ALL).4 Because of the rarity of this newly recognized subgroup, our knowledge is limited to individual case series and registry data.4-13 However, most of these individual reports did not include critical genomic data, and the definition of t-ALL has varied; these have created a debate over the existence of a distinct t-ALL entity.
The diagnosis of t-ALL requires a history of cytotoxic therapy, and it should be distinguished from acute lymphoblastic leukemia with prior malignancy (pm-ALL), because the latter represents patients who did not receive genotoxic therapy for their prior malignancy. The term “secondary acute lymphoblastic leukemia” is an ambiguous one, because the name might suggest the development of acute lymphoblastic leukemia (ALL) from a precursor lymphoid neoplasm. Although some reports use this as a general term to denote t-ALL and pm-ALL cases,6,11 it may be confused with a pathogenesis similar to the origin of secondary AML from MDS. Therefore, we applied strict inclusion criteria to distinguish patients with t-ALL and pm-ALL, while avoiding the designation of secondary ALL.
The frequency of t-ALL is reported to be 3% to 9% of all adult ALL cases.4,8 A recent single institution analysis comparing de novo ALL (dn-ALL) with t-ALL demonstrated that t-ALL patients exhibited higher rates of poor-risk cytogenetic features (eg, MLL rearrangement) and inferior overall survival (OS) compared with patients with dn-ALL.8 Data from few registry studies of “secondary” ALL demonstrated inferior outcomes with this entity as well, but no distinction between t-ALL and pm-ALL was made.6,9-11 One study comparing these individual disease subgroups could not identify significant clinical or survival differences between them and concluded that prior therapy may not have an impact on the pathogenesis of this disease.5 However, this study was limited by the very small number of patients in each category and could not identify an impact of genotoxic therapies.
We report a retrospective multi-institutional study of patients with t-ALL, dn-ALL, and pm-ALL, defined by strict inclusion criteria, to investigate the impact of prior cytotoxic therapies on clinical outcomes of ALL patients. We hypothesize that these groups are separate entities with distinct biologic characteristics and clinical outcomes that may require different treatment approaches.
Methods
Study eligibility
We retrospectively evaluated 1785 consecutive cases of newly diagnosed adult t-ALL, dn-ALL, and pm-ALL that were treated between 2000 and 2017 at 5 academic centers: Cleveland Clinic, University of Washington Medical Center, Stanford Comprehensive Cancer Center, University of Chicago, and Memorial Sloan Kettering Cancer Center. We also included patients who were treated for relapsed ALL between these dates, for whom the initial diagnosis may have been before 2000. Patients with mixed lineage leukemia and chronic myeloid leukemia in blast crisis were excluded. We defined t-ALL as ALL occurring after exposure to genotoxic therapy (ie, chemotherapy and/or radiation); cases of ALL preceded by a malignancy, but without exposure to these therapies, were classified as pm-ALL. Patients who did not have prior exposure to genotoxic therapy or a history of malignancy were classified as dn-ALL. We sampled 100 dn-ALL patients from the different institutions that participated in this study to have a control group to compare with t-ALL. Some of these institutions did not have well-annotated databases to enable a comprehensive analysis of all 1785 patients; therefore, we implemented a randomization protocol to enroll every tenth dn-ALL patient and subsequently collected specific data by looking at individual patient charts. Initial diagnosis of ALL was established by documenting ≥20% marrow lymphoblasts, whereas relapse was defined as the recurrence of ≥5% blasts in a bone marrow aspirate or new extramedullary involvement. The Institutional Review Board of each participating center approved the study.
Treatment and response definitions
The first-line treatment at initial ALL diagnosis was determined by institutional preferences, immunophenotype, and eligibility for clinical trials. The most commonly used regimens were hyper-CVAD (hyperfractionated cyclophosphamide, vincristine, doxorubicin, and dexamethasone) and BFM (Berlin-Frankfurt-Munster)–based regimens (eg, Larson, Stock, L20). High-risk patients and those with BCR-ABL rearrangement were generally considered candidates for hematopoietic cell transplantation (HCT) at the time of first complete remission (CR), but these decisions were also left to the discretion of the treating physician.
CR was defined as <5% bone marrow blasts, no circulating blasts or extramedullary disease, peripheral blood neutrophil counts > 1 × 10⁹/L, and platelet counts > 100 × 109/L.14 A complete response with incomplete count recovery (CRi) was defined as a response meeting the criteria for CR in the absence of neutrophil and/or platelet count recovery.
Minimal residual disease (MRD) data were available for a small subset of patients and assessed by ≥8-color multiparameter flow cytometry (MFC) on remission bone marrow specimens at the time of CR/CRi. MRD was defined as a neoplastic blast population with an abnormal immunophenotype deviating from normal lymphoid precursors in the setting of CR.15 The sensitivity of the MFC platform was 0.01% to 0.001%, depending on the background populations. Any level of abnormal blast population detected by MFC was considered MRD positive.
Sample processing, DNA sequencing, and mutation analysis
In a subset of patients who had available diagnostic samples, DNA was extracted from bone marrow or peripheral blood mononuclear cells. Cleveland Clinic patient samples were sequenced with libraries prepared using Illumina’s Nextera Rapid Capture Custom Enrichment Kit and subjected to massive parallel sequencing using a MiSeq 2000, as described previously.16 The panel consisted of 169 genes highly prevalent in hematologic cancers or associated with congenital blood disorders. For germline confirmation, mutations were analyzed in nonclonal CD3+ T cells whenever DNA was available. Variants with variant allelic frequency of 5% were prioritized for further processing and annotation. Generated VCF files were used as an input for ANNOVAR and were annotated with multiple databases (dbSNP138, COSMIC, ExAC). Variant allelic frequencies of mutations were adjusted according to the zygosity and copy number confirmed by single nucleotide polymorphism array. Samples from 6 patients at Memorial Sloan Kettering Cancer Center were sequenced with an Illumina MiSeq v.2 instrument after extracted DNA and primers were merged using a RainDance ThunderStorm instrument to form droplets for emulsion polymerase chain reaction amplification and library preparation, as described previously.17
Statistical analysis
Statistical analyses were performed using JMP software v.12.0.0 (SAS Inc., Cary, NC). Data are presented with percentage proportions for categorical variables and medians for continuous variables. The χ2 test and Fisher’s exact test were used to compare categorical variables. Cox regression analysis was used for univariable and multivariable analysis to identify the impact of potential factors on survival outcomes after the diagnosis of ALL. Survival estimates were calculated using the Kaplan-Meier method, and differences between curves were assessed using the log-rank test. OS was calculated as the time from ALL diagnosis until death or the last follow-up. Patients who were alive were censored at the last follow-up date. Relapse-free survival (RFS) was calculated from the time of CR/CRi until the time of relapse, death, or the last follow-up. For all analyses, P ≤ .05 was considered statistically significant.
Results
Clinical and molecular characteristics of patients with t-ALL, dn-ALL, or pm-ALL
Baseline characteristics of 116 t-ALL, 100 dn-ALL, and 20 pm-ALL patients are summarized in Table 1. The frequency of t-ALL was 6.5% of all ALL cases. The frequency of females was lower in the dn-ALL group compared with the t-ALL and pm-ALL groups (35%, 52%, and 55%, respectively; P = .03). Patients with dn-ALL were younger than t-ALL and pm-ALL patients (median age, 41.5, 61, and 66 years, respectively; P < .001). Compared with patients with pm-ALL, t-ALL patients had a significantly shorter interval between the first malignancy and ALL diagnosis (median, 8 vs 5 years; P = .04). There were no significant differences for race, type of first malignancy, leukemia phenotype (precursor B cell vs T cell), pretreatment white blood cell (WBC) count, peripheral blast percentage, bone marrow blast percentage, and frequency of extramedullary disease. However, t-ALL patients had different cytogenetic profiles compared with dn-ALL and pm-ALL patients (P < .001). The frequency of KMT2A (also known as MLL) gene rearrangement was 13% (14/104) in the t-ALL group and 8% (8/100) in dn-ALL group, but no MLL gene rearrangement was observed in patients with pm-ALL. In addition, 27% (28/104) of t-ALL patients exhibited cytogenetic abnormalities commonly associated with MDS (eg, deletions of chromosomes 5, 7, 11, 13, 17, and 20 and trisomy 8), whereas MDS-like karyotype was noted in 7% (7/100) of dn-ALL patients and was not observed in the pm-ALL group (P < .001). The incidences of normal karyotype and BCR-ABL rearrangement were not significantly different among the groups. Of note, these 5 cytogenetic subgroups outlined in Table 1 were mutually exclusive.
Clinical characteristics of patients with newly diagnosed t-ALL, dn-ALL, or pm-ALL
| t-ALL (n = 116) | dn-ALL (n = 100) | pm-ALL (n = 20) | P | |
|---|---|---|---|---|
| Females | 60 (51.7) | 35 (35) | 11 (55) | .03 |
| Race | .81 | |||
| White | 88 (85) | 85 (85) | 19 (95) | |
| African American | 8 (7) | 10 (10) | 1 (5) | |
| Hispanic | 4 (4) | 5 (5) | 0 | |
| Asian | 4 (4) | 0 | 0 | |
| Age at ALL, median (range), y | 61 (21-90) | 41.5 (18-79) | 66 (32-93) | <.001 |
| Interdiagnoses interval, median (range), y | 5 (0.5-35) | n/a | 8 (1-32) | .04 |
| First malignancy | n/a | .07 | ||
| Solid | 72 (62.1) | 17 (85) | ||
| Hematological | 44 (37.9) | 3 (15) | ||
| B-ALL | 107 (92) | 86 (86) | 18 (90) | .33 |
| WBC count, median (range), × 109/L | 5.67 (0.3-353.4) | 6.69 (0.3-366) | 4 (1-124.3) | .98 |
| Peripheral blasts, median (range), % | 23 (0-98) | 23 (0-96) | 23.1 (0-91) | .99 |
| Bone marrow blasts, median (range), % | 81.5 (0-99) | 87 (1-98) | 80 (0-98) | .26 |
| Extramedullary disease | 22 (19) | 21 (21) | 3 (20) | .94 |
| Cytogenetics | <.001 | |||
| Normal | 27 (26) | 32 (32) | 3 (11) | .33 |
| BCR-ABL | 26 (25) | 30 (30) | 7 (39) | .42 |
| MLLr | 14 (13) | 8 (8) | 0 | .34 |
| MDS-like* | 28 (27) | 7 (7) | 0 | <.001 |
| Other | 9 (9) | 23 (23) | 8 (44) | <.001 |
| First-line treatment | .08 | |||
| BFM based | 48 (41.4) | 47 (47) | 9 (45) | |
| Hyper-CVAD | 35 (30.2) | 43 (43) | 6 (30) | |
| Vincristine with or without prednisone | 9 (7.8) | 1 (1) | 3 (15) | |
| Other chemotherapy | 17 (14.6) | 9 (9) | 2 (10) | |
| No treatment | 4 (3.4) | 0 | 0 | |
| Unknown | 3 (2.6) | 0 | 0 | |
| Response to induction | .92 | |||
| CR | 81 (82) | 83 (83) | 14 (87.5) | |
| CRi | 5 (5) | 6 (6) | 0 | |
| Refractory | 13 (13) | 11 (11) | 2 (12.5) | |
| MRD status at response | .34 | |||
| Positive | 24 (51) | 10 (34) | 3 (37.5) | |
| Negative | 23 (49) | 19 (66) | 5 (62.5) | |
| Performance of HCT, n | 42 | 50 | 7 | .09 |
| In CR1 | 35 (30.2) | 42 (42) | 6 (30) | |
| In CR2 | 7 (6) | 8 (8) | 1 (5) | |
| Donor source, n | .29 | |||
| MUD | 18 | 28 | 3 | |
| MSD | 12 | 14 | 2 | |
| UCB | 5 | 0 | 1 | |
| Haploidentical | 2 | 7 | 0 | |
| Autologous | 0 | 1 | 1 | |
| Conditioning regimen | .34 | |||
| Myeloablative | 25 (78) | 36 (75) | 3 (50) | |
| Reduced intensity | 7 (22) | 12 (25) | 3 (50) |
Unless otherwise indicated, data are n (%).
B-ALL, B-cell ALL; MSD, matched sibling donor; MUD, matched unrelated donor; n/a, not applicable; UCB, umbilical cord blood transplant.
MDS-like cytogenetic abnormalities included deletions of chromosomes 5, 7, 11, 13, 17, and 20, as well as trisomy 8.
Prior diagnoses and therapies for t-ALL and pm-ALL patients are summarized in Table 2. The most common malignancies in t-ALL patients were breast cancer (26%), multiple myeloma (19%), prostate cancer (13%), and non-Hodgkin lymphoma (11%). Seven patients had a history of >1 previous malignancy. Of note, despite the high incidence of MDS-like karyotype in the t-ALL cohort, none of these patients had a history of MDS. Sixty-three percent of patients received alkylating agents, 33% received topoisomerase II inhibitors, and 30% received both of these agents. We investigated the impact of prior therapies on the latency to develop t-ALL (Table 3). Patients who received topoisomerase II inhibitors had a shorter latency (median, 4.7 years; range, 0.5-16) compared with patients who did not receive these agents (median, 6.3 years; range, 1-35) (hazard ratio [HR], 1.75, 95% confidence interval [CI], 1.05-2.65, P = .01). Furthermore, the interval between prior treatment and the development of ALL was significantly shorter for patients who harbored MLLr (median, 2 years; range, 1-6) compared with patients without MLLr (median, 6.83 years; range, 1-35) (P < .001). The type of previous malignancy (hematologic vs solid), other genotoxic therapies, and immunophenotype (B-ALL vs T-ALL) did not have a significant impact on the latency period.
Prior diagnoses and therapies for patients with t-ALL or pm-ALL
| Characteristics | t-ALL | pm-ALL |
|---|---|---|
| Type of prior malignancy | ||
| Breast cancer | 31 (26) | 6 (30) |
| Multiple myeloma | 22 (19) | 1 (5) |
| Prostate cancer | 15 (13) | 4 (20) |
| Non-Hodgkin lymphoma | 13 (11) | 0 (0) |
| Hodgkin lymphoma | 6 (5) | 0 (0) |
| Thyroid cancer | 5 (4) | 0 (0) |
| Colorectal carcinoma | 4 (3.4) | 0 (0) |
| Cervical cancer | 4 (3.4) | 1 (5) |
| Lung cancer | 3 (2.6) | 1 (5) |
| Testicular cancer | 3 (2.6) | 0 (0) |
| Sarcoma | 2 (1.7) | 0 (0) |
| Chronic lymphocytic leukemia | 2 (1.7) | 1 (5) |
| Head and neck cancer | 2 (1.7) | 1 (5) |
| Bladder cancer | 2 (1.7) | 0 (0) |
| Langerhans cell histiocytosis | 1 (0.8) | 0 (0) |
| Anal carcinoma | 1 (0.8) | 0 (0) |
| Brain cancer | 1 (0.8) | 0 (0) |
| Ovarian cancer | 1 (0.8) | 0 (0) |
| Hepatocellular carcinoma | 1 (0.8) | 0 (0) |
| Melanoma | 0 (0) | 5 (25) |
| More than 1 previous malignancy | 7 (6) | 3 (15) |
| Type of prior therapy | n/a | |
| Alkylating agents | 71 (62.3) | |
| Topoisomerase II inhibitors | 37 (32.4) | |
| Alkylating agent + topoisomerase II inhibitor | 34 (29.8) | |
| Other chemotherapy | 11 (9.6) | |
| Radiotherapy | 64 (56.1) | |
| Chemoradiotherapy | 40 (35.1) |
All data are n (%).
Predictors of latency among patients with t-ALL
| No. of patients | HR (95% CI) | P | |
|---|---|---|---|
| Prior malignancy | 1.21 (0.76-1.95) | .40 | |
| Hematologic | 44 | ||
| Solid | 72 | ||
| Topoisomerase II inhibitors | .01 | ||
| Yes | 37 | 1.75 (1.05-2.65) | |
| No | 78 | — | |
| Radiotherapy | .30 | ||
| Yes | 64 | 1.25 (0.82-1.92) | |
| No | 51 | — | |
| Immunophenotype | .48 | ||
| B-ALL | 107 | 1.31 (0.61-2.77) | |
| T-ALL | 9 | — | |
| Cytogenetics | 26 | ||
| BCR-ABL | 0.65 (0.40-1.05) | .08 | |
| MLLr | 14 | 4.34 (2.05-9.21) | <.001 |
| MDS-like* | 28 | 1.43 (0.79-2.60) | .23 |
| Other | 9 | 1.29 (0.62-2.68) | .48 |
| Normal | 27 | — |
—, the reference group for HR calculation; T-ALL, T-cell ALL.
MDS-like cytogenetic abnormalities included deletions of chromosomes 5, 7, 11, 13, 17, and 20, as well as trisomy 8.
We further investigated the association between prior therapies and cytogenetics of t-ALL. Among patients who received topoisomerase II inhibitors, 30% had MLLr, whereas the frequency of t-ALL with MLLr was 3% in patients who did not receive these agents (P < .001). Interestingly, all 4 patients who had a history of radioactive iodine ablation (RAI) for thyroid cancer developed t-ALL with BCR-ABL rearrangement.
Twenty patients with t-ALL and 3 patients with pm-ALL had pretreatment bone marrow samples available for sequencing. In the t-ALL group, 7 patients had mutations that were more commonly found in myeloid malignancies, including DNMT3A (n = 2), IDH2 (n = 1), RUNX1 (n = 1), ASXL1 (n = 1), WT1 (n = 1), PHF6 (n = 1), NRAS (n = 1), CUX1 (n = 1), and PRPF8 (n = 1). Two t-ALL patients harbored mutations involving the Fanconi anemia DNA repair genes, FANCL and FANCD2, which were comutated with KDM6B in both cases. In addition, 2 patients with t-ALL had BRCA2 mutations, 2 patients had a single TP53 mutation, and 1 patient had CDKN2A and IKZF1 mutations. Two patients in the t-ALL cohort and 1 patient in the pm-ALL cohort did not have any mutations for the 170 genes sequenced with our panel. Two other pm-ALL patients had single NBN and JAK2 mutations.
Comparison of outcomes of t-ALL, dn-ALL, and pm-ALL
The most common first-line therapies for all ALL groups were BFM-based regimens and hyper-CVAD (Table 1). The rates of response to first-line treatment were similar between groups, with a CR/CRi rate of 87% to 89%, whereas 11% to 13% of patients were refractory (P = .92). Among t-ALL patients, the frequency of refractory disease was higher in patients with a history of radiotherapy (20% vs 3%; P = .01). There were no other significant associations between pretreatment characteristics and achievement of CR. In 47 t-ALL, 29 dn-ALL, and 8 pm-ALL patients with available MRD data, the rate of MRD-negative response was lower in the t-ALL group compared with dn-ALL and pm-ALL patients, but the difference did not reach statistical significance (49% vs 66% vs 62.5%; P = .34). No differences were observed for the number of patients who underwent HCT, donor source, and type of conditioning regimen.
The median follow-ups for t-ALL, dn-ALL, and pm-ALL patients were 12 months (range, 0.2-96), 46 months (range, 1-372), and 14.5 months (range, 1-129), respectively. Patients with t-ALL had significantly shorter OS compared with dn-ALL patients (median, 27 months vs not reached, P < .001) and pm-ALL patients (median, 27 months vs not reached; P = .041) (Figure 1A). Among patients who achieved CR/CRi, median RFS was 18 months in t-ALL patients compared with 294 months in dn-ALL patients (P < .001) and 79 months in pm-ALL patients (P = .054) (Figure 1B). Given the high number of patients who underwent HCT in the dn-ALL group, we also performed survival analysis by censoring the survival time at the time of HCT. After the adjustment for performance of HCT, patients with t-ALL still had inferior OS (23 months vs not reached in other groups; P < .001) and RFS (20 months vs 294 months vs not reached; P = .001) compared with patients with dn-ALL and pm-ALL (supplemental Figure 1).
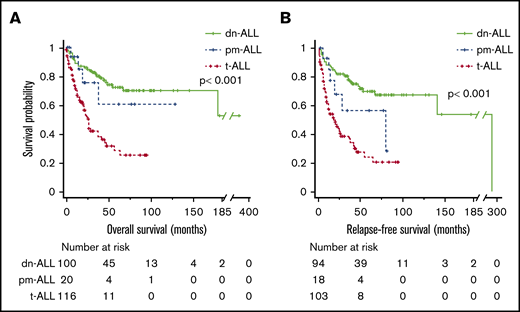
Survival outcomes of patients with ALL. Kaplan-Meier OS (A) and RFS (B) curves comparing patients who had t-ALL, dn-ALL, or pm-ALL.
Survival outcomes of patients with ALL. Kaplan-Meier OS (A) and RFS (B) curves comparing patients who had t-ALL, dn-ALL, or pm-ALL.
Prognostic predictors in patients with t-ALL
Based on our observation that t-ALL is a clinically and genetically distinct entity with inferior outcomes, we further investigated predictors of outcome in this cohort (Table 4). In univariable analysis for OS, male sex (HR, 1.98; 95% CI, 1.16-3.22; P = .01), exposure to topoisomerase II inhibitors (HR, 2.68; 95% CI, 1.01-7.14; P = .04), and radiotherapy (HR, 8.25; 95% CI, 1.06-64.07; P = .04) were associated with poor survival, whereas achievement of CR/CRi after first-line therapy (HR, 0.12; 95% CI, 0.04-0.36; P = .001) and undergoing HCT (HR, 0.49; 95% CI, 0.28-0.87; P = .01) were associated with better OS. Similarly, RFS after achievement of CR/CRi was significantly shorter for male patients (HR, 1.80; 95% CI, 1.08-3.01; P = .02), and patients who underwent HCT had significantly better RFS than patients who did not undergo HCT (HR, 0.25; 95% CI, 0.07-0.86; P = .02). Finally, multivariable analysis of OS demonstrated that performance of HCT is the only independent predictor of outcome in this cohort (HR, 0.41; 95% CI, 0.20-0.82; P = .01) (Table 5).
Univariable analysis of prognostic predictors in t-ALL
| OS | RFS | |||||
|---|---|---|---|---|---|---|
| No. of patients | HR (95% CI) | P | No. of patients | HR (95% CI) | P | |
| Age at ALL diagnosis | 116 | 1.007 (0.98-1.02) | .48 | 103 | 1.003 (0.98-1.02) | .80 |
| Sex | .01 | .02 | ||||
| Male | 56 | 1.98 (1.16-3.22) | 56 | 1.80 (1.08-3.01) | ||
| Female | 60 | — | 47 | — | ||
| Prior malignancy | .20 | .42 | ||||
| Hematologic | 44 | 1.41 (0.82-2.41) | 39 | 1.24 (0.73-2.11) | ||
| Solid | 72 | — | 64 | — | ||
| Alkylating agents | .17 | .34 | ||||
| Yes | 71 | 2.67 (0.63-11.18) | 66 | 1.31 (0.74-2.32) | ||
| No | 43 | — | 36 | — | ||
| Topoisomerase II inhibitors | .04 | .56 | ||||
| Yes | 37 | 2.68 (1.01-7.14) | 33 | 1.16 (0.68-1.98) | ||
| No | 78 | — | 70 | — | ||
| Radiotherapy | 8.25 (1.06-64.07) | .04 | .70 | |||
| Yes | 64 | 55 | 1.10 (0.66-1.85) | |||
| No | 51 | 48 | — | |||
| Interdiagnoses interval | 116 | 1.04 (0.98-1.09) | .28 | 103 | 1.03 (0.97-1.08) | .35 |
| Immunophenotype | .33 | .80 | ||||
| B-ALL | 107 | 0.63 (0.25-1.59) | 96 | 0.86 (0.26-2.79) | ||
| T-ALL | 9 | — | 7 | — | ||
| Cytogenetics | .81 | .85 | ||||
| Normal | 27 | 0.96 (0.71-1.29) | 25 | 0.98 (0.72-1.31) | ||
| Abnormal | 79 | — | 70 | — | ||
| MLLr | .26 | .16 | ||||
| Yes | 14 | 2.14 (0.57-8.33) | 14 | 1.62 (0.72-7.14) | ||
| No | 90 | — | 79 | — | ||
| BCR-ABL | .79 | .49 | ||||
| Yes | 26 | 0.92 (0.48-1.74) | 22 | 0.66 (0.21-2.10) | ||
| No | 78 | — | 71 | — | ||
| MDS-like aberrations* | .44 | .75 | ||||
| Yes | 32 | 0.61 (0.17-2.14) | 26 | 0.75 (0.24-2.29) | ||
| No | 72 | — | 67 | — | ||
| WBC count | 110 | 1.001 (0.99-1.01) | .55 | 97 | 1.001 (0.99-1.01) | .59 |
| Percentage of peripheral blasts | 107 | 1.001 (0.99-1.01) | .85 | 94 | 1.001 (0.98-1.02) | .77 |
| Percentage of bone marrow blasts | 100 | 1.008 (0.99-1.02) | .10 | 90 | 1.007 (0.99-1.02) | .16 |
| Extramedullary disease | .08 | .63 | ||||
| Yes | 22 | 6.4 (0.79-51.8) | 19 | 1.17 (0.60-2.27) | ||
| No | 93 | — | 84 | — | ||
| Response to first induction | .001 | .01 | ||||
| CR/Cri | 86 | 0.12 (0.04-0.36) | 86 | 0.21 (0.06-0.76) | ||
| Refractory | 13 | — | 9 | — | ||
| MRD status at response | .37 | .18 | ||||
| Positive | 24 | 1.47 (0.62-3.44) | 20 | 1.75 (0.76-4.04) | ||
| Negative | 23 | — | 23 | — | ||
| Performance of HCT | .01 | .02 | ||||
| Yes | 42 | 0.49 (0.28-0.87) | 42 | 0.25 (0.07-0.86) | ||
| No | 69 | — | 57 | |||
| Conditioning regimen | .46 | .88 | ||||
| Myeloablative | 25 | 0.68 (0.23-1.93) | 25 | 0.92 (0.33-2.53) | ||
| Reduced intensity | 7 | — | 7 | — | ||
MDS-like cytogenetic abnormalities included deletions of chromosomes 5, 7, 11, 13, 17, and 20, as well as trisomy 8.
Multivariable analysis of factors predicting OS in t-ALL
| HR (95% CI) | P | |
|---|---|---|
| Sex (male vs female) | 1.72 (0.95-3.12) | .07 |
| Topoisomerase II inhibitors (yes vs no) | 2 (0.97-4) | .06 |
| Radiotherapy (yes vs no) | 1.03 (0.55-2) | .92 |
| Response to first induction (CR/CRi vs refractory) | 1.72 (0.74-4.01) | .20 |
| Performance of HCT (yes vs no) | 0.41 (0.20-0.82) | .01 |
Although age at diagnosis was not a significant predictor of survival in the t-ALL group, advanced age predicted poor OS (HR, 1.04; 95% CI, 1.01-1.06; P = .003) in the dn-ALL group. We hypothesized that this discrepancy is likely due to the universally poor prognosis associated with t-ALL. Therefore, we compared outcomes of t-ALL and dn-ALL patients stratified based on age as young (<40 years) vs old (≥40 years) (supplemental Figure 2). There was no significant difference in OS or RFS between old vs young t-ALL patients, whereas young dn-ALL patients had better OS compared with older dn-ALL patients (P = .03). Among patients younger than 40 years of age, t-ALL patients had significantly worse OS and RFS compared with dn-ALL patients (P < .001).
Outcomes of patients with t-ALL or pm-ALL based on performance of HCT
Because HCT was the only independent predictor of longer survival in t-ALL patients, we performed a comparative analysis of survival outcomes in t-ALL and dn-ALL patients based on HCT status. In line with previous observations, t-ALL patients who received HCT had significantly better median OS compared with t-ALL patients who did not undergo HCT (46 vs 21 months; P = .004) (Figure 2). There was no significant difference in OS between t-ALL and dn-ALL patients who had HCT (median, 46 months vs not reached; P = .13); however, the survival of transplanted t-ALL patients remained inferior to dn-ALL patients who underwent HCT.
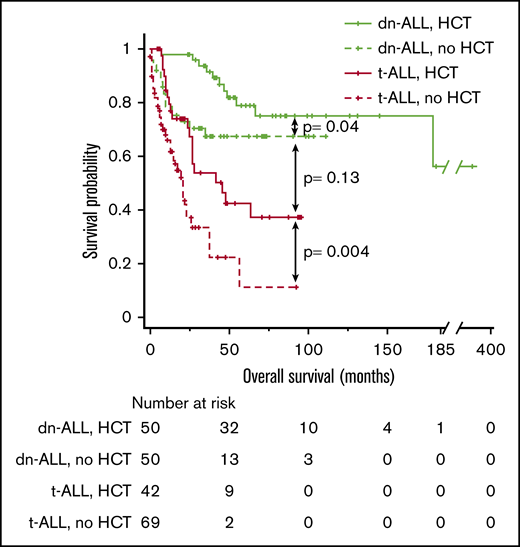
Kaplan-Meier OS curve comparing the outcomes of patients who had t-ALL or dn-ALL stratified based on the performance of HCT.
Kaplan-Meier OS curve comparing the outcomes of patients who had t-ALL or dn-ALL stratified based on the performance of HCT.
Discussion
Very little is known about the clinical features and pathogenesis of t-ALL. The discrepancies in its description across different studies and the rarity of this entity have been major limitations for analysis. We present a large retrospective study of t-ALL patients treated in 5 academic centers and compared their outcomes with dn-ALL patients and pm-ALL patients who had a history of prior malignancy that was not treated with genotoxic therapies. By comparing t-ALL cases with pm-ALL cases, we aimed to isolate the effect of genotoxic therapy on leukemia and hypothesized that this comparison might be useful to investigate this effect while controlling for possible cancer susceptibility in these individuals who had >1 malignancy in their lifetime. We have shown that t-ALL has a higher frequency of poor-risk cytogenetic features, including MLLr and MDS-like abnormalities (eg, monosomal karyotype), compared with dn-ALL and pm-ALL patients. These t-ALL patients have inferior survival outcomes compared with dn-ALL patients, which may be improved by HCT in eligible patients.
The latency period for t-ALL was significantly shorter in patients with history of exposure to topoisomerase II inhibitors, which is similar to what has been observed for therapy-related AML (t-AML).2 We have also shown that patients who received these agents had a higher incidence of t-ALL with MLLr. MLLr and MDS-like karyotypic features were more commonly seen in t-ALL patients, which supports the etiologic role of prior chemoradiotherapy in the pathogenesis of t-ALL, in a similar manner to t-AML. On the contrary, the frequency of Philadelphia (Ph) chromosome–positive cases were not significantly different between the t-ALL and pm-ALL cohorts. An interesting observation in this study was that all t-ALL cases developing after RAI therapy harbored BCR-ABL rearrangement. This was also reported in small case series of t-ALL in the literature.5,6 Furthermore, a recent population-based cohort study identified a 3.4-fold higher risk for developing chronic myeloid leukemia and a 1.8-fold higher risk for developing AML after RAI treatment.18 Therefore, Ph+ ALL cases observed in our cohort might represent patients presenting with lymphoid blast crisis in the setting of a previously undiagnosed chronic myeloid leukemia. Altogether, the data suggest a possible link between RAI and Ph+ hematologic cancers.
To gain further insights into the biology of t-ALL, we studied genes that are commonly mutated in hematologic cancers and congenital blood disorders. To our knowledge, a comprehensive sequencing analysis has not previously been performed for t-ALL; however, we were limited by sample availability because only 20 t-ALL patients and 3 pm-ALL patients had pretreatment bone marrow samples available for experiments. We observed various mutations among t-ALL patients, with the majority of patients exhibiting mutations that were more common with myeloid malignancies (eg, DNMT3A, RUNX1, ASXL1), whereas others had ALL-type mutations (eg, CDKN2A and IKZF1) or mutations involving congenital Fanconi anemia genes (eg, FANCL and FANCD2) and other cancer-susceptibility genes (eg, BRCA2). The myeloid mutations observed in ALL patients might indicate ALL development in the setting of clonal hematopoiesis, whereby existing premalignant clones have demonstrated a lymphoid bias. It was previously reported that TP53 mutations in the setting of t-AML may originate from preexisting stem cell clones that are resistant to chemotherapy and can preferentially expand after treatment.19 At this stage, our data are observational from a small cohort of patients, and further studies investigating the role of these genes in t-ALL biology are needed. Of note, a recent study of 13 t-ALL cases by Aldoss and colleagues reported that t-ALL arising after multiple myeloma is clonally unrelated to the original malignancy.20 Collectively, the data suggest that different pathogenic mechanisms exist for the development of t-ALL, which may be driven by inherited cancer-susceptibility genes in a small subset of patients, whereas other patients develop the disease de novo as a result of genotoxic effects of prior therapies.
Our data also indicate that t-ALL is associated with an unfavorable prognosis independent of age at diagnosis. This was previously reported in a large cohort of t-AML patients, among whom age had no impact on OS.21 Despite the poor prognosis associated with t-ALL, it has been suggested that HCT may improve outcomes in this patient cohort.8,12 Our findings supported previous observations and demonstrated that t-ALL patients who were eligible for HCT had better long-term survival; however, HCT did not eliminate the negative survival impact of prior genotoxic therapies, because the outcomes of transplanted dn-ALL patients was still superior to transplanted t-ALL patients. The efficacy of novel immunotherapies (eg, blinatumomab, inotuzumab ozogamicin) in this patient population would be of particular interest because these agents may have promising and agnostic antileukemic effects independent of poor molecular features.
Certain demographic differences between t-ALL and dn-ALL are of interest. The median age of patients with t-ALL was higher than for dn-ALL, which is expected, given the latency period for t-ALL after genotoxic therapy for prior malignancy. The sex ratios of the cohorts were significantly different as well: 65% of dn-ALL patients were male, and this is similar to what has been reported in adult ALL series.22 Only 40% of patients were male in the t-ALL cohort, which is likely due to the higher frequency of female patients with a history of breast cancer treated with genotoxic therapies; however, this may also represent a higher predisposition among female patients to develop t-ALL. Prior studies looking at factors predisposing to the development of t-AML reported polymorphisms of genes involved in DNA repair and drug metabolism, which may contribute to sex differences.23,24 Our study is not designed to answer this question, and future studies comparing sex-matched patients who did and did not develop ALL after genotoxic therapy may identify risk factors for the development of t-ALL.
Finally, we observed similar clinical and biological characteristics in our t-ALL cohort and t-AML cases reported in the literature. Similar to t-AML, median time to ALL diagnosis after genotoxic therapy was 5 years (or shorter with topoisomerase II inhibitor therapy).2,25 Notably, the percentage of females was higher in the t-ALL group compared with the dn-ALL group in this study, and a similar phenomenon was reported in t-AML cases compared with dn-AML cases.2,25 Patients with t-AML and t-ALL are older at leukemia diagnosis compared with their counterparts with de novo disease, but age alone may not have a significant impact on OS in therapy-related leukemias; this is likely due to the very poor prognosis associated with this entity.
There are potential limitations in our study, primarily related to its retrospective nature. First, we collected data from patients diagnosed over a 17-year period, which creates a bias toward changing therapies for ALL and first malignancy. The referral bias to major academic institutions may overestimate t-ALL frequency. The missing sequencing data and pretreatment samples in the majority of the patients prevented us from making an extensive characterization and categorization of t-ALL patients based on their mutational composition. For the same reason, we could not assess BCR-ABL–like phenotype in patients. Similarly, MRD data were available for only a small subset of patients, and the absence of an outcome difference based on MRD status may be due to a lack of statistical power. Finally, comparisons of HCT should be treated with caution, because no statistical method can adjust for the unmeasured selection factors involved in a retrospective analysis.
Collectively, our results support the recognition of t-ALL as a distinct entity based on its biologic and clinical features. These patients carry cytogenetic abnormalities similar to therapy-related myeloid neoplasms and demonstrate a variable mutational spectrum, with a subset of cases enriched in mutations commonly seen in myeloid malignancies, whereas others harbored mutations in DNA repair genes (eg, Fanconi anemia core complex) and inherited cancer-susceptibility genes. Larger molecular studies utilizing next-generation sequencing may further characterize distinct pathogenic mechanisms of t-ALL development. Although survival of t-ALL patients is inferior to dn-ALL and pm-ALL cases, performance of HCT in eligible patients may improve outcomes.
Authorship
Contribution: C.S. conceptualized the original study, conducted formal analysis, wrote the original draft and edited the manuscript; A.K., R.D.C., N.R., I.Y., M.L., W.S., R.A.L., R.L.L., M.S.T., J.H.P., C.K., B.P., M.A.S., M.E.K., H.E.C., B.K.H., R.S., A.G., S.M., A.N., and J.P.M. conceptualized and supervised the study, and edited the manuscript; and A.S.A. conceptualized the study, validated the results, supervised the study, and wrote and edited the manuscript.
Conflict-of-interest disclosures: The authors declare no competing financial interests.
Correspondence: Anjali S. Advani, Department of Hematology and Oncology, Cleveland Clinic, 10201 Carnegie Ave, Desk CA60, Cleveland, OH 44195; e-mail: advania@ccf.org.

