

Key Points
Amplification of 1q21 correlates with increased sensitivity to MCL-1 inhibitor S63845 in primary MM cells.
Poor-prognosis MM is particularly sensitive to MCL-1 inhibition, partially independent of 1q21 amplification status.

Abstract
Prosurvival BCL-2 family proteins are potent inhibitors of apoptosis and often overexpressed in lymphoid malignancies. In multiple myeloma (MM), MCL-1 expression contributes to survival of malignant plasma cells, and overexpression correlates with poor prognosis. In this study, we investigated whether sensitivity to the novel MCL-1 inhibitor S63845 could be predicted using cytogenetics, focusing on amplification of 1q21, the chromosomal region that contains the MCL1 locus. In addition, we studied the relation of MCL-1 inhibitor sensitivity with other diagnostic characteristics and BCL-2 family protein expression. In 31 human myeloma cell lines and in bone marrow aspirates from 47 newly diagnosed MM patients, we measured the effect of S63845 alone, or combined with BCL-2 inhibitor ABT-199 (venetoclax), and BCL-XL inhibitor A-1155463 or A-1331852 on cell viability. We demonstrated for the first time that MM cells from patients with 1q21 amplification are significantly more sensitive to inhibition of MCL-1. We suggest that this increased sensitivity results from high relative MCL1 expression resulting from amplification of 1q21. Additionally, and partially independent from 1q21 status, high serum β2 microglobulin level and presence of renal insufficiency correlated with increased sensitivity to MCL-1 inhibitor treatment. Combining S63845 with other BH3 mimetics synergistically enhanced apoptosis compared with single inhibitors, and sensitivity to inhibitor combinations was found in a large proportion of MM insensitive to MCL-1 inhibition alone. Collectively, our data indicate that amplification of 1q21 identifies an MM subset highly sensitive to MCL-1 inhibitor treatment and can be used as a predictive marker to guide selection of therapy.
Introduction
Despite recent advances in treatment, multiple myeloma (MM) is considered incurable, with most patients relapsing and eventually becoming refractory to therapy.1 Treatment regimens generally consist of triple-drug combinations including a proteasome inhibitor, dexamethasone, and an immunomodulatory drug or chemotherapeutic agent with or without autologous stem cell transplantation.2,3 At relapse, patients receive next-generation proteasome inhibitors and immunomodulatory drugs, and recently, anti-CD38 monoclonal antibody daratumumab was approved for use in relapsed and/or refractory MM.4 Several novel therapies for MM with different mechanisms of action are currently being studied, including BCL-2 homology domain 3 (BH3) mimetics.1,5
BH3 mimetics overcome apoptosis resistance by binding and inhibiting select prosurvival BCL-2 family proteins.6,7 BCL-2 family proteins are key mediators of the intrinsic apoptosis pathway. Whether a cell undergoes apoptosis is determined by the availability of both prosurvival (eg, BCL-2, MCL-1, BCL-XL) and proapoptotic proteins (eg, BAX, BAK, BIM, PUMA, BID, NOXA). In MM, overexpression of MCL-1 leads to apoptosis resistance and is associated with shorter patient survival.8 In addition to MCL-1, overexpression of BCL-2 and/or BCL-XL has also been observed in MM, suggesting that these 3 prosurvival proteins are promising targets for therapy.9,10 ABT-199 (venetoclax) is the first BCL-2–specific BH3 mimetic approved by the US Food and Drug Administration for use in chronic lymphocytic leukemia patients with a 17p chromosomal deletion.11 MM patients with an (11;14) translocation [t(11;14)] have a relatively high BCL2 gene expression level compared with gene expression of BCL2L1 (BCL-XL) or MCL1 and respond to ABT-199 as single treatment.12,13 Consistent with these findings, MM cells with high gene expression of MCL1 or BCL2L1 are less sensitive to venetoclax.9 Instead, MCL-1–specific BH3 mimetics may be effective, and multiple MCL-1–specific BH3 mimetics, such as S63845,14 have been developed and are currently being tested in phase 1 clinical trials for MM.15
The heterogeneity of MCL-1, BCL-2, and BCL-XL expression in MM patients suggests that BH3 mimetics targeting each of these proteins may be more effective in specific patient groups. Expression of single prosurvival proteins may not directly correlate with inhibitor sensitivity, which rather seems to be a consequence of the relative expression and distribution of multiple pro- and antiapoptotic BCL-2 family members.9,16,17 Finding tumor characteristics that predict inhibitor responses is therefore key for finding optimal therapy combinations. In addition to age, fitness, and tumor stage, several genetic aberrations are strongly associated with treatment response and patient survival.18 Of these genetic lesions, 1q21 amplification, 17p13 deletion, t(4;14), t(14;16), and t(14;20) are associated with poor prognosis.18,19
Because MCL1 is 1 of the genes located on 1q21, we hypothesized that amplification of 1q21 would lead to increased MCL-1 expression, possibly conferring increased sensitivity to MCL-1 targeting. In 47 primary MM bone marrow (BM) samples and 31 human MM cell lines (HMCLs), we determined dependence on MCL-1, BCL-2, and BCL-XL by treatment with specific BH3 mimetics and investigated whether this correlated with tumor cytogenetics, disease stage, or protein expression. In addition, combinations of BH3 mimetics were used to determine whether they acted in synergy. We found that plasma cells (PCs) from MM patients with 1q21 amplification are markedly more sensitive to MCL-1 inhibition, and the subgroup with both 1q21 amplification and increased serum levels of β2 microglobulin (β2m) has highest sensitivity. Therefore, 1q21 amplification is a possible new patient-specific marker for the selection of targeted therapy in MM.
Materials and methods
Cell culture and chemicals
HMCLs were cultured in RPMI 1640 GlutaMAX HEPES (N-2-hydroxyethylpiperazine-N′-2-ethanesulfonic acid) culture medium (Life Technologies) or Iscove modified Dulbecco medium (Life Technologies) for LME-1, supplemented with 10% fetal bovine serum (FBS; Biowest) and 100 µg/mL of penicillin-streptomycin (Gibco/Life Technologies). For NCI-H929, RPMI 1640 medium was supplemented with 20% FBS, 1 mM of sodium pyruvate (Thermo Fisher), and 50 µM of β-mercaptoethanol (Life Technologies). MS-5 cells were cultured in MEM α (Life Technologies) with 10% FBS, 2 mM of l-glutamine (Life Technologies), and 100 µg/mL of penicillin-streptomycin. Human mesenchymal stromal cells (MSCs) were isolated from (allogeneic) MM BM by adherence to tissue culture plastic and cultured in MEM α supplemented with 10% FBS, 0.2 of mM L-ascorbic acid 2-phosphate (Cayman Chemical), and 100 µg/mL of penicillin-streptomycin.
Patient samples
Primary human MM samples of newly diagnosed patients were obtained from the Parelsnoer Institute biobank. All samples were obtained after written informed consent, and protocols were approved by the local ethics committee of the University Medical Center Utrecht and contributing partners of the Parelsnoer Institute. After thawing, primary MM samples were plated on monolayers of near-confluent MS-5 feeder cells and recovered for 24 hours. In experiments comparing culture systems, MM cells were plated without supporting cells, with MS-5 cells, with MSCs in 2-dimensional (2D) culture, or with MSCs in 3D culture in 0.5% PuraMatrix hydrogel (Corning) (3D-MSCs), as described elsewhere.20 In flow cytometric experiments, MM cells were distinguished by positive surface staining with CD38-PerCP.CY5.5 (BioLegend). Clinical data and cytogenetic information of MM patients were collected by the University Medical Center Utrecht and Leiden University Medical Center. Clinical data included age, sex, International Staging System (ISS) stage, PC percentage, β2m level, and occurrence of bone lesions, anemia, and/or renal insufficiency. Cytogenetic information included hyperdiploidy, 13q deletion, 17p deletion, 1q21 gain, t(4;14), t(11;14), t(14;16), and t(14;20).
Apoptosis assays
To determine 50% inhibitory concentrations (IC50s), cells were treated with serially diluted individual or combined BH3 mimetics S63845 (MCL-1i; Servier), ABT-199 (BCL-2i; LKT Laboratories), and A-1331852 (BCL-XLi; gift of G. Lessene, Walter and Eliza Hall Institute of Medical Research; Figure 1A-B; supplemental Figure 1). Cell viability 6 hours after treatment was determined using CellTiter-Glo assay (Promega, category #G9241) and normalized dimethyl sulfoxide controls. Specific apoptosis and IC50s, as shown in Figures 1C, 2-4, and 6-7 and supplemental Figures 2, 4-5, and 7-9, were determined after 24 hours of treatment with S63845, ABT-199, and A-1155463 (BCL-XLi; MedChemExpress) by staining with 15 nM of DiOC6 (Thermo Scientific) and 20 nM of TO-PRO-3 (Thermo Scientific). Specific apoptosis was calculated using flow cytometric analysis (FACSCanto II; BD Biosciences) by measuring the altered percentage of DiOC6+/TO-PRO-3− (live) cells compared with untreated cells and was defined as follows: ([% cell death in treated cells − % cell death in control]/% viable cells control) × 100. Synergy was assessed by treating cells with a dilution series of 2 drugs, single and in combinations of concentrations. Inhibitor concentrations that induce 50% specific apoptosis were used to make isobolograms. CIs were calculated using the Chou-Talalay method.21
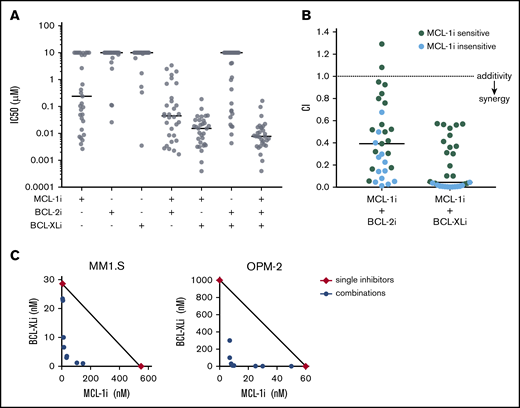
MCL-1i has single-drug activity and synergizes with BCL-2i and BCL-XLi in HMCLs. (A) IC50 (µM) of BH3 mimetics in HMCLs, single and combined (ratios of combined BH3 mimetics are 1:1 or 1:1:1) after treatment for 6 hours and determined by Celltiter Glo assay. Black lines indicate median values. (B) For all 31 HMCLs, combination indices (CIs) were calculated for the indicated inhibitor combinations. CI <1 indicates synergy (dotted line). Cell lines insensitive to MCL-1i (ie, IC50 > 1 μM) are shown in blue. Solid lines indicate median values. (C) Synergy between MCL-1i and BCL-XLi was studied by combining concentration series of the 2 inhibitors in a matrix after treatment for 24 hours using DiOC6/TO-PRO-3 flow cytometric staining as readout. The isobolograms show concentrations at which the combined inhibitors induced 50% specific apoptosis (IC50; blue points). Red diamonds indicate the IC50s of the single drugs. Black lines illustrate where CI = 1. For MM1.S, CI < 1, indicating synergy of MCL-1i and BCL-XLi. In OPM-2, the IC50 of BCL-XLi was >1000, but it was set to 1000 to be able to calculate CI values. The resulting CI (<1) therefore underestimates the synergistic effect in OPM-2.
MCL-1i has single-drug activity and synergizes with BCL-2i and BCL-XLi in HMCLs. (A) IC50 (µM) of BH3 mimetics in HMCLs, single and combined (ratios of combined BH3 mimetics are 1:1 or 1:1:1) after treatment for 6 hours and determined by Celltiter Glo assay. Black lines indicate median values. (B) For all 31 HMCLs, combination indices (CIs) were calculated for the indicated inhibitor combinations. CI <1 indicates synergy (dotted line). Cell lines insensitive to MCL-1i (ie, IC50 > 1 μM) are shown in blue. Solid lines indicate median values. (C) Synergy between MCL-1i and BCL-XLi was studied by combining concentration series of the 2 inhibitors in a matrix after treatment for 24 hours using DiOC6/TO-PRO-3 flow cytometric staining as readout. The isobolograms show concentrations at which the combined inhibitors induced 50% specific apoptosis (IC50; blue points). Red diamonds indicate the IC50s of the single drugs. Black lines illustrate where CI = 1. For MM1.S, CI < 1, indicating synergy of MCL-1i and BCL-XLi. In OPM-2, the IC50 of BCL-XLi was >1000, but it was set to 1000 to be able to calculate CI values. The resulting CI (<1) therefore underestimates the synergistic effect in OPM-2.
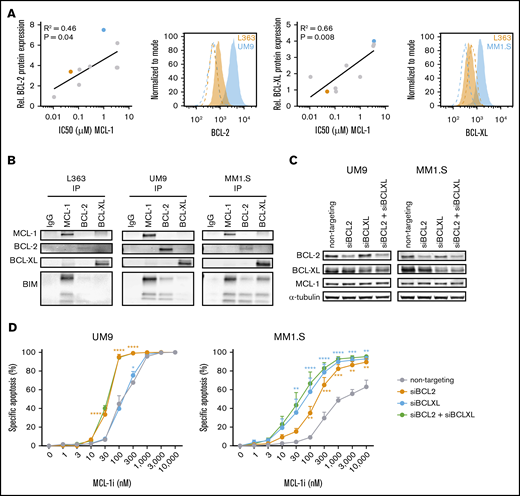
High BCL-2 or BCL-XL expression confers resistance against MCL-1i in HMCLs. (A) The correlation between BCL-2 or BCL-XL expression (fold over isotype control) as determined by flow cytometry and IC50s of MCL-1i in 9 HMCLs (RPMI-8226, NCI-H929, L363, LME-1, MM1.S, OPM-2, U266, UM1, and UM9). Representative histograms from BCL-2 or BCL-XL (filled) and isotype (dotted lines) staining of high- (blue) and low-expressing (orange) cell lines are shown, with the cell lines marked in the same colors in the adjacent correlation plot. (B) Coimmunoprecipitation of MCL-1, BCL-2, and BCL-XL and staining for BIM in L363 (MCL-1i sensitive), UM9 (MCL-1i insensitive, high BCL-2), and MM1.S (MCL-1i insensitive, high BCL-XL). (C) Protein expression 48 hours after small interfering RNA (siRNA)–mediated knockdown of BCL-2, BCL-XL, or both. (D) Specific apoptosis after 24 hours of treatment of cells from panel C with MCL-1i. Statistical significance is shown for siBCL-2 and siBCL-XL compared with the nontargeting control. *P < .05, **P < .01, ***P < .001, ****P < .0001. IgG, immunoglobulin G.
High BCL-2 or BCL-XL expression confers resistance against MCL-1i in HMCLs. (A) The correlation between BCL-2 or BCL-XL expression (fold over isotype control) as determined by flow cytometry and IC50s of MCL-1i in 9 HMCLs (RPMI-8226, NCI-H929, L363, LME-1, MM1.S, OPM-2, U266, UM1, and UM9). Representative histograms from BCL-2 or BCL-XL (filled) and isotype (dotted lines) staining of high- (blue) and low-expressing (orange) cell lines are shown, with the cell lines marked in the same colors in the adjacent correlation plot. (B) Coimmunoprecipitation of MCL-1, BCL-2, and BCL-XL and staining for BIM in L363 (MCL-1i sensitive), UM9 (MCL-1i insensitive, high BCL-2), and MM1.S (MCL-1i insensitive, high BCL-XL). (C) Protein expression 48 hours after small interfering RNA (siRNA)–mediated knockdown of BCL-2, BCL-XL, or both. (D) Specific apoptosis after 24 hours of treatment of cells from panel C with MCL-1i. Statistical significance is shown for siBCL-2 and siBCL-XL compared with the nontargeting control. *P < .05, **P < .01, ***P < .001, ****P < .0001. IgG, immunoglobulin G.
Intracellular staining
For intracellular BCL-2 family protein staining, cells were fixed and permeabilized using BD Cytofix/Cytoperm (BD Biosciences) and stained with mouse anti–BCL-2 phycoerythrin (PE; BD Biosciences), rabbit anti–BCL-XL (Cell Signaling), isotype controls mouse IgG1K PE (Sony Biotech) and rabbit IgG (Santa Cruz), and goat anti-rabbit IgG1 fluorescein isothiocyanate (Santa Cruz). Flow cytometry (FACSCanto II; BD Biosciences) was performed and staining intensity was analyzed using FACSDiva and FlowJo software.
siRNA knockdown, coimmunoprecipitation, and immunoblotting
siRNA-mediated knockdown of BCL-2 and BCL-XL was performed using ON-TARGETplus human nontargeting, BCL2, and BCL2L1 SMARTpools (Horizon) and Neon Transfection System (Thermo Fisher) with 2 × 30 ms pulses of 1050 (UM9) or 1150 V (MM1.S). Lysis buffer containing 1% NP-40 was used to obtain lysates for coimmunoprecipitation and western blotting. Coimmunoprecipitation was performed using Dynabeads Protein G kit (Invitrogen), with rabbit IgG (R&D), rabbit anti–MCL-1 (Abcam), mouse anti–BCL-2 (Cell Signaling), and rabbit anti–BCL-XL (Cell Signaling) antibodies. Proteins were separated using sodium dodecyl sulfate polyacrylamide gel electrophoresis, transferred to low-fluorescence polyvinylidene difluoride membranes (Bio-Rad), blocked in PBS containing 2% nonfat dry milk, and stained using the aforementioned antibodies, as well as mouse anti–α-tubulin, rabbit anti-BIM (Cell Signaling), goat anti-mouse 680RD, and goat anti-rabbit 800CW (LI-COR Biosciences). Infrared imaging was used for detection (Odyssey Sa; LI-COR Biosciences). Analysis and quantification were performed using LI-COR Image Studio and ImageJ 1.47V software.
Immunohistochemistry
Paraffin-embedded 4-µm tissue sections of BM biopsies from MM patients (n = 11) were stained with anti-CD138 (Dako) and anti–MCL-1 (Dako) antibodies and detected using a Ventana Benchmark ULTRA and BrightVision poly-HRP anti-mouse/rabbit IgG (VWR), respectively. Visualization was performed with diaminobenzidine as chromogen. Results were evaluated by 2 experienced observers, who were blinded to the clinical characteristics and experimental results. Sections were evaluated for CD138 expression, after which the MCL-1 staining intensity on a sequential section was scored (weak staining, 1; moderate, 2; strong, 3).
Copy-number variation and gene expression data analysis
Using published data sets, MCL1 gene expression was assessed in different MM disease stages and in patients with or without 1q amplification. The following data sets from the National Center for Biotechnology Information Gene Expression Omnibus were used: GSE265822 and GSE6401.23 Data sets were analyzed using the R2 Genomics Analysis and Visualization Platform.
Statistical analysis
Statistical analysis was performed using GraphPad Prism version 8.0.1. Data are represented as mean or mean ± standard error of the mean, unless otherwise stated. For experiments with cell lines, data points are the mean of ≥3 independent experiments or representative of at least 2 experiments. Groups were compared with Student t test (2 groups), Kruskall-Wallis test (multiple groups), mixed-effects or 2-way analysis of variance (>2 groups at multiple concentrations), or χ2 test (frequencies in categories).
Results
MCL-1i has single-drug activity and synergizes with BCL-2i and BCL-XLi in HMCLs
A panel of 31 HMCLs was used to investigate sensitivity to specific MCL-1, BCL-2, and BCL-XL BH3 mimetics. The cell lines were treated with BH3 mimetic S63845 (MCL-1i),14 venetoclax (BCL-2i),24 and A-1331852 (BCL-XLi),25 and IC50 values were calculated for single inhibitors and inhibitor combinations (Figure 1A; supplemental Figure 1). Most HMCLs were relatively insensitive to BCL-2i or BCL-XLi (median IC50, ≥10 μM for both). In contrast, MCL-1i resulted in a wide range of IC50 values within the cell line panel (median IC50, 239 nM), suggesting that a selection of cell lines is solely dependent on MCL-1 expression for survival. When BCL-2i or BCL-XLi was added to MCL-1i treatment, median IC50 values decreased compared with single-inhibitor treatment (median IC50, 45 nM for MCL-1i + BCL-2i and 15 nM for MCL-1i + BCL-XLi). This effect was strongest for combined inhibition of MCL-1 and BCL-XL, to which all cell lines were sensitive. Calculation of CIs showed that combining MCL-1i with BCL-2i or BCL-XLi results in apoptosis in a synergistic manner, even in cell lines that are insensitive to MCL-1i single treatment (Figure 1B). To further investigate synergy of the MCL-1i and BCL-XLi combination, isobolograms were made for 2 HMCLs (Figure 1C). The observed CIs of <0.2 indicate strong synergy for the MCL-1i and BCL-XLi combination, in an MCL-1i–sensitive cell line (OPM-2) as well as in an MCL-1i–insensitive cell line (MM1.S).
On the basis of these observations, we investigated whether BCL-2 or BCL-XL protein expression levels correlated with sensitivity to MCL-1i (Figure 2A). MCL-1i IC50 correlated with expression of both BCL-2 and BCL-XL (R2 = 0.46 and 0.66; P = .04 and .008, respectively), suggesting that high expression of these proteins may render MM cells more resistant to MCL-1 inhibition. A correlation between MCL-1 inhibitor sensitivity and BCL-2 protein expression was also recently observed by others using the MCL-1–specific BH3 mimetic AZD5991.26 MCL-1i IC50 did not correlate with MCL-1 protein expression (supplemental Figure 2). In this HMCL panel, BCL-XL expression seemed to be the strongest predictor for MCL-1i sensitivity, which may explain the high killing potential of combined MCL-1 and BCL-XL inhibitors, shown in Figure 1A-B. On the basis of these findings, we tested the relation between BCL-2 or BCL-XL expression and MCL-1i sensitivity. We selected an MCL-1i–sensitive (L363) and 2 MCL-1i–insensitive HMCLs (UM9 and MM1.S) expressing high BCL-2 or BCL-XL, respectively, and tested the binding pattern of proapoptotic BIM. This revealed that, among these 3 prosurvival BCL-2 family proteins, BIM was exclusively bound to MCL-1 in L363 cells, suggesting that MCL-1 inhibition releases the total BIM pool. In contrast, BIM was bound to both MCL-1 and BCL-2 in UM9 cells and to MCL-1, BCL-XL, and BCL-2 in MM1.S cells, suggesting that MCL-1 inhibition in these cells only partially releases cellular BIM (Figure 2B; supplemental Figure 3). In line with these results, knocking down BCL-2 and/or BCL-XL expression in UM9 and MM-1S resensitized these HMCLs to single MCL-1i treatment (Figure 2C-D). Overall, our data show that sensitivity to MCL-1i depends to a large extent on expression of BCL-2 and BCL-XL, where high expression of BCL-2 and/or BCL-XL results in reduced sensitivity to MCL-1i, and low expression results in high sensitivity to MCL-1i, as shown previously,9,11 and that inhibition of MCL-1, especially in combination with BCL-XL inhibition, efficiently induces apoptosis in HMCLs.
Ex vivo cultured MM PCs vary in sensitivity to BH3 mimetics
Our experiments with HMCLs show that MCL-1 inhibitor S63845 is indeed a promising drug for promoting apoptosis in MM, either alone or in combination with BCL-2 or BCL-XL inhibition. Next, we examined the effect of BH3 mimetics in primary MM cells from 47 newly diagnosed patients and tested whether we could predict sensitivity to MCL-1i in these samples. We received corresponding patient characteristics and cytogenetics (summarized in Table 1).
Clinical characteristics and frequency of cytogenetic and diagnostic determinants of MM patients (N = 47)
| Characteristic | n (%) or n/N (%) |
|---|---|
| Age at diagnosis, y | |
| Median | 63 |
| Range | 40-87 |
| Sex | |
| Male | 33 (70) |
| Female | 14 (30) |
| PCs, % | |
| Median | 45 |
| Range | 4-100 |
| Immunoglobulin type | |
| IgG | 24 (51) |
| Non-IgG | 23 (49) |
| Light chain type | |
| κ | 26 (55) |
| λ | 21 (45) |
| Cytogenetics | |
| Standard risk | 32/47 (68) |
| High risk [1q amp, 17p del, t(4;14), or t(14;16)] | 15/47 (32) |
| Hyperdiploidy | 20/40 (50) |
| 13q del | 16/40 (40) |
| 1q amp | 12/44 (27) |
| t(11;14) | 7/38 (18) |
| t(4;14) | 3/41 (7) |
| t(14;16) | 2/42 (5) |
| 17p del | 0/26 (0) |
| ISS stage at diagnosis | |
| 1 | 16 (34) |
| 2 | 14 (30) |
| 3 | 13 (28) |
| ND | 4 (9) |
| Serum β2m ≥5.5 mg/L | 16/39 (41) |
| Serum albumin <3.5 g/L | 32/47 (68) |
| Bone lesions | 34/47 (72) |
| Anemia | 15/47 (32) |
| Renal insufficiency (serum creatinine levels >173 mmol/L) | 9/47 (19) |
ND, no data.
Part of each MM sample was treated with single or combined BH3 mimetics, and the remaining cells were used for measurement of intracellular BCL-2 and BCL-XL protein expression. Using this method, we confirmed previously reported increased sensitivity to venetoclax of MM PCs with t(11;14) or high BCL-2 protein expression (supplemental Figure 4).12,27 Notably, when MCL-1i was added to BCL-2i, no increased sensitivity was seen for t(11;14) MM compared with non-t(11;14), whereas MM with high expression of BCL-2 was significantly more sensitive to this inhibitor combination compared with MM with low BCL-2.
After treatment of the whole cohort with BH3 mimetics, we observed that MCL-1i sensitivity varied greatly between patients, with average specific apoptosis of 44% (range, 1%-97%) after treatment with 1000 nM of MCL-1i (Figure 3A; supplemental Figure 5). As observed with HMCLs, addition of BH3 mimetics against BCL-2 or BCL-XL further increased sensitivity to MCL-1i (Figure 3B-C).

MM cell sensitivity to MCL-1i treatment is highly variable, and combination of MCL-1i with other BH3 mimetics synergistically induces cell death. (A) Specific apoptosis induced in MM PCs (n = 47), distinguished by their CD38+ phenotype, after 24 hours of treatment with the indicated concentrations of MCL-1i S63845. (B) Specific apoptosis induced in MM PCs (n = 47) after combination of MCL-1i treatment (at indicated concentrations) with 100 nM of BCL-2i or BCL-XLi. Black lines indicate average values. (C) Representative example of flow cytometric analysis of apoptosis induction in CD38+ (MM) cells after 24 hours of treatment with the indicated BH3 mimetics. Outlined areas indicate the populations of viable (DiOC6+/TO-PRO-3−) cells. (D) Linear regression analysis between specific apoptosis of MM samples (n = 6) cultured on MS-5 cells and MSCs, after treatment with indicated concentrations of MCL-1i (upper) or BCL-2i (lower). Tables show all coefficients of determination (R2 values) for MS-5 and other culture systems, after treatment with MCL-1i or BCL-2i. *P < .05, **P < .01, ***P < .001.
MM cell sensitivity to MCL-1i treatment is highly variable, and combination of MCL-1i with other BH3 mimetics synergistically induces cell death. (A) Specific apoptosis induced in MM PCs (n = 47), distinguished by their CD38+ phenotype, after 24 hours of treatment with the indicated concentrations of MCL-1i S63845. (B) Specific apoptosis induced in MM PCs (n = 47) after combination of MCL-1i treatment (at indicated concentrations) with 100 nM of BCL-2i or BCL-XLi. Black lines indicate average values. (C) Representative example of flow cytometric analysis of apoptosis induction in CD38+ (MM) cells after 24 hours of treatment with the indicated BH3 mimetics. Outlined areas indicate the populations of viable (DiOC6+/TO-PRO-3−) cells. (D) Linear regression analysis between specific apoptosis of MM samples (n = 6) cultured on MS-5 cells and MSCs, after treatment with indicated concentrations of MCL-1i (upper) or BCL-2i (lower). Tables show all coefficients of determination (R2 values) for MS-5 and other culture systems, after treatment with MCL-1i or BCL-2i. *P < .05, **P < .01, ***P < .001.
In this experimental setup, the MM cells were supported by MS-5 feeder cells, which support MM viability in short-term cultures. Additionally, we validated the results obtained from MS-5 coculture in a set of other culture systems. To this end, 6 MM samples were cultured with MS-5 cells, MSCs, or 3D-MSCs20 or without feeder cells. Baseline viability of samples decreased most strongly after 48 hours without feeder cells, and viability was maintained to the highest extent in coculture with MS-5 cells (supplemental Figure 6). A strong correlation in MCL-1i and BCL-2i sensitivity was observed between the MS-5 culture system and all other culture systems (Figure 3D), indicating that the relative sensitivity to BCL-2 family inhibitors in MM samples can be determined regardless of the culture system.
1q21 amplification correlates with increased MCL-1i sensitivity
To address the hypothesis that 1q21 amplification leads to high MCL-1 expression and therefore confers cellular dependence on MCL-1, we compared MCL-1i sensitivity of patient samples with and without 1q21 amplification. We demonstrated that MCL-1i sensitivity was significantly increased (2.4-fold and 1.8-fold at 100 and 1000 nM, respectively) in 1q21-amplified PCs (Figure 4A). In addition, although sensitivity to BCL-2i or BCL-XLi single treatment was not affected by 1q21 status, we observed a strong trend toward increased sensitivity to MCL-1i + BCL-2i treatment of 1q21-amplified MM, as well as significantly increased apoptosis after MCL-1i + BCL-XLi treatment (Figure 4B). Despite the limited sample size, increased MCL-1i sensitivity of 1q-amplified MM was validated in culture with MSCs, and a similar trend was observed for other culture systems (supplemental Figure 7). In contrast, HMCL, BCL-2, or BCL-XL expression in primary MM cells did not correlate with MCL-1i sensitivity (supplemental Figure 8).

1q21 amplification correlates with increased MCL-1i sensitivity. (A) Differences in specific apoptosis of patients with wild-type (WT) 1q21 (n = 32) or amplification of 1q21 (n = 12), after treatment with MCL-1i for 24 hours. (B) Differences in specific apoptosis of patients with WT and amplified 1q21 after treatment with BCL-2i (left) or BCL-XLi (right) and their combinations with MCL-1i (all inhibitors, 100 nM). ns, nonsignificant.
1q21 amplification correlates with increased MCL-1i sensitivity. (A) Differences in specific apoptosis of patients with wild-type (WT) 1q21 (n = 32) or amplification of 1q21 (n = 12), after treatment with MCL-1i for 24 hours. (B) Differences in specific apoptosis of patients with WT and amplified 1q21 after treatment with BCL-2i (left) or BCL-XLi (right) and their combinations with MCL-1i (all inhibitors, 100 nM). ns, nonsignificant.
1q21-amplified MM is characterized by high MCL1 expression
Because MM with 1q21 amplification had increased sensitivity to MCL-1i, we investigated whether this subgroup was characterized by high MCL1 expression. To test whether 1q21-amplified MM correlated with high MCL-1 protein expression, we performed immunohistochemical staining for MCL-1 on 11 BM biopsies, of which 6 had 1q21 amplification. We observed strong differences in MCL-1 staining intensity in MM cells between samples (Figure 5A), with generally higher MCL-1 staining in the 1q21-amplified samples (Figure 5B). Interestingly, the only 1q21− sample that had high (level 3) MCL-1 staining was also very sensitive to MCL-1i treatment (MMP1; supplemental Figure 5). High MCL-1 protein expression and MCL-1i sensitivity in this sample may result from posttranscriptional and/or posttranslational regulation of MCL-1. By analyzing published messenger RNA expression data, we found significantly increased MCL1 gene expression in patients with 1q amplification in 2 independent data sets (Figure 5C). Additionally, MCL1/BCL2 and MCL1/BCL2L1 ratios were increased in the groups with 1q amplification (Figure 5C).
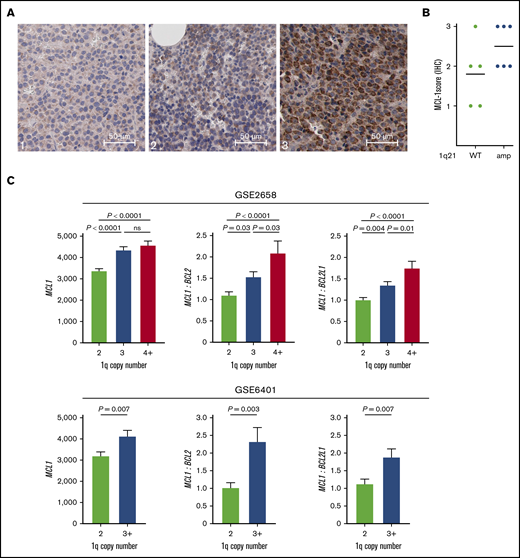
1q21-amplified MM is characterized by high MCL1 expression. (A) Representative images of low (left; 1), moderate (center; 2), and high (right; 3) MCL-1 staining of MM BM biopsies by immunohistochemistry (IHC) (original magnification ×400). (B) MCL-1 staining intensity in 1q21 WT (n = 5) and amplified (n = 6) patient samples, as determined by IHC. (C) MCL1 gene expression and MCL1/BCL2 and MCL1/BCL2L1 (BCL-XL) ratios in patients without and with 1q amplification (GSE2658: 2 copies, n = 131; 3 copies, n = 69; ≥4 copies, n = 43; and GSE6401: 2 copies, n = 37; ≥3 copies, n = 40). Ratios were calculated based on normalized gene expression values. ns, nonsignificant.
1q21-amplified MM is characterized by high MCL1 expression. (A) Representative images of low (left; 1), moderate (center; 2), and high (right; 3) MCL-1 staining of MM BM biopsies by immunohistochemistry (IHC) (original magnification ×400). (B) MCL-1 staining intensity in 1q21 WT (n = 5) and amplified (n = 6) patient samples, as determined by IHC. (C) MCL1 gene expression and MCL1/BCL2 and MCL1/BCL2L1 (BCL-XL) ratios in patients without and with 1q amplification (GSE2658: 2 copies, n = 131; 3 copies, n = 69; ≥4 copies, n = 43; and GSE6401: 2 copies, n = 37; ≥3 copies, n = 40). Ratios were calculated based on normalized gene expression values. ns, nonsignificant.
Presence of 1q21 in combination with other poor-prognosis diagnostic markers identifies patient subsets of MM most sensitive to MCL-1i
In addition to patients with 1q21 amplification, we also found enhanced MCL-1i sensitivity in patients with increased (≥5.5 mg/L) serum β2m level (1.6-fold at 1000 nM; P = .03; Figure 6A). Elevated serum β2m levels are associated with poor prognosis of MM,28,29 and the ISS for MM assigns stage 3 to patients with serum β2m levels >5.5 mg/L.30 We analyzed the relative abundance of 1q21 amplification in relation to serum β2m levels and found enrichment of 1q21-amplified patients in the high β2m group (45% vs 19%; Figure 6B). Next, combining β2m status and 1q21 amplification enabled identification of a patient subset with the highest sensitivity to MCL-1i, namely patients who had both 1q21 amplification and high β2m levels (Figure 6C). This patient subset has 1.9-fold increased specific apoptosis after treatment with 1000 nM of MCL-1i compared with the average of the whole cohort (84% specific apoptosis, n = 5 vs 44% in the whole cohort, N = 47). Moreover, specific apoptosis in this patient subset was increased 2.7-fold compared with the patient group that had no 1q21 amplification and normal β2m levels (84% vs 31%). Within 1q21-amplified MM, patients with normal β2m levels were less sensitive to MCL-1i compared with the group with increased β2m, suggesting that enrichment of 1q21 amplification does not fully explain increased MCL-1i sensitivity of MM cells from patients with increased β2m.
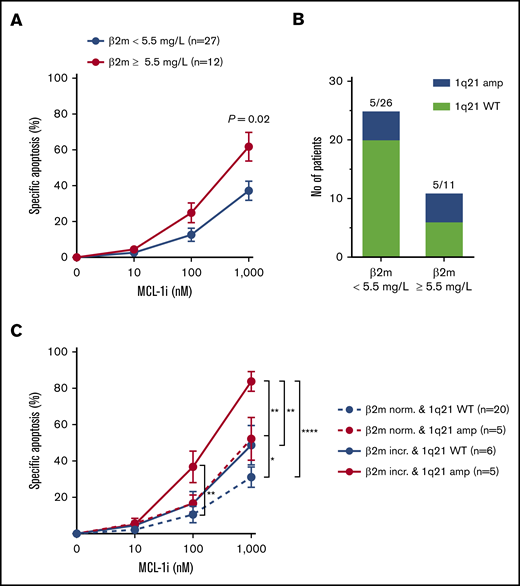
Presence of 1q21 in combination with other poor-prognosis diagnostic markers identifies patient subsets of MM most sensitive to MCL-1i. (A) Specific apoptosis of patients with normal (<5.5 mg/L; n = 23) or increased (≥5.5 mg/L; n = 15) serum β2m levels, after treatment with MCL-1i for 24 hours. (B) Fraction of patients with 1q21 amplification in the groups shown in panel A. (C) As in panel A, but with stratification for 1q21 amplification status. Red lines indicate patient groups with 1q21 amplification, and blue lines show groups with WT 1q21. Dotted lines indicate normal levels of β2m, and filled lines indicate increased β2m. Group sizes are shown in the figure legend. *P < .05, **P < .01, ****P < .0001.
Presence of 1q21 in combination with other poor-prognosis diagnostic markers identifies patient subsets of MM most sensitive to MCL-1i. (A) Specific apoptosis of patients with normal (<5.5 mg/L; n = 23) or increased (≥5.5 mg/L; n = 15) serum β2m levels, after treatment with MCL-1i for 24 hours. (B) Fraction of patients with 1q21 amplification in the groups shown in panel A. (C) As in panel A, but with stratification for 1q21 amplification status. Red lines indicate patient groups with 1q21 amplification, and blue lines show groups with WT 1q21. Dotted lines indicate normal levels of β2m, and filled lines indicate increased β2m. Group sizes are shown in the figure legend. *P < .05, **P < .01, ****P < .0001.
Increased β2m serum levels can be the result of impaired renal filtration, which is often seen in MM. In our cohort, presence of renal insufficiency or ISS stage was indeed also linked to increased sensitivity to MCL-1i (supplemental Figure 9A-B). Presence of bone lesions, anemia, or high PC percentage did not correlate with MCL-1i sensitivity (supplemental Figure 9C).
Subset of patients without 1q21 amplification shows sensitivity toward MCL-1 inhibition
To further evaluate MCL-1i sensitivity of 1q21-amplified MM, patients were divided into equally sized subgroups of high or low sensitivity to MCL-1i (Figure 7A-B). Subsequently, the abundance of these groups within 1q21 WT and 1q21-amplified MM was determined. Within 1q21-amplified MM, 75% had high sensitivity to MCL-1i, whereas this was only 19% within 1q21 WT MM (Figure 7A-B). Even though this analysis underlines the sensitivity of 1q21 amplification as a marker for susceptibility to MCL-1i, it also shows that a subset of 1q21 WT MM may benefit from MCL-1i treatment.
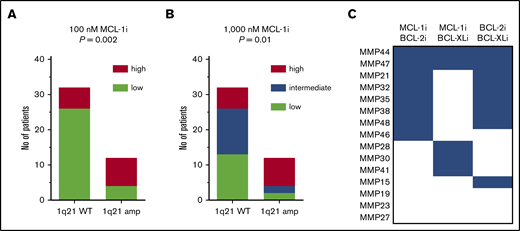
A subset of patients without 1q21 amplification shows sensitivity to MCL-1 inhibition. (A) Fraction of patients within 1q21 WT and amplified groups with high (≥20%; n = 14) or low (<20%; n = 30) sensitivity to MCL-1i at 100 nM. Significance by χ2 test is shown in the graph. (B) As in panel A, but at 1000 nM of MCL-1, where high (≥60%; n = 14), intermediate (23%-60%; n = 15), and low (<23%; n = 15) sensitivity groups could be identified. Cutoff values were based on terciles of specific apoptosis after 24 hours of treatment with MCL-1i. (C) Inhibitor combination sensitivity of patients with low sensitivity to single MCL-1i. Blue boxes indicate at least intermediate sensitivity, after 24 hours of treatment with indicated inhibitor combinations (all at 100 nM). Two patients in this analysis had amplification of 1q21, namely MMP27 and MMP44.
A subset of patients without 1q21 amplification shows sensitivity to MCL-1 inhibition. (A) Fraction of patients within 1q21 WT and amplified groups with high (≥20%; n = 14) or low (<20%; n = 30) sensitivity to MCL-1i at 100 nM. Significance by χ2 test is shown in the graph. (B) As in panel A, but at 1000 nM of MCL-1, where high (≥60%; n = 14), intermediate (23%-60%; n = 15), and low (<23%; n = 15) sensitivity groups could be identified. Cutoff values were based on terciles of specific apoptosis after 24 hours of treatment with MCL-1i. (C) Inhibitor combination sensitivity of patients with low sensitivity to single MCL-1i. Blue boxes indicate at least intermediate sensitivity, after 24 hours of treatment with indicated inhibitor combinations (all at 100 nM). Two patients in this analysis had amplification of 1q21, namely MMP27 and MMP44.
Next, we examined whether MCL-1i–insensitive patients can be resensitized by cotreatment with BCL-2i or BCL-XLi (Figure 7C). In this group, 73% showed sensitivity to a combination of MCL-1i with BCL-2i or BCL-XLi, suggesting that the synergistic effect between S63845 and other BH3 mimetics found in HMCL is replicated in primary samples insensitive to MCL-1i alone.
Discussion
MCL-1, BCL-2, and BCL-XL seem promising therapeutic targets in MM, but dependence on these 3 prosurvival proteins varies between patients. In fact, using BH3 profiling or a BH3 mimetic toolkit, others have shown that dependence on these proteins is highly variable.31,32 Our study aimed to identify groups of patients sensitive to MCL-1–specific BH3 mimetics. To this end, we analyzed sensitivity of HMCLs and primary MM samples to MCL-1i alone or in combination with BCL-2i and BCL-XLi and searched for patient characteristics that correlated with inhibitor sensitivity.
As more MM treatment options become available, it is increasingly important to be able to predict which patient will benefit from which therapy. It has previously been shown that venetoclax as monotherapy is effective in MM patients with t(11;14), who were reported to have relatively high BCL2 gene expression compared with BCLXL and MCL1.12 Additionally, venetoclax, in combination with bortezomib and dexamethasone, was shown to be particularly effective in MM patients with high BCL2 gene expression.27 We were able to reproduce these findings in our experimental setup, supporting the validity of our approach. Our data indicate that at time of diagnosis, MM cells from more than half of all patients are sensitive to MCL-1 inhibition, underlining the potential of MCL-1–specific BH3 mimetics as first-line therapy. Importantly, we showed that MM with 1q21 amplification was the patient subgroup most likely to benefit from MCL-1i treatment. Reported incidence of 1q amplification in large cohorts of newly diagnosed MM ranges between 34.5% and 43%.19,33 At relapse, 1q amplification occurs in 72% of MM patients.32 In our cohort of newly diagnosed MM, 1q amplification was present in 28.5% of patients, and most of them (75%) showed high sensitivity to MCL-1i. Combined, this shows that amplification of 1q21 identifies a large patient subset that may be treated more effectively with MCL-1i. Notably, a reasonable proportion (19%) of MM without 1q21 amplification is highly sensitive to MCL-1i as well, suggesting that effectiveness of MCL-1i treatment may not be limited to 1q21-amplified MM. Besides by increased transcription, MM cells can also overexpress MCL-1 through posttranscriptional regulation. Because MCL-1 can be subject to complex modification at the protein level as well,34 studying MCL-1 protein expression and stability may provide mechanisms that explain MCL-1i sensitivity in 1q21 WT MM.
To support primary MM cells ex vivo, we used MS-5 feeder cells, because they promote MM viability in short-term cultures without producing interleukin-6. Other published culture systems for MM cells include MSCs in 2D or 3D culture,20 the latter of which was set up to mimic the structure and cellular support of the BM microenvironment. Our MM material consisted of frozen biobanked samples, which were shown to maintain highest cell viability when cultured on MS-5 cells. We observed strong correlations between results obtained with the murine BM-derived stromal cell line MS-5 and with primary MSCs derived from BM of MM patients, in either a 2D or more protective 3D setting, suggesting that MCL-1i–sensitive and –insensitive MMs can be identified regardless of the culture system. Moreover, our findings using these different culture methods are in line with a recent publication where increased MCL-1i sensitivity was observed in a small cohort of directly isolated MM patient samples containing 1q amplification compared with samples without this chromosomal gain.35 Although we used different culture methods, a common prosurvival factor that may skew sensitivity toward MCL-1i in certain MM samples cannot be ruled out. Therefore, it remains important to validate the increased MCL-1i sensitivity of 1q-amplified MM using a large cohort of freshly isolated MM BM samples.
Although 1q21 amplification is considered a poor prognosis marker in MM, the responsible genes located on 1q21 that underlie this poor prognosis remain debatable. Besides MCL1, other potentially responsible genes in this region include the cell-cycle progression genes CKS1B20 and PMSD4,21 the latter of which has been associated with bortezomib resistance. Here, we report increased MCL1 expression and MCL-1i sensitivity in MM with 1q21 amplification. In contrast to BCL-2 and BCL-XL, MCL-1 protein expression could not be quantitatively measured by flow cytometry. Therefore, it was not possible to correlate MCL-1 protein levels with 1q21 amplification status in the complete patient cohort. Alternatively, we were able to measure MCL-1 protein expression using immunohistochemistry for a limited group of MM patient samples that were also used throughout the study and for which material was available. These data indeed suggest a positive correlation between 1q21 amplification status and MCL-1 protein expression. In HMCLs, there was no correlation between MCL-1i sensitivity and MCL-1 protein expression as determined by western blotting, but we did observe inverse correlations between BCL-2 and BCL-XL expression and MCL-1i sensitivity. It is not surprising that expression of single prosurvival proteins does not always directly correlate with inhibitor sensitivity. Inhibitor sensitivity rather seems to be a consequence of the relative expression and distribution of multiple pro- and antiapoptotic BCL-2 family members, as we also observed by examining interaction patterns of BIM in MCL-1i–sensitive and –insensitive HMCLs.9,16,17
Recently, sensitivity to MCL-1i was shown to be increased in MM cells from relapsed compared with newly diagnosed patients.32 This may be explained by increased incidence of 1q21 amplification at relapse.33 Investigating the effect of current treatment regimens as well as BH3 mimetic treatment on MCL-1i sensitivity during the whole course of disease will be very important for optimal implementation of BH3 mimetic treatment in clinical practice.
When investigating the enrichment of 1q21-amplified MM within the patient subset with increased β2m, we found that both these parameters independently correlated with MCL-1i sensitivity. Patients who had both increased β2m and 1q21 amplification were identified as the patient subset most sensitive to MCL-1i. Both increased β2m levels and 1q21 amplification correlate with poor prognosis of MM, suggesting that MCL-1i treatment can be particularly effective in poor prognosis patients.18,19,28,29 Finding new and effective treatment options for poor prognosis patients is essential for extending overall patient survival.
Previous research in mice showed that MCL1 knockout leads to periimplantation embryonic lethality.36 Conditional gene knockout of MCL1 has lethal effects in multiple cell types, including hematopoietic stem cells,37 cardiomyocytes,38 neural precursor cells,39 B cells,40,41 and healthy PCs.42 However, when S63845 was tested in mice, the drug was well tolerated at doses that were lethal for MM, lymphoma, and acute myeloid leukemia cells,14 suggesting that the effects of pharmacological inhibition of MCL-1 are not as detrimental as the effects of MCL1 gene knockout. This illustrates that there may be a therapeutic window for direct MCL-1 inhibition in MM and other high MCL-1–expressing tumors. Phase 1 clinical trials with MCL-1i, which are currently under way, will clarify whether these preclinical results can be recapitulated in humans and to what extent adverse effects limit the dosage of MCL-1i.
In HMCLs as well as primary MM samples, we found that inhibitor combinations induced apoptosis in a more-than-additive fashion when compared with the expected effect from single drugs. This suggests that combinations of BH3 mimetics may be very powerful in treatment of MM. Adverse effects of individual BH3 mimetics could be reduced by combining 2 inhibitors at much lower concentrations. Clinical targeting of BCL-XL may be difficult because of the dependence of thrombocytes on BCL-XL, which was dose limiting in trials with BCL-2 and BCL-XL inhibitor navitoclax.43-45 Combinations of MCL-1i and BCL-2i were well tolerated in mice and showed synergistic antitumor activity in MM, mantle cell lymphoma, and acute myeloid leukemia.35,46-49 Nevertheless, when MM patients were treated with venetoclax, various cytopenias were observed, including thrombocytopenia and neutropenia.12
Because MCL1 is located on 1q21, a region often amplified in MM, we hypothesized that presence of this amplification would result in enhanced MCL-1 expression and MCL-1i sensitivity. This hypothesis was tested and confirmed in this study using 47 BM aspirates from newly diagnosed MMs. Our results identify the patient subpopulation most sensitive to MCL-1 inhibition, which may guide further testing of MCL-1 inhibitors in future clinical trials.
Acknowledgments
The authors thank the support facilities of the University Medical Center Utrecht (UMCU) and the Dutch Parelsnoer Institute for providing primary MM samples and are grateful to Servier for providing the MCL-1–specific inhibitor S63845. In addition, we thank S. A. G. M. Cillessen for kindly providing the Dako MCL-1 antibody and acknowledge the Departments of Pathology at the UMCU and Amsterdam University Medical Center location VUmc for support with immunohistochemistry, particularly R. J. Leguit, D. Castigliego, M. Ramkema, and W. Vos. The authors also thank J. J. Oudejans (Tergooi Hospital) for immunohistochemistry scoring.
This work was supported in part by a Bas Mulder Award from the Dutch Cancer Foundation (KWF)/Alpe d’HuZes Foundation (UU 2015-7663) (V.P.) and grants from KWF/Alpe d’HuZes Foundation (11108 and 11270) (V.P.). Work in the Huang laboratory was supported by grants and fellowship awards from the Leukemia Lymphoma Society (Specialized Center of Research 7015-18), National Health and Medical Research Council of Australia (fellowship 1043149 and program 1113133; Independent Research Institutes Infrastructure Support Scheme) and the Victorian Government Operational Infrastructure Support 9000220.
The funding agencies played no role in the design, reviewing, or writing of the manuscript.
Authorship
Contribution: V.P., M.C.M., and A.S. designed the research; A.S., L.M.M., J.G., and M.C. did experiments and contributed to interpretation and discussion; V.P., A.S., L.M.M., J.G., M.C., P.A.v.d.B., P.S., D.C.S.H., and M.C.M. contributed to the design of experiments, interpretation of results, and drafting of the manuscript; V.P., A.S., L.M.M., M.C., and J.G. analyzed data and prepared figures; and A.S. and V.P. wrote the manuscript.
Conflict-of-interest disclosure: V.P. received research funding from Philips and royalty payments related to venetoclax. M.C.M. received research funding from Celgene and honoraria from Celgene, Takeda, BMS, and Servier. P.S. received research funding from Amgen, Celgene, Janssen, Takeda, and SkylineDx and honoraria from Amgen, Celgene, Janssen, Takeda, and Karyopharm. J.G. and D.C.S.H. are employees of the Walter and Eliza Hall Institute, which receives milestones and royalty payments related to venetoclax. The remaining authors declare no competing financial interests.
Correspondence: Victor Peperzak, Utrecht University, Heidelberglaan 100, 3584 CX Utrecht, The Netherlands; e-mail: v.peperzak@umcutrecht.nl.

