

Key Points
Cytomegalovirus reactivation and interleukin 15 are major contributors to NK cell repertoire diversity and maturation after CBT.
An immature NK cell subset characterized by low diversity index and poor effector function was highly predictive of relapse after CBT.

Abstract
Natural killer (NK) cells are highly heterogeneous, with vast phenotypic and functional diversity at the single-cell level. They are involved in the innate immune response against malignant and virus-infected cells. To understand the effect of NK diversity during immune recovery on the antitumor response after cord blood transplantation (CBT), we used high-dimensional mass cytometry and the metrics of NK cell diversity to study the NK cell repertoire in serial samples from 43 CBT recipients. A higher-diversity index based on single-cell combinatorial phenotypes was significantly associated with a lower risk for relapse after CBT (P = .005). Cytomegalovirus reactivation was a major factor in the development of a more diverse NK repertoire after CBT. Notably, we identified a group of patients whose CB-derived NK cells after transplantation possessed an immature phenotype (CB-NKim), characterized by poor effector function and a low diversity index. Frequencies of CB-NKim of 11.8% or higher during the early post-CBT recovery phase were highly predictive for relapse (area under the curve [AUC], 0.979), a finding that was validated in a second independent cohort of patients (n = 25; AUC, 0.977). Moreover, we showed that the maturation, diversity, and acquisition of effector function by CB-NKim early after CBT were driven by interleukin 15. Our data indicate that the diversity of the NK cell repertoire after CBT contributes importantly to the risk for subsequent relapse. We suggest that the use of diversity metrics and high-dimensional mass cytometry may be useful tools in predicting clinical outcomes and informing the design of therapeutic strategies to prevent relapse after CBT.
Introduction
Umbilical cord blood transplantation (CBT) has become an accepted alternative treatment of patients with hematologic cancers or other disorders.1 Many of the disadvantages of CBT, including limited numbers of total nucleated cells, have been dealt with in significant ways, leading to marked reductions in the time to hematopoietic cell recovery.2-4 Still unclear, however, are the short- and long-term consequences of immune reconstitution from CB grafts after transplantation. Although the kinetics of T- and B-cell subset recovery after CBT are well-described,5,6 much less is known about the recovery of CB-derived natural killer (NK) cells in the posttransplant setting. This is not surprising, as NK cells have only begun to emerge as one of the most diverse compartments of the human immune repertoire.7-9 Indeed, NK cells express an array of germline-encoded activating and inhibitory receptors that precisely regulate their activation status, leading to a highly varied cell population with marked phenotypic and functional diversity at the single-cell level.8
An improved understanding of NK cell diversity after CBT would not only help clarify the division of labor among NK cell subsets but also may suggest strategies to better exploit CB-derived NK cells in the clinic. This prediction gains impetus in view of recent studies showing improved clinical outcomes in patients with higher NK cell counts and more mature cell phenotypes after hematopoietic stem cell transplantation (HSCT).10-14 Thus, we have used high-dimensional mass cytometry coupled to an unsupervised analytical approach, as well as improved quantitative measures, to analyze the recovering NK cell compartment in patients with high-risk hematologic malignancies who had undergone CBT at this center. Our findings identify cytomegalovirus (CMV) reactivation and interleukin 15 (IL-15) as key drivers of posttransplant NK cell diversity, and demonstrate a close correlation between increased NK cell diversity and a lower risk for relapse. One previously unrecognized subset of NK cells, characterized by a very low diversity index, immature phenotype, and inferior effector function in vitro, was associated with a particularly poor outcome. These insights should help to identify CBT recipients with a higher risk for relapse who may benefit from adjunctive strategies, such as adoptive NK cell therapy or administration of IL-15.
Methods
Study design
The central aim of this study was to provide a comprehensive analysis of the entire spectrum of NK cell subpopulations in CB and peripheral blood (PB) from healthy donors and from patients undergoing CBT for hematologic cancers. In particular, we sought to relate changes within the NK cell compartment and NK cell diversity at the single-cell level. The summary of the different approaches used in this study is included in supplemental Methods.
Sample processing
All analyses were performed at MD Anderson Cancer Center, with approval by the local institutional review board. PB mononuclear cells from healthy adults and CBT recipients and CB mononuclear cells were processed as previously described.15
Mass cytometry antibody conjugation
A panel comprising 40 metal-tagged antibodies was used for the detailed characterization of NK cells (see supplemental Methods for details).
Data processing, diversity analysis
Mass cytometry data were normalized on the basis of EQ 4 element signal shift over time, using Fluidigm normalization software2. Data processing was performed using FlowJo version 10.2. Calibration beads were gated out and singlets chosen based on iridium 193 staining and event length, as described.16 The diversity analysis and markers used in these studies are shown in supplemental Methods.
51Chromium release assay
To assess NK cell cytotoxicity, we cocultured NK cells with 51Cr-labeled K562 targets at multiple E:T ratios (20:1, 10:1, 5:1, 1:1); cytotoxicity was measured by target release of 51Cr, as previously described.17
RNA isolation and RNAseq library generation
Results
NK cell repertoire in CB and PB samples from healthy donors
To assess NK cell diversity after posttransplant engraftment of CB, we first sought to establish baseline measurements for both CB and PB samples from healthy donors. Thus, we used cytometry by time-of-flight and a panel of 40 antibodies (supplemental Table 1) against inhibitory and activating receptors, as well as differentiation, homing, and activation markers, to gain fresh insights into CB-NK cell diversity. In keeping with a previous report,8 we found that CB NK cells (n = 10) had a significantly lower diversity compared with NK cells from adult PB donors (n = 10; median diversity index, 537 [range, 311-891] vs median, 2858 [range, 1228-5630]; P < .0001). Using t-SNE, a t-distributed stochastic neighbor embedding algorithm, we next analyzed and displayed high-dimensional data on 2-dimensional maps.20 This approach yielded considerable segregation between CB and PB-derived NK cells, with a predominantly immature phenotype (increased expression of CD56bright, NKG2A, CD94, c-kit, Trail, CD62L, and CD27) dominating the CB-NK cell compartment. In contrast, PB-NK cells were characterized by a mature phenotypic signature consistent with previous antigen experience (increased expression of CD57, KLRG1, CD16, KIRs, NKG2C, Siglec-7, CD158b, TIGIT, and DNAM-1; Figure 1A). Similarly, transcription factors and other proteins associated with NK cell maturity and function, including T-bet, eomesodermin, perforin, granzyme A (GrA), and granzyme B (GrB), were expressed at higher levels by PB-NK compared with CB-NK cells (Figure 1A).


NK cell repertoire in CB is immature and less heterogeneous than in PB. (A) The manually pregated CD56+ NK cell populations were exported and down-sampled to an equal cell number of 2000 per sample. Individual t-SNE maps show the expression of 33 different NK cell markers. Color scale indicates signal intensity, ranging from low (blue) to high (red) after arcsine transformation. Bar plots under each t-SNE map depict the frequencies of NK cells expressing each marker in 10 CB (blue) vs 10 healthy PB (red) donors. *P ≤ .05; **P ≤ .01; ***P ≤ .001; **** P ≤ .0001. Bars represent median values with interquartile ranges. (B) SPADE analysis identified distinct clusters within CB (left) and PB (right) NK cell compartments. Phenotypically distinct CB and PB NK cell clusters occupy different regions of the SPADE tree. Node size and color scale represent the relative number of cells per node. (C) Cytotoxicity of resting healthy donor PB (red) and CB (blue) NK cells against K562 targets at different effector: target (E:T) ratios, as measured by 51Cr-release assay (n = 10). (D) Bar plots summarize the IFN-γ, TNF-α, and CD107A response to K562 targets by bead-purified PB (red) and CB (blue) NK cells (n = 10). **P ≤ .01; ***P ≤ .001. Bars represent median values with interquartile ranges. (E) Global gene expression analysis by RNA sequencing. Heat map displays 1073 genes that are differentially expressed (adjusted P < .01 with log2 fold change >1) in purified NK cells from CB (3 different donors) vs PB (6 different donors). (F) Volcano plot showing significantly differentiated genes (red dots) between CB and PB. (G) Heat map of differentially expressed genes as described by the indicated gene ontology (GO) terms. (H) Gene coexpression network construction was performed with Pearson’s correlation between the expression profiles of each module. The rows and columns represent each module in different color and number for each network construction. Color bar shows the correlation index. (I) Hub genes from each module of networks were displayed in 2 circles; the blue circle presents the CB, and the red circle represents the PB NK cell network. NS, not significant.
NK cell repertoire in CB is immature and less heterogeneous than in PB. (A) The manually pregated CD56+ NK cell populations were exported and down-sampled to an equal cell number of 2000 per sample. Individual t-SNE maps show the expression of 33 different NK cell markers. Color scale indicates signal intensity, ranging from low (blue) to high (red) after arcsine transformation. Bar plots under each t-SNE map depict the frequencies of NK cells expressing each marker in 10 CB (blue) vs 10 healthy PB (red) donors. *P ≤ .05; **P ≤ .01; ***P ≤ .001; **** P ≤ .0001. Bars represent median values with interquartile ranges. (B) SPADE analysis identified distinct clusters within CB (left) and PB (right) NK cell compartments. Phenotypically distinct CB and PB NK cell clusters occupy different regions of the SPADE tree. Node size and color scale represent the relative number of cells per node. (C) Cytotoxicity of resting healthy donor PB (red) and CB (blue) NK cells against K562 targets at different effector: target (E:T) ratios, as measured by 51Cr-release assay (n = 10). (D) Bar plots summarize the IFN-γ, TNF-α, and CD107A response to K562 targets by bead-purified PB (red) and CB (blue) NK cells (n = 10). **P ≤ .01; ***P ≤ .001. Bars represent median values with interquartile ranges. (E) Global gene expression analysis by RNA sequencing. Heat map displays 1073 genes that are differentially expressed (adjusted P < .01 with log2 fold change >1) in purified NK cells from CB (3 different donors) vs PB (6 different donors). (F) Volcano plot showing significantly differentiated genes (red dots) between CB and PB. (G) Heat map of differentially expressed genes as described by the indicated gene ontology (GO) terms. (H) Gene coexpression network construction was performed with Pearson’s correlation between the expression profiles of each module. The rows and columns represent each module in different color and number for each network construction. Color bar shows the correlation index. (I) Hub genes from each module of networks were displayed in 2 circles; the blue circle presents the CB, and the red circle represents the PB NK cell network. NS, not significant.
To obtain a different perspective on the diversity of CB- and PB-derived NK cell populations, we used SPADE (spanning-tree progression analysis of density-normalized events), an analytical tool designed for single-cell cytometry data analysis and visualization that segregates single cells into clusters and then projects them as nodes into a tree (Figure 1B). The PB-NK cell compartment was characterized by a larger number of nodes and larger node size, reflecting a more heterogeneous composition compared with that of the CB-NK cell compartment. When we divided the spade tree into 2 zones, the dominant zone within the CB NK compartment was NKG2A+, with a paucity of nodes expressing maturation markers such as CD57 or CD16, consistent with their less mature phenotype (Figure 1B). To assess the effect of these phenotypic findings on NK cell function, we tested the response of NK cells selected from CB or PB directly ex vivo without prior activation against K562 targets. PB-NK cells showed greater degranulation (CD107A), produced significantly higher amounts of interferon (IFN)-γ and tumor necrosis factor (TNF)-α, and exerted significantly greater cytotoxicity against K562 targets compared with results for CB-NK cells (Figure 1C-D).
To gain a more comprehensive understanding of NK cellular transcriptome complexity, we performed RNA sequencing in purified NK cells from 3 CB and 6 healthy PB donors. To functionally profile the set of genes that are over- or underexpressed, we performed gene ontology analysis on the differentially expressed genes between CB- and PB-NK cells, using the DAVID functional annotation tool.21 The results revealed very distinct signatures between CB and PB-NK cells (Figure 1E). Similarly, a Volcano plot confirmed unique gene expression profiles for CB- vs PB-NK cells (Figure 1F). Although genes involved in activation and adhesion were enhanced in PB-NK cells, those with functions in the cell cycle and replication were highly enriched in CB NK cells (Figure 1G). To identify possible transcriptional network differences between CB- and PB-derived NK cells, and to define groups of coordinately expressed genes, we next generated 2 coexpression networks using Pearson’s correlation coefficient22,23 (Figure 1H). Within these networks, interconnected modules were identified on the basis of topological overlap24 (supplemental Figure 1). We did not identify common hub genes between CB and PB-NK cells, indicating that each cell category possesses highly distinct transcriptional profiles (Figure 1I). Moreover, when we performed a gene functional annotation analysis (DAVID) to better understand the function of each module, only 2 of 17 modules were shared between CB- and PB-NK cells (supplemental Table 2). Together, these data reveal that PB- and CB-NK cells differ not only in the expression of their individual genes but also in the gene networks that regulate their function.
Factors contributing to the diversity of the reconstituting NK cell repertoire
NK cells are the first lymphoid population to emerge after allogeneic HSCT; however, the early posttransplant dynamics of recovering CB-NK cell diversity remain unclear, largely because earlier studies incorporated only a limited number of phenotypic parameters. Thus, using a 40-parameter NK-focused mass cytometry panel (supplemental Table 1), we analyzed samples that were collected prospectively at multiple points from 43 patients who had undergone CBT at this center. The NK cell diversity index in these patients increased progressively over time (Figure 2A). By 3 months posttransplant, the median diversity of the CB-NK cells had more than doubled and was similar to that of patients undergoing PB HSCT measured at the same point (day 100; median, 2546; range, 1360-3874; n = 3).
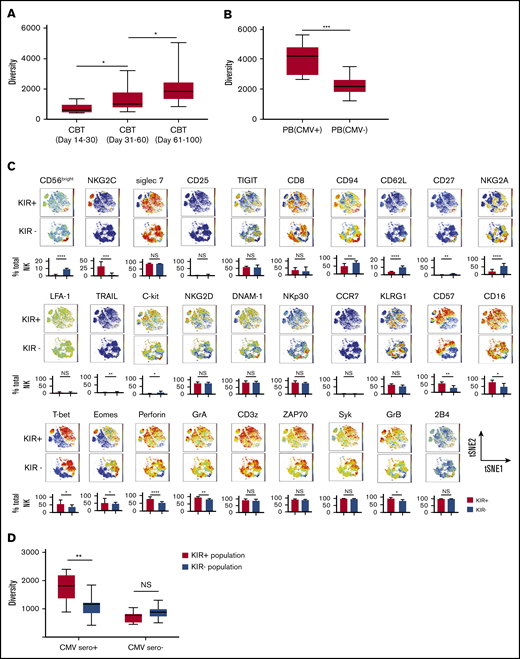
NK cell repertoire diversifies with maturation and after CMV infection. (A) The box graphs show the NK cell repertoire diversity in PB samples collected from CBT recipients in the first 30 days (7 patients; 13 samples), days 31-60 (17 patients; 28 samples) and days 61-100 (19 patients; 25 samples). *P ≤ .05. Boxes represent median with minimum to maximum range. (B) Box graphs comparing the diversity of the NK cell repertoire, measured using the inverse Simpson index, in healthy adult donors who were CMV seropositive (left, n = 10) or CMV seronegative (right, n = 10). ***P ≤ .001. Boxes represent median with minimum to maximum range. Samples from CMV seropositive patients were collected after CMV reactivation. (C) Comparison of the phenotypic complexity of KIR+ and KIR− NK cells from a representative healthy CMV seropositive adult donor using 2-dimensional t-SNE maps. Individual t-SNE maps show the expression of 29 different NK cell markers. Color scale indicates signal intensity, ranging from low (blue) to high (red) after arcsine transformation. Bar plots under each t-SNE map depict the frequencies of NK cells expressing each marker in the KIR+ and KIR− NK cell populations from 10 CMV seropositive adults. *P ≤ .05; **P ≤ .01; ***P ≤ .001; ****P ≤ .0001. Bars represent median with interquartile range. (D) Box graphs comparing the diversity of the NK cell repertoire, measured using the inverse Simpson index, in KIR+ (red, n = 10) vs KIR− NK cells (blue, n = 10) from CMV seropositive or seronegative adult PB donors. **P ≤ .01. Boxes represent median with minimum to maximum range.
NK cell repertoire diversifies with maturation and after CMV infection. (A) The box graphs show the NK cell repertoire diversity in PB samples collected from CBT recipients in the first 30 days (7 patients; 13 samples), days 31-60 (17 patients; 28 samples) and days 61-100 (19 patients; 25 samples). *P ≤ .05. Boxes represent median with minimum to maximum range. (B) Box graphs comparing the diversity of the NK cell repertoire, measured using the inverse Simpson index, in healthy adult donors who were CMV seropositive (left, n = 10) or CMV seronegative (right, n = 10). ***P ≤ .001. Boxes represent median with minimum to maximum range. Samples from CMV seropositive patients were collected after CMV reactivation. (C) Comparison of the phenotypic complexity of KIR+ and KIR− NK cells from a representative healthy CMV seropositive adult donor using 2-dimensional t-SNE maps. Individual t-SNE maps show the expression of 29 different NK cell markers. Color scale indicates signal intensity, ranging from low (blue) to high (red) after arcsine transformation. Bar plots under each t-SNE map depict the frequencies of NK cells expressing each marker in the KIR+ and KIR− NK cell populations from 10 CMV seropositive adults. *P ≤ .05; **P ≤ .01; ***P ≤ .001; ****P ≤ .0001. Bars represent median with interquartile range. (D) Box graphs comparing the diversity of the NK cell repertoire, measured using the inverse Simpson index, in KIR+ (red, n = 10) vs KIR− NK cells (blue, n = 10) from CMV seropositive or seronegative adult PB donors. **P ≤ .01. Boxes represent median with minimum to maximum range.
We next hypothesized that CMV infection, which appears to drive NK cell maturation,25-27 might explain the speed with which the NK cell repertoire acquires diversity after CBT. Indeed, CMV reactivation has been shown to induce upregulation of maturation markers including NKG2C, KIR, and CD57 on the reconstituting NK cells after CBT.28
We first measured NK cell diversity in the PB of healthy adult CMV seropositive and CMV seronegative PB donors and found significantly greater diversity among NK cells from CMV seropositive healthy donors (Figure 2B). CMV reactivation was defined as the number of CMV antigen-positive cells per 1 × 10⁶ leukocytes or by polymerase chain reaction in the first 100 days after CBT. Preemptive therapy was initiated for more than 3 pp65 Ag cells/million white blood cells or CMV DNA copy numbers higher than 137. We further hypothesized that the effect of CMV infection on NK cell maturation and diversity would be most pronounced within the KIR+ compartment, as CMV reactivation stimulates the rapid maturation of NKG2A-KIR+ NK cells.20 To test this idea, we used a serial gating strategy to select and define KIR+ and KIR− populations for each sample (supplemental Figure 2). KIR expressing NK cells in CMV seropositive samples displayed a more mature phenotype, characterized by higher expression of maturation markers such as NKG2C, CD57, CD16, T-bet, perforin, GrA and GrB, and lower expression of CD94, CD62L, and NKG2A compared with results for their KIR− counterparts (Figure 2C), whereas the maturational phenotype did not differ between these 2 populations in healthy CMV seronegative donors (supplemental Figure 3). NK cell diversity was significantly greater within the KIR+ vs the KIR− population in CMV seropositive samples (Figure 2D), but not in the absence of CMV infection (Figure 2D). These results support CMV infection as an important contributor to the maturation and diversification of KIR+ NK cells.
We next tested the influence of CMV reactivation on NK diversity posttransplant. All patients with CMV reactivation after CBT were CMV seropositive before transplant. Notably, the patients with CMV reactivation had significantly higher NK cell diversity indices over the first 100 days after CBT than did those who lacked reactivation (Figure 3A). This relationship was even more pronounced within the KIR+ compartment, whereas neither the KIR+ nor the KIR− NK cell subpopulation showed a change in diversity in patients without CMV reactivation (Figure 3B). Finally, in the cohort with CMV reactivation, KIR+ NK cells expressed increased levels of maturation markers (CD16, CD57), and cytolytic enzymes (GrA, GrB, and perforin), as well as transcription factors and adaptor proteins (Figure 3C), but there were no significant differences in the maturational profiles of KIR+ and KIR− populations among patients without CMV reactivation (supplemental Figure 4). Thus, CMV infection appears to enhance NK cell maturation and diversity during the early posttransplant stages of immune reconstitution, especially among KIR+ NK cells.
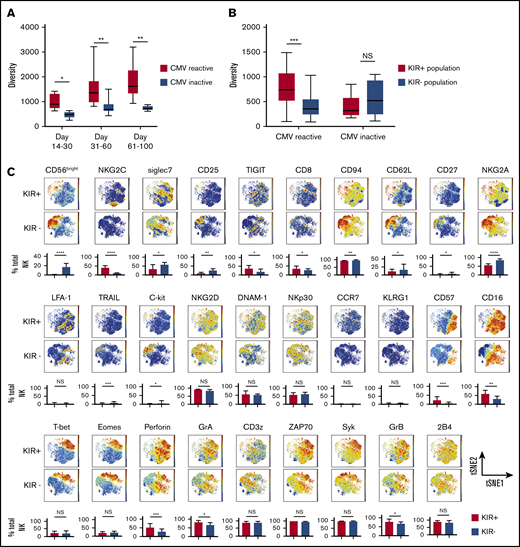
NK cell repertoire diversity increases during NK cell reconstitution after CBT. (A) NK cell repertoire diversity at multiple points after CBT in patients with CMV reactivation during the first 100 days posttransplant (red) compared with results for patients without CMV reactivation (blue). Days 14-30 CMV reactive (n = 8 samples), CMV negative (n = 5 samples); days 31-60 CMV reactive (n = 17 samples), CMV negative (n = 11 samples); days 61-100 CMV reactive (n = 20 samples), CMV negative (n = 5 samples). PB samples from CMV-reactive patients were collected after CMV reactivation. Mann-Whitney U test was used to compare values among the subjects. Boxes represent median with minimum to maximum range. Statistical significance is indicated as *P ≤ .05; **P ≤ .01. (B) Diversity of KIR+ NK cells (red) vs KIR− NK cells (blue) in PB samples collected from CBT recipients with or without CMV reactivation within 100 days post-CBT. Boxes represent median with minimum to maximum range. ***P ≤ .001. (C) The manually pregated CD56+KIR+ and CD56+KIR− NK cell populations from a representative CBT recipient with CMV reactivation in the first 100 days after transplant were exported and down-sampled to an equal cell number of 2000 for each sample. Individual t-SNE maps show the expression of 29 different NK cell markers. Color scales indicate signal intensity, ranging from low (blue) to high (red) after arcsine transformation. Bar plots under each t-SNE map depict the frequencies of NK cells expressing each marker in the KIR+ and KIR− NK cell populations. *P ≤ .05; **P ≤ .01; ***P ≤ .001; ****P ≤ .0001. Bars represent median with interquartile range.
NK cell repertoire diversity increases during NK cell reconstitution after CBT. (A) NK cell repertoire diversity at multiple points after CBT in patients with CMV reactivation during the first 100 days posttransplant (red) compared with results for patients without CMV reactivation (blue). Days 14-30 CMV reactive (n = 8 samples), CMV negative (n = 5 samples); days 31-60 CMV reactive (n = 17 samples), CMV negative (n = 11 samples); days 61-100 CMV reactive (n = 20 samples), CMV negative (n = 5 samples). PB samples from CMV-reactive patients were collected after CMV reactivation. Mann-Whitney U test was used to compare values among the subjects. Boxes represent median with minimum to maximum range. Statistical significance is indicated as *P ≤ .05; **P ≤ .01. (B) Diversity of KIR+ NK cells (red) vs KIR− NK cells (blue) in PB samples collected from CBT recipients with or without CMV reactivation within 100 days post-CBT. Boxes represent median with minimum to maximum range. ***P ≤ .001. (C) The manually pregated CD56+KIR+ and CD56+KIR− NK cell populations from a representative CBT recipient with CMV reactivation in the first 100 days after transplant were exported and down-sampled to an equal cell number of 2000 for each sample. Individual t-SNE maps show the expression of 29 different NK cell markers. Color scales indicate signal intensity, ranging from low (blue) to high (red) after arcsine transformation. Bar plots under each t-SNE map depict the frequencies of NK cells expressing each marker in the KIR+ and KIR− NK cell populations. *P ≤ .05; **P ≤ .01; ***P ≤ .001; ****P ≤ .0001. Bars represent median with interquartile range.
CB-NK cell diversity and link to risk for relapse
We next determined the effect of CB-NK cell diversity on clinical outcome. Because NK cells recover early after CBT (supplemental Figure 5A-B), we measured NK cell diversity in PB samples collected from 43 patients within the first 100 days posttransplant (all patients were in complete remission at the time of sample collection) and correlated the results with the 2-year risk for relapse. Receiver operating characteristic (ROC) analysis identified a diversity of less than 805 as the cutoff predicting best for a higher relapse rate (sensitivity, 0.67; specificity, 0.88; AUC, 0.75; P = .02). In samples collected 100 days after CBT (n = 43), an NK diversity of less than 805 was associated with a significantly higher 2-year cumulative incidence of relapse risk at 60.0% (95% confidence interval [CI], 25.3%-82.7%) compared with 9.6% (95% CI, 2.4%-22.8%) in those with a diversity of at least 805 (Table 1). Although the absolute NK cell count early after CBT has been reported to influence clinical outcome,29 we did not find a statistically significant correlation between this variable and NK cell repertoire diversity (Figure 4A). Thus, of these 2 variables, NK cell diversity appears to be a more specific indicator of NK cell maturational state, as well as a better predictor of relapse risk.
Patient characteristics
| Discovery cohort | Validation cohort | |||
|---|---|---|---|---|
| n | Risk for relapse (95% CI) | n | Risk for relapse (95% CI) | |
| Age, y* | P = .95 | P = .23 | ||
| <40 | 24 | 21.5 (7.8-39.5) | 8 | 9.6 (0.2-28.9) |
| ≥40 | 19 | 24.8 (7.5-47.1) | 17 | 35.9 (14.5-57.0) |
| Diagnosis | P = .02 | P = .12 | ||
| CML/MPD | 9 | 0 | 3 | 0 |
| ALL | 4 | 0 | 3 | 33.3 (0.8-77.4) |
| AML/multidimensional scaling | 23 | 39.5 (19.0-59.5) | 17 | 29.4 (10.7-51.) |
| Lymphoma | 7 | 14.2 (0.7-46.5) | 2 | 0 |
| Remission status (based on minimal residual disease) at CBT | P = .09 | P = .16 | ||
| CR | 26 | 12.8 (3.2-29.3) | 14 | 11.1 (2.8-44.1) |
| Active disease | 17 | 35.9 (14.4-57.0) | 11 | 32.9 (9.0-54.2) |
| Disease risk index | P = .02 | P = .06 | ||
| Low + intermediate | 23 | 10.1 (3.7-27.6) | 9 | 14.2 (3.1-35.8) |
| High + very high | 19 | 39.5 (19.9-55.2) | 14 | 44.6 (18.3-62.1) |
| Conditioning regimen intensity | P = .03 | P = .08 | ||
| Myeloablative | 11 | 21.3 (5.2-41.1) | 7 | 10 (0.5-36.7) |
| Reduced intensity | 27 | 49.7 (32.8-65.6) | 14 | 50.6 (17.1-75.6) |
| Nonmyeloablative | 5 | 77.1 (34.2-93.1) | 4 | 82.3 (31.6-95.5) |
| CB-NKimfrequency† | P = .0003 | P = .001 | ||
| ≥11.8% | 32 | 72.7 (37.1-90.3) | 18 | 85.7 (33.4-97.8) |
| <11.8% | 11 | 4.3 (0.3-18.0) | 7 | 0 (—) |
| NK diversity index‡ | P = .05 | |||
| <805 | 10 | 60.0 (25.3-82.7) | ||
| ≥805 | 33 | 9.6 (2.4-22.8) | ||
| NK absolute count¶ | P = .85 | P = .14 | ||
| Low | 22 | 23.7 (8.6-43.0) | 13 | 9.1 (5.3-33.3) |
| High | 21 | 21.1 (6.5-41.1) | 12 | 48.4 (17.4-74.1) |
Two-year cumulative incidence of relapse according to patient characteristics in the discovery and validation cohorts.
The median age was 38.8 years (range, 20.2-67.9 years) in the learning cohort and 53.6 years (range, 18.4-68.1 years) in the validation cohort.
The median values of CB-NKim for the discovery and validation cohorts were 5.0% (range, 0.3%-41.0%) and 9.1% (range, 0.4%-43.7%), respectively
ROC analysis identified the optimal diversity index cutoff that predicted for the risk for relapse to be 805. The median diversity index was 1317 (range, 421-5050)
The variable was categorized by using the median absolute NK count as a cutoff; namely, 17.3 K/μL (range, 0.2-53.2) and 9.8 K/μL (range, 1.3-62.3) for the discovery and validation samples, respectively. A more predictive cutoff could not be identified using ROC analysis.

NK cell diversity correlates with risk for relapse after CBT. (A) Lack of correlation between the PB-NK cell repertoire diversity and absolute PB-NK cell count (103/μL) in matched samples collected from CBT recipients. Red circles denote patients who relapsed in the first year post-CBT (n = 9), and blue circles those who remained in complete remission (CR; n = 34). The Pearson’s correlation test was used to calculate the correlation coefficient (r) and 2-sided P value. (B) Comparison of the phenotypic complexity of NK cells in PB samples collected in the first 100 days after CBT in patients in CR and those who relapse in the first year posttransplant, using t-SNE-based dimensionality reduction. t-SNE analysis distributed NK cells from patients in CR vs relapse along 2 t-SNE axes based on normalized expression of 32 NK cell markers per single cell. NK cells from patients in CR are on the left side of the map, and relapsed patients on the right side. Inset values indicate the frequency of cells that fall within the CR or relapse gate (top 2 t-SNE maps). The composite t-SNE maps include NK cells from patients who remained in CR (top left blue t-SNE map) vs those who relapsed in the first year posttransplant (top right blue t-SNE map) show normalized expression levels of the indicated markers from a representative individual. Cells were colored according to normalized expression intensity. Color scales indicate signal intensity, ranging from low (blue) to high (red) after arcsine transformation. Bars represent median with interquartile range and summarize the frequencies of expression of each marker of NK cells from patients who remained in CR (blue) and those who relapsed (red). *P ≤ .05; **P ≤ .01; ***P ≤ .001; ****P ≤ .0001.
NK cell diversity correlates with risk for relapse after CBT. (A) Lack of correlation between the PB-NK cell repertoire diversity and absolute PB-NK cell count (103/μL) in matched samples collected from CBT recipients. Red circles denote patients who relapsed in the first year post-CBT (n = 9), and blue circles those who remained in complete remission (CR; n = 34). The Pearson’s correlation test was used to calculate the correlation coefficient (r) and 2-sided P value. (B) Comparison of the phenotypic complexity of NK cells in PB samples collected in the first 100 days after CBT in patients in CR and those who relapse in the first year posttransplant, using t-SNE-based dimensionality reduction. t-SNE analysis distributed NK cells from patients in CR vs relapse along 2 t-SNE axes based on normalized expression of 32 NK cell markers per single cell. NK cells from patients in CR are on the left side of the map, and relapsed patients on the right side. Inset values indicate the frequency of cells that fall within the CR or relapse gate (top 2 t-SNE maps). The composite t-SNE maps include NK cells from patients who remained in CR (top left blue t-SNE map) vs those who relapsed in the first year posttransplant (top right blue t-SNE map) show normalized expression levels of the indicated markers from a representative individual. Cells were colored according to normalized expression intensity. Color scales indicate signal intensity, ranging from low (blue) to high (red) after arcsine transformation. Bars represent median with interquartile range and summarize the frequencies of expression of each marker of NK cells from patients who remained in CR (blue) and those who relapsed (red). *P ≤ .05; **P ≤ .01; ***P ≤ .001; ****P ≤ .0001.
Altered NK cell phenotype in patients with a higher risk for relapse
Ultimately, the clinical utility of CB-NK cell diversity will depend on the identification of phenotypically and functionally defined NK cell subsets that confer an especially high risk for relapse after CBT. Thus, using our large NK-focused mass cytometry panel, we studied 43 patients (discovery cohort), 9 of whom relapsed by 1 year post-CBT at a median time of 155 days (range, 92-253 days). Comparison of the t-SNE plots based on day 100 samples from the 9 patients who relapsed vs the 34 who remained in complete remission revealed strikingly distinct NK cell clusters, indicating major differences in phenotypic profiles (Figure 4B). Day 100 NK cells from patients who remained in remission expressed higher levels of specific maturation markers (NKG2C, CD16, and CD57), transcription factors, and signaling molecules (T-bet, eomesodermin, Syk), as well as markers of functionality (perforin and granzyme; Figure 4B), than did those from patients who relapsed in the first year after CBT. Patients who relapsed in the first year posttransplant had a large population of NK cells with a unique phenotype characterized by higher expression of NKG2A, CD94, and CD62L and low expression of CD16, NKG2C, and CD57. This NK subset also expressed significantly lower levels of cytotoxic molecules and transcription factors (Figure 4B), and its frequency was negatively correlated with increasing NK cell diversity (supplemental Figure 6). The median day 100 frequency of these cells within the total PB NK cell population in the 9 patients who relapsed in the first year post-CBT was 19.3% (range, 10.4%-43.0%) compared with 4.6% (range, 0.2%-22.0%) in the 34 patients who continued in remission (P < .0001; Figure 5A). Our findings are strengthened by the cells’ inability to perform natural cytotoxicity in response to K562 targets and by their decreased production of IFN-γ and TNF-α against K562 targets compared with results for their mature counterparts (Figures 5B; supplemental Figure 5C). Thus, we designated this novel NK cell subset as CB-NKim.

A unique subset of CB-NK cells with a distinct immature phenotype predicts for relapse in the first year post-CBT. (A) Box plots summarizing the distribution of frequencies of the CB-NKim subset in patients who remained in complete remission (CR; blue; n = 34) compared with those who relapsed (red; n = 9). ****P ≤ .0001 (discovery cohort). (B) Cumulative results summarize the IFN-γ and TNF-α responses for the total population of CD56+ NK cells (filled blue circles) and the CB-NKim subset (filled red squares) after coculture with K562 targets for 6 hours. IFN-γ and TNF-α were measured by intracellular flow cytometry after gating on total NK cells vs the CB-NKim subset. P values are calculated by paired Student t test. ****P ≤ .0001. (C) Multidimensional scaling plot constructed on the basis of frequencies of the CB-NKim subset within total NK cell population reveals a distinct segregation between patients who maintained a CR (blue circles; n = 34) and those who relapsed (red circles; n = 9). The distances correspond to differences in the frequencies of the CB-NKim subset. (D) ROC curve analysis indicates the predictive performance (AUC, 0.979) for the CB-NKim subset with a positive percentage cutoff of 11.8% to identify relapsed patients. (E) Box plots summarize the distribution of frequencies of the CB-NKim subset in patients in CR (blue; n = 19) or those who went on to relapse in the first year (red; n = 6). ***P ≤ .001 (validation cohort). (F) Comparison of ROC curve analyses shows the predictive performance of the CB-NKim frequency with a cutoff 11.8% in the discovery (red line; AUC, 0.979) and validation (blue line; AUC, 0.977) cohorts. (G-H) Cumulative incidence of relapse for patients with CB-NKim subset of at least 11.8% (red line) vs less than 11.8% (blue line) in the discovery and validation cohorts, respectively.
A unique subset of CB-NK cells with a distinct immature phenotype predicts for relapse in the first year post-CBT. (A) Box plots summarizing the distribution of frequencies of the CB-NKim subset in patients who remained in complete remission (CR; blue; n = 34) compared with those who relapsed (red; n = 9). ****P ≤ .0001 (discovery cohort). (B) Cumulative results summarize the IFN-γ and TNF-α responses for the total population of CD56+ NK cells (filled blue circles) and the CB-NKim subset (filled red squares) after coculture with K562 targets for 6 hours. IFN-γ and TNF-α were measured by intracellular flow cytometry after gating on total NK cells vs the CB-NKim subset. P values are calculated by paired Student t test. ****P ≤ .0001. (C) Multidimensional scaling plot constructed on the basis of frequencies of the CB-NKim subset within total NK cell population reveals a distinct segregation between patients who maintained a CR (blue circles; n = 34) and those who relapsed (red circles; n = 9). The distances correspond to differences in the frequencies of the CB-NKim subset. (D) ROC curve analysis indicates the predictive performance (AUC, 0.979) for the CB-NKim subset with a positive percentage cutoff of 11.8% to identify relapsed patients. (E) Box plots summarize the distribution of frequencies of the CB-NKim subset in patients in CR (blue; n = 19) or those who went on to relapse in the first year (red; n = 6). ***P ≤ .001 (validation cohort). (F) Comparison of ROC curve analyses shows the predictive performance of the CB-NKim frequency with a cutoff 11.8% in the discovery (red line; AUC, 0.979) and validation (blue line; AUC, 0.977) cohorts. (G-H) Cumulative incidence of relapse for patients with CB-NKim subset of at least 11.8% (red line) vs less than 11.8% (blue line) in the discovery and validation cohorts, respectively.
CB-NKim subset is an independent predictor of relapse
To test the predictive strength of the CB-NKim subset further, we first analyzed the 1-year risk for relapse according to higher or lower frequencies of this subset. Using multidimensional scaling plots in an unsupervised manner to determine similarities and segregation based on frequencies of the CB-NKim subset, we observed that patients who remained in complete remission segregated from those who relapsed within the first year (Figure 5C). ROC analysis identified CB-NKim frequencies of at least 11.8% as the cutoff predicting best for a higher relapse rate (Figure 5D; Table 1). We validated this finding in an independent cohort of 25 CBT recipients (validation cohort), using an abbreviated flow cytometry panel that could be applied in clinical practice (Figure 5E; supplemental Figure 7; supplemental Table 3). On the basis of selected markers from our larger cytometry by time-of-flight analysis, including CD57, NKG2A, CD62L, CD16, NKG2C, perforin, and T-bet, we showed that the CB-NKim subset identified by flow cytometry met the previously defined cutoff frequency of at least 11.8% to identify patients with a higher risk for relapse after CBT (Figure 5F-H). Indeed, the 2-year cumulative incidence of relapse among patients with a CB-NKim frequency of at least 11.8% vs less than 11.8% were 72.7% (95% CI, 37.1%-90.3%) and 4.3% (95% CI, 0.3%-18.0%; P = .0003) in the discovery and 85.7% (95% CI, 33.4%-97.8%) and 0.0% (P = .001) in the validation cohorts, respectively (Figure 5G-H; Table 1).
We performed univariate and multivariate analysis for 2-year risk for relapse posttransplant including the variables shown in Table 1. Multivariate analysis including these variables identified CB-NKim frequency (hazard ratio, 24.4; 95% CI, 4.8-123.5; P < .0001) and disease risk index (hazard ratio, 2.3; 95% CI, 1.16-9.2; P = .01) as the only independent predictors for relapse in the discovery cohort. Multivariate analysis confirmed CB-NKim frequency to be the only predictor for relapse in the validation cohort (hazard ratio, 23.6; 95% CI, 2.4-232.0; P = .007). Thus, we have identified CB-NKim cells as a significant contributor to the relapse of high-risk hematologic malignancies after CBT.
CB-NKim cells in the graft require IL-15 for their maturation
To determine the origin of the CB-NKim cells, as well as factors that could modulate them in the transplant recipient, we measured their frequency in the CB grafts before infusion (n = 10) and in PB from adult healthy donors (n = 10). CB-NKim were present at significantly higher frequencies in CB compared with PB from healthy donors (Figure 6A), indicating that this NK subset is naturally present in CB and transferred to the recipient during transplant. To determine whether CB-NKim cells have immunoregulatory function, we sort-purified these cells based on their expression of 5 surface markers (NKG2A+CD57−CD16−NKG2C−CD62L+) and performed a suppression assay by culturing them at a 5:1 ratio with autologous CB-derived CD4/CD8 T cells, as previously described.30 CB-NKim cells did not suppress T-cell proliferation (supplemental Figure 8A-B). To identify factors that could drive the maturation of CB-NKim cells in vivo, we sort-purified CB-NKim cells based on expression of 5 surface markers (NKG2A+CD57−CD16−NKG2C−CD62L+) vs mature NK cells (CD16+CD62L−) and then stimulated both populations with IL-15 or IL-2 for 7 days in vitro (Figure 6B). IL-15 induced differentiation and maturation of the CB-NKim subset with upregulation of activating receptors, transcription factors, and cytotoxic molecules (Figure 6C; supplemental Figure 9), while enhancing IFN-γ and TNF-α production in response to K562 targets. In contrast, CB-NKim cells cultured in the presence of IL-2 retained their immature function and phenotype (Figure 6B-C). Indeed, the frequency of CB-NKim cells was significantly lower after 7 days of culture with IL-15 compared with IL-2 (Figure 6D). Consistent with these findings, the overall diversity of NK cells increased significantly when the CB-NKim population was cultured in the presence of IL-15, in contrast to only marginal changes after exposure to IL-2 (Figure 6E).
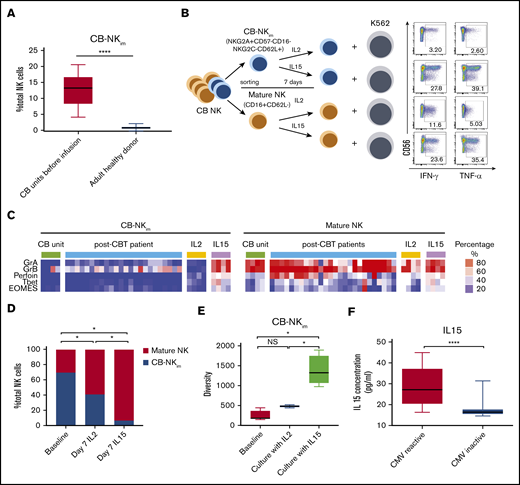
IL-15 drives CB-NKimsubset diversity and functional maturation. (A) Frequency of CB-NKim subset within the total NK cell population in CB units before infusion (left) compared with adult healthy PB donors (right). Boxes represent median with minimum to maximum range. ****P ≤ .0001. (B) Schema of CB NK cell in vitro experiments. CB-NKim (NKG2A+CD57−CD16−NKG2C−CD62L+) and CB-NK mature (CD16+CD62L−) were sort-purified and cultured in the presence of IL-2 (10 units/mL) or IL-15 (20 ng/mL) for 7 days. Representative flow plots show enhanced IFN-γ and TNF-α response to K562 targets by CB-NKim cells and mature CB-NK cells cultured for 7 days in the presence of IL-2 or IL-15. Inset numbers are the percentages of IFN-γ- and TNF-α-positive NK cells within the indicated gated regions. (C) Heat map shows expression of transcription factors and cytotoxicity markers in CB-NKim (NKG2A+CD57−CD16−NKG2C−CD62L+) and CB-NK mature (CD16+CD62L−) before and after culture with IL-2 (10 units/mL) or IL-15 (20 ng/mL) for 7 days and in PB samples collected from patients at day 100 after CBT. Each column represents 1 donor and each row reflects expression of a certain maker for each annotation, highlighting their distinct expression in immature subset and mature subset. Color scale shows the expression level of each marker, with red representing higher expression and blue lower expression. (D) Stacked bar graphs showing the comparison of frequency of CB-NKim subset before stimulation (baseline) or after stimulation with IL-2 (10 units/mL) or IL-15 (20 ng/mL) for 7 days. *P ≤ .01. The y-axis represents the proportion of CB-NKim vs mature NK cells after ex vivo culture of purified CB-NK cells with different cytokines. (E) Box plots showing diversity of CB-NKim subset before stimulation (baseline) or after stimulation with IL-2 (10 units/mL) or IL-15 (20 ng/mL) for 7 days. *P ≤ .01. (F) Box plots showing the IL-15 concentration in plasma samples collected from patients with CMV reactivation post-CBT (n = 19; median, 27.2 pg/ml; range, 16.3-44.9 pg/mL) vs those who did not (n = 24; median, 15.6 pg/mL; range, 13.5-31.9 pg/mL) in the first 100 days after CBT. ****P ≤ .0001.
IL-15 drives CB-NKimsubset diversity and functional maturation. (A) Frequency of CB-NKim subset within the total NK cell population in CB units before infusion (left) compared with adult healthy PB donors (right). Boxes represent median with minimum to maximum range. ****P ≤ .0001. (B) Schema of CB NK cell in vitro experiments. CB-NKim (NKG2A+CD57−CD16−NKG2C−CD62L+) and CB-NK mature (CD16+CD62L−) were sort-purified and cultured in the presence of IL-2 (10 units/mL) or IL-15 (20 ng/mL) for 7 days. Representative flow plots show enhanced IFN-γ and TNF-α response to K562 targets by CB-NKim cells and mature CB-NK cells cultured for 7 days in the presence of IL-2 or IL-15. Inset numbers are the percentages of IFN-γ- and TNF-α-positive NK cells within the indicated gated regions. (C) Heat map shows expression of transcription factors and cytotoxicity markers in CB-NKim (NKG2A+CD57−CD16−NKG2C−CD62L+) and CB-NK mature (CD16+CD62L−) before and after culture with IL-2 (10 units/mL) or IL-15 (20 ng/mL) for 7 days and in PB samples collected from patients at day 100 after CBT. Each column represents 1 donor and each row reflects expression of a certain maker for each annotation, highlighting their distinct expression in immature subset and mature subset. Color scale shows the expression level of each marker, with red representing higher expression and blue lower expression. (D) Stacked bar graphs showing the comparison of frequency of CB-NKim subset before stimulation (baseline) or after stimulation with IL-2 (10 units/mL) or IL-15 (20 ng/mL) for 7 days. *P ≤ .01. The y-axis represents the proportion of CB-NKim vs mature NK cells after ex vivo culture of purified CB-NK cells with different cytokines. (E) Box plots showing diversity of CB-NKim subset before stimulation (baseline) or after stimulation with IL-2 (10 units/mL) or IL-15 (20 ng/mL) for 7 days. *P ≤ .01. (F) Box plots showing the IL-15 concentration in plasma samples collected from patients with CMV reactivation post-CBT (n = 19; median, 27.2 pg/ml; range, 16.3-44.9 pg/mL) vs those who did not (n = 24; median, 15.6 pg/mL; range, 13.5-31.9 pg/mL) in the first 100 days after CBT. ****P ≤ .0001.
Finally, a number of studies have reported higher IL-15 levels in CMV seropositive individuals31 and after CMV reactivation after HSCT.32,33 Thus, we hypothesized that CMV reactivation could drive IL-15 production and consequent maturation of CB-NKim cells after CBT. The day 100 plasma IL-15 levels were significantly higher in patients with CMV reactivation post-CBT compared with those without CMV reactivation (Figure 6F). Together, these data suggest that IL-15 drives NK cell maturation and diversity after CBT and that CMV reactivation may contribute to NK cell maturation by inducing higher levels of IL-15.
Discussion
A number of research groups have shown a link between the kinetics of NK cell reconstitution and disease relapse and survival after HSCT.29,33-35 These and other authors emphasize the prognostic contribution of the recovering absolute NK cell count early after transplantation and34,36,37 the influence of certain combinations of donor and recipient HLA/KIR genotypes,38-40 as well as CMV reactivation in achieving favorable outcomes after HSCT.41 However, the effect of NK cell diversity and of individual NK subpopulations on the antitumor response remains in question. Here, we used mass cytometry together with a number of innovative analytical tools to assess NK cell diversity after CBT. This comprehensive analysis of the entire NK cell repertoire, rather than particular markers or a single-cell population, provided an unbiased approach to understanding the diversity of the NK cell repertoire and its functional consequences during the first year after CBT.
NK cells in healthy CB display substantial phenotypic and functional immaturity, marked by lower expression of KIRs, higher expression of the NKG2A inhibitory receptor, and lower expression of activating receptors.42 This raises an intriguing question: Is the diversity of the donor CB-NK cell repertoire sufficient to protect against early relapse after CBT, or do some functionally deficient subsets persist and dominate the NK cell compartment? Comprehensive analysis of the diversity of CB- and PB-derived NK cells from healthy donors, using a panel of cytometry by time-of-flight analytical platforms, indicated initially low diversity with strikingly immature phenotypes for CB-NK cells, contrasted with a full array of highly diverse and phenotypically mature subsets among PB-NK cells. This segregation of CB-derived from PB-derived NK cells is well supported by the results of RNA sequencing analyses showing distinct gene signatures for CB-NK vs PB-NK cells with few shared hub genes, pointing to the distinct transcriptomic, phenotypic, and functional profiles of these 2 cell populations.
A major outcome of this analysis was the discovery of a previously unrecognized immature CB-NK subset (CB-NKim) that was present at a relatively high frequency in healthy CB and in the first 100 days after CBT in samples from patients relapsing in the first year posttransplant. This subset is different from the previously described NKG2A+CD62L+KIR− population after allogeneic HSCT35 in terms of their origin, their kinetic of maturation, and their functional status. CB-NKim cells do not have characteristics of exhaustion43-46 as they proliferate, diversify, and acquire effector function in response to IL-15 (as shown in Figure 6); they are present at frequencies of around 10% in CB, where we expect the NK cell and T-cell repertoires to be naive, rather than antigen-experienced, and are only rarely found in healthy PB. Moreover, they are characterized phenotypically as CD57−CD16−CD62L+NKG2A+NKG2C−perforin-T-bet− (all markers of immaturity).
Notably, this subset was rare in the 34 patients who remained in remission at 1-year posttransplant. We validated this finding in an independent cohort of 25 CB recipients, using an abbreviated flow cytometry panel that could be applied in clinical practice. Given the negative prognostic strength of the CB-NKim phenotype, we suggest that it be detected as early as possible in the posttransplant course, thus allowing interventions that might restore immune protection as outlined here. Still, rapid reconstitution of the CB-NK cell repertoire within the first 100 days posttransplant in approximately three-quarters of the patients contributed to a relapse rate comparable to that in patients undergoing HSCTs.47
To elucidate the mechanism or mechanisms underlying the effect of CB-NKim cells on disease relapse, we performed a series of studies showing that although these cells can expand in response to IL-2, they fail to undergo phenotypic and functional maturation and retain a low diversity index. In contrast, culturing the cells in the presence of IL-15 induced both functional maturation and diversification. Thus, we propose that in the absence of adequate concentrations of IL-15, CB-NKim cells can expand in the early post-CBT period while failing to mature and attain a functional phenotype. Given that higher IL-15 levels in the early post-CBT period correlate with greater NK cell diversity and lower frequencies of CB-NKim subpopulation (supplemental Figure 6A-C), and that IL-15 is more abundant in the sera of patients with CMV reactivation post-CBT (Figure 6F), we also suggest that CMV contributes to NK cell maturation and diversity at least partly by increasing IL-15 production.
In the present study, analysis of donor CB-NK cell diversity and its effects on the recipient was limited to the first and second years post-CBT, and did not provide information on the long-term effect of this factor on clinical outcome. We would stress, however, that the vast majority of posttransplant relapses occur within the first year.48 Although the relatively small sample size and patient heterogeneity could limit some of the conclusions from our study, it is nonetheless the first to measure NK diversity by high-dimensional single-cell analysis and assess its clinical implications after CBT. Finally, our findings suggest that high-dimensional mass cytometry and innovative analytical platforms may be useful tools in predicting the effect of this variable on treatment outcome and informing the design of future therapeutics, as well as strategies to prevent relapse after CBT.
For data sharing, e-mails can be sent to the corresponding author, Katayoun Rezvani, at krezvani@mdanderson.org.
Acknowledgments
The authors thank Duncan Mak and Jared K. Burks (Department of Leukemia, MD Anderson Cancer Center) for expert advice and technical assistance with mass cytometry analysis.
This work was supported by National Institutes of Health, National Cancer Institute grants (CA061508-21A1 and CA211044-01), the Cancer Prevention and Research Institute of Texas (RP160693), and the MD Anderson Cancer Center Institutional Research Grant Program. The Flow Cytometry and Cellular Imaging Facility is supported in part by the National Institutes of Health, National Cancer Institute through a support grant to MD Anderson Cancer Center (CA016672).
Authorship
Contribution: L.L. performed experiments and interpreted and analyzed data; H.C., D.M., Y.X., and Q.M. analyzed data and commented on the manuscript; J.L., J.J., B.H., and M.K. assisted with experiments; P.P.B., H.S., M.D., R.B., N.I., R.S.M., L.N.K., M.M., G.O., E.G., M.H.S., Y.L., K.C., J.W., W.-L.Z., R.E.C., and E.J.S. provided advice on experiments and commented on the manuscript; K.R. designed and directed the study; and L.L., L.M.-F., and K.R., wrote the manuscript.
Conflict-of-interest disclosure: The authors declare no competing financial interests.
Correspondence: Katayoun Rezvani, Department of Stem Cell Transplantation and Cellular Therapy, The University of Texas MD Anderson Cancer Center, 1515 Holcombe Blvd, Box 423, Houston, TX 77030-4009; e-mail: krezvani@mdanderson.org.

