

Key Points
PD-1 blockade exacerbated GVHD by altering the homeostasis of Tregs and effector T cells after HSCT.
PTCy ameliorated GVHD after PD-1 blockade by restoring the homeostatic balance of T-cell subsets.

Abstract
Graft-versus-host disease (GVHD) after allogeneic hematopoietic stem cell transplantation (allo-HSCT) is a significant cause of morbidity and mortality. Regulatory T cells (Tregs) are critical mediators of immune tolerance after allo-HSCT. Clinical studies have indicated that programmed cell death 1 (PD-1) blockade before allo-HSCT involves a risk of severe GVHD. However, the mechanisms underlying GVHD induction resulting from PD-1 blockade remain unclear. We investigated the impact of PD-1 expression of donor T cells on T-cell reconstitution and GVHD using murine models. We first demonstrated that inhibition of PD-1 signaling induced aggressive expansion of CD4+ conventional T cells; however, Tregs could not maintain expansion because of high susceptibility to apoptosis, resulting in discordant immune recovery and subsequent development of severe GVHD. We then evaluated the impact of posttransplantation cyclophosphamide (PTCy) on abnormal T-cell reconstitution after PD-1 blockade. PTCy efficiently ameliorated GVHD after transplantation from a PD-1−/− donor and extended overall survival by safely regulating the proliferation and apoptosis of T-cell subsets. Notably, in the first 2 weeks after administration of PTCy, Tregs regained their ability to continuously proliferate, resulting in well-balanced reconstitution of donor T-cell subsets. In conclusion, the influence of PD-1 blockade differed within T-cell subsets and caused unbalanced reconstitution of T-cell subsets, resulting in severe GVHD. PTCy successfully restored T-cell homeostasis and ameliorated GVHD induced by PD-1−/− donor T cells. These findings may help explain the pathophysiology behind the observation that PTCy may mitigate the incidence and impact of GVHD associated with prior exposure to PD-1 blockade.
Introduction
Programmed cell death 1 (PD-1) is a coinhibitory receptor expressed on hematopoietic and nonhematopoietic cells. PD-1 attenuates T-cell activation by engaging its ligands, PD-L1 and PD-L2.1,2 PD-L1 overexpression in tumor cells inhibits the antitumor activity of effector T cells, whereas PD-1 blockade induces preferential stimulation of antitumor effector T cells and mediates antitumor activity.3 Clinical studies have demonstrated that PD-1 blockade is effective against various cancers, including hematological malignancies.4-6
Patients with hematological malignancies who respond to PD-1 blockade are candidates for allogeneic hematopoietic stem cell transplantation (allo-HSCT), because most patients experience disease recurrence after transient disease control by PD-1 blockade.7,8 In allo-HSCT, PD-1 blockade of donor T cells was found to be associated with lethal graft-versus-host disease (GVHD) in experimental murine models,9,10 and retrospective clinical data have indicated that PD-1 blockade before allo-HSCT can increase the risk for severe acute GVHD.11-13
Posttransplantation cyclophosphamide (PTCy) is a novel GVHD prophylactic strategy for acute GVHD after allo-HSCT from HLA-haploidentical donors.14-17 Retrospective studies have demonstrated that HLA-haploidentical transplantation with PTCy results in similar survival, disease recurrence, and transplantation-related mortality and lower chronic GVHD compared with HLA-identical transplantation with conventional GVHD prophylaxis.16-18 For patients with Hodgkin lymphoma, HLA-haploidentical transplantation with PTCy reduced the incidence of relapse to a greater extent than in HLA-identical transplantation.19,20 Furthermore, as in HLA-haploidentical transplantation, PTCy has been reported as an effective single GVHD prophylactic agent for HLA-identical transplantations.21-23 The mechanism underlying the effect of PTCy on GVHD involves selective depletion of alloreactive proliferative effector T cells14,24-26 and enhancement of the recovery of donor regulatory T cells (Tregs) that are resistant to PTCy because of aldehyde dehydrogenase expression.27 Theoretically, PTCy is an attractive GVHD prophylaxis for patients undergoing PD-1 blockade before allo-HSCT, because PD-1 blockade may induce aggressive proliferation by effector T cells, enhancing the susceptibility of these cells to cytotoxic agents, such as Cy. In fact, recent clinical studies indicated that PTCy may be an effective GVHD prophylaxis for patients receiving PD-1 blockade therapy.28,29 A retrospective clinical study showed that checkpoint inhibitor treatment before allo-HSCT followed by PTCy was not associated with an increase in acute GVHD. Remarkably, no patients developed grade 3 to 4 acute GVHD with PTCy prophylaxis, suggesting that this procedure may be an appropriate approach for preventing lethal alloreactions after pretransplantation PD-1 blockade.27,28 However, the mechanisms of PTCy against GVHD after PD-1 blockade are largely unknown.
Tregs are a functionally distinct subset of mature T cells with broad immune suppressive activity.30-32 The number of Tregs is a crucial determinant of the regulatory burden on the immune system.33 Moreover, an appropriate balance between Tregs and effector T cells is critical for peripheral tolerance.34,35 Tregs constitutively express high levels of high-affinity interleukin-2 (IL-2) receptors; therefore, IL-2 plays an important role in Treg homeostasis.34,36,37 We previously reported that altered Treg homeostasis in prolonged lymphopenia may result in the development of chronic GVHD, and this effect can be reversed by administering low-dose IL-2.38,39 Importantly, analyses of clinical samples showed that Tregs selectively elevated PD-1 expression during IL-2 administration.40 Our previous murine study suggested that PD-1 acts as a critical homeostatic regulator of Tregs by modulating proliferation and apoptosis during IL-2 therapy.41 PD-1–deficient Tregs underwent rapid expansion soon after IL-2 induction, but thereafter, Tregs became proapoptotic. As a result, the Treg population returned to baseline levels despite continuous IL-2 administration. The fragility of PD-1–deficient Tregs has also been reported in an autoimmune pancreatitis model,42 indicating that PD-1 plays an essential role in Treg homeostasis.
In contrast to the chronic phase after allo-HSCT, data are lacking regarding the impact of PD-1 expression in donor T cells on the early-phase reconstitution of T-cell subsets, including Treg homeostasis. To clarify the mechanisms underlying severe acute GVHD caused by PD-1 blockade and its resolution, we assessed the effect of PD-1 expression of donor T cells on the reconstitution of T-cell subsets after allo-HSCT, as well as the effect of PTCy after PD-1 blockade, using murine HSCT models.
Methods
Mice
Female C57BL/6 (CD45.2, H2Kb/b, B6), B6D2F1 (CD45.2, H2Kb/d, BDF1), and BALB/c (CD45.2, H2Kd/d) mice were purchased from SLR Japan (Tokyo, Japan). Female CD45.1 B6 (CD45.1, H2Kb/b, Ly 5.1 B6) mice as well as PD-1–deficient mice with a B6 background (CD45.2, H2Kb/b, PD-1−/−) were purchased from the RIKEN BioResource Center (Tsukuba, Japan). All mice were maintained under specific pathogen-free conditions and used at ages of 8 to 12 weeks. All animal experiments were performed according to the regulations of the Animal Care and Use Committee, Okayama University Advanced Science Research Center.
Transplantation procedure
On day 0, female BDF1 mice were conditioned by lethal irradiation with 2 doses of 4 to 6 Gy each 6 hours apart. Recipient mice were injected with splenocytes (SPs) and T cell–depleted bone marrow (TCD-BM) from donor mice on day 0. T-cell depletion from donor BM cells was conducted using anti-CD90 MicroBeads and an AutoMACS system (Miltenyi Biotec, Bergisch Gladbach, Germany) according to the manufacturer’s instructions. Depletion of CD25+ cells was performed using PE-conjugated anti-CD25 monoclonal antibodies (mAbs) and MicroBeads (Miltenyi Biotec). Whole SPs harvested from donor mice were labeled with CD25-PE and anti-PE MicroBeads, and CD25− cells were negatively purified by magnetic separation using the AutoMACS system. The purity of the CD25− CD4+ T-cell fractions was >95%.
Assessment of GVHD
Survival after HSCT was monitored daily, and the degree of clinical GVHD was assessed from days 3 to 7, and later weekly, using a scoring system including 5 clinical parameters: weight loss, posture, activity, fur texture, and skin integrity (maximum index, 10), as described previously.43
Flow cytometry for murine experiments
Single-cell suspensions were first incubated with the following directly conjugated mAbs (obtained from eBioscience, San Diego, CA, unless otherwise stated) for 20 minutes at 4°C: eFluor450- or Brilliant Violet 510–conjugated anti-CD4 (eFluor450, GK 1.5; Brilliant Violet 510, GK 1.5; Biolegend, San Diego, CA); eFluor450-, PerCP-, or APC-eFluor450–conjugated CD8 (53-6.7); fluorescein isothiocyanate–conjugated anti-CD62L (MEL14); FITC-conjugated H2Kd (SF1-1.1); PE-conjugated anti–PD-1 (RMP1-30), annexin V, and Ki-67 (SolA15); PE-Cy7–conjugated anti-CD25 (PC61.5); and APC-eFluor780–conjugated anti-CD44 (IM7) and CD45.2 (104). Cells were processed for intracellular staining using a Foxp3 staining buffer set (eBioscience). The cells were incubated with APC-conjugated anti-Foxp3 (FJK-16S) for 30 minutes at 4°C. Samples were analyzed using a MAQSQuant flow cytometer (Miltenyi Biotec), and data were analyzed using FlowJo software (TreeStar, Ashland, OR).
Enzyme-linked immunosorbent assay
Serum was collected from the mice for days 3 after HSCT, and serum samples were assayed for interferon-γ via sandwich enzyme-linked immunosorbent assay using commercially available kits (R&D Systems, Minneapolis, MN).
In vivo proliferation assay
SPs were harvested from donor mice and labeled with CellTrace Violet (Thermo Fisher Scientific, Waltham, MA) according to the manufacturer’s protocol. SPs were transfused into recipient mice and harvested at 3 days posttransfusion. T-cell proliferation in the spleens was analyzed using a MAQSQuant flow cytometer.
Histopathology
Skin, liver, and colon specimens from the recipients were fixed in 10% formalin, embedded in paraffin wax, sectioned, mounted on slides, and stained with hematoxylin and eosin. Images were captured using a KEYENCE BZ-8100 fluorescence microscope (Keyence, Osaka, Japan).
Administration of PD-1 mAb
PD-1 mAb (clone 4H2) was received from Ono Pharmaceutical (Osaka, Japan). Mouse immunoglobulin G1 (IgG1) isotype control was used as a control. PD-1 mAb and mouse IgG (600 µg) were administered intraperitoneally during the peritransplantation period (twice weekly from day −5 through day +20) or during the pretransplantation period (on days −5 and −1).
PTCy
Cy (50 mg/kg; Sigma-Aldrich, St. Louis, MO) was administered intraperitoneally on day 3 after HSCT.
Statistical analysis
The results are presented as the mean ± standard error of the mean. The Mann-Whitney U test and Student t test were used to assess statistical significance between the 2 groups, and 1-way analysis of variance was used to compare >2 groups. The Kaplan-Meier product limit method was used to determine survival probability, and the log-rank test was applied to compare survival curves. Statistical significance was set to P < .05, and all tests were 2 tailed. GraphPad Prism 7 software (GraphPad, La Jolla, CA) was used for analysis.
Results
PD-1−/− graft resulted in lethal GVHD and significantly inferior survival than PD-1+/+ graft
First, we developed an HSCT model to compare survival and GVHD scores of recipients of transplants from PD-1+/+ donors with those from PD-1−/− donors after HSCT. Lethally irradiated BDF1 mice received transplants of 10 × 106 SPs from PD-1+/+ or PD-1−/− B6 mice and 5 × 10⁶ TCD-BM cells from PD-1+/+ B6 mice. As a control, syngeneic transplantation (BDF1→BDF1) was performed (Figure 1A). Compared with the syngeneic group, the allogeneic PD-1+/+ group showed significantly inferior survival after HSCT. Furthermore, the allogeneic PD-1−/− graft group showed a markedly lower rate of survival than the allogeneic PD-1+/+ group (Figure 1B). The GVHD score was also significantly higher in the PD-1−/− group than in the PD-1+/+ group on day 7 after HSCT (Figure 1C). On day 3 after HSCT, the serum levels of interferon-γ were significantly elevated and the serum level of tumor necrosis factor-α was relatively higher in the PD-1−/− group than in the PD-1+/+ group (Figure 1D; supplemental Figure 1).
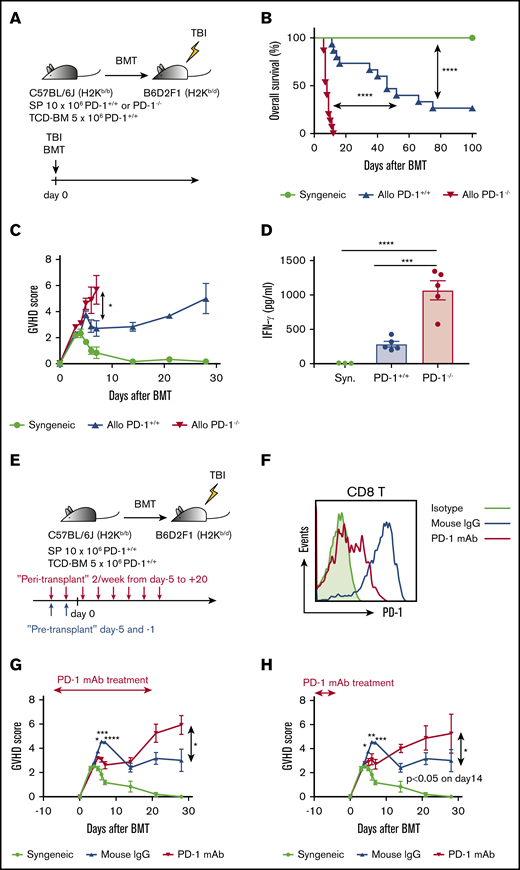
PD-1−/− graft and PD-1 blockade of donor T cells exacerbated GVHD, and PD-1−/− graft demonstrated inferior overall survival after HSCT. (A) Lethally irradiated BDF1 recipients received transplants of 10 × 106 PD-1+/+ B6 or PD-1−/− B6 SPs with 5 × 10⁶ B6 TCD-BM cells (allogeneic group). The syngeneic group was administered the same amounts of SPs and TCD-BM cells from BDF1 mice (n = 15 per group). All animals were monitored daily for survival, and GVHD scores were estimated from days 3 to 7 and once a week from day 14. (B) Kaplan-Meier survival curve of recipient mice (syngeneic vs PD-1+/+, P < .0001; syngeneic vs PD-1+/+, P < .0001; PD-1+/+ vs PD-1−/−, P < .0001). Data from 3 same experiments were combined. (C) Mean GVHD scores of recipient mice (PD-1+/+ vs PD-1−/− on day 7, P < .05). Data are representative of 3 independent experiments. (D) Serum levels of interferon-γ (IFN-γ) on day 3 after HSCT (syngeneic vs PD-1−/−, P < .001; PD-1+/+ vs PD-1−/−, P < .0001). (E) Lethally irradiated BDF1 recipients received transplants of 10 × 106 PD-1+/+ B6 SPs and 5 × 10⁶ B6 TCD-BM cells (allogeneic group). The syngeneic group was administered the same amounts of SPs and TCD-BM cells from BDF1 mice (n = 5 per group). Recipient mice were injected with 600 µg of PD-1 mAb per mouse or isotype mouse IgG intraperitoneally twice weekly from day +5 to +20 after HSCT. All animals were monitored daily for survival, and GVHD scores were estimated from days 3 to 7 and once a week from day 14. (F) Representative flow cytometric histograms detecting PD-1 expression of donor CD8 T cells on day 7 after transplantation. (G) Mean GVHD scores of recipient mice treated during peritransplantation period (mouse IgG vs PD-1 mAb on day 5, P < .05; day 6, P < .001; day 7, P < .0001; and day 28, P < .05). (H) Mean GVHD scores of recipient mice treated before transplantation (mouse IgG vs PD-1 mAb on day 5, P < .05; day 6, P < .01; day 7, P < .001; and day 14, P < .05). Clinical scores are shown as the mean ± standard error of the mean. *P < .05, **P < .01, ***P < .001, and ****P < .0001. BMT, BM transplantation; TBI, total-body irradiation.
PD-1−/− graft and PD-1 blockade of donor T cells exacerbated GVHD, and PD-1−/− graft demonstrated inferior overall survival after HSCT. (A) Lethally irradiated BDF1 recipients received transplants of 10 × 106 PD-1+/+ B6 or PD-1−/− B6 SPs with 5 × 10⁶ B6 TCD-BM cells (allogeneic group). The syngeneic group was administered the same amounts of SPs and TCD-BM cells from BDF1 mice (n = 15 per group). All animals were monitored daily for survival, and GVHD scores were estimated from days 3 to 7 and once a week from day 14. (B) Kaplan-Meier survival curve of recipient mice (syngeneic vs PD-1+/+, P < .0001; syngeneic vs PD-1+/+, P < .0001; PD-1+/+ vs PD-1−/−, P < .0001). Data from 3 same experiments were combined. (C) Mean GVHD scores of recipient mice (PD-1+/+ vs PD-1−/− on day 7, P < .05). Data are representative of 3 independent experiments. (D) Serum levels of interferon-γ (IFN-γ) on day 3 after HSCT (syngeneic vs PD-1−/−, P < .001; PD-1+/+ vs PD-1−/−, P < .0001). (E) Lethally irradiated BDF1 recipients received transplants of 10 × 106 PD-1+/+ B6 SPs and 5 × 10⁶ B6 TCD-BM cells (allogeneic group). The syngeneic group was administered the same amounts of SPs and TCD-BM cells from BDF1 mice (n = 5 per group). Recipient mice were injected with 600 µg of PD-1 mAb per mouse or isotype mouse IgG intraperitoneally twice weekly from day +5 to +20 after HSCT. All animals were monitored daily for survival, and GVHD scores were estimated from days 3 to 7 and once a week from day 14. (F) Representative flow cytometric histograms detecting PD-1 expression of donor CD8 T cells on day 7 after transplantation. (G) Mean GVHD scores of recipient mice treated during peritransplantation period (mouse IgG vs PD-1 mAb on day 5, P < .05; day 6, P < .001; day 7, P < .0001; and day 28, P < .05). (H) Mean GVHD scores of recipient mice treated before transplantation (mouse IgG vs PD-1 mAb on day 5, P < .05; day 6, P < .01; day 7, P < .001; and day 14, P < .05). Clinical scores are shown as the mean ± standard error of the mean. *P < .05, **P < .01, ***P < .001, and ****P < .0001. BMT, BM transplantation; TBI, total-body irradiation.
Next, to evaluate the effect of PD-1 mAb on posttransplantation outcomes, we treated recipient mice with PD-1 mAb or isotype mouse control IgG twice weekly during the peritransplantation and pretransplantation periods (Figure 1E). First, we determined the dose of PD-1 mAb needed to affect posttransplantation GVHD in the current BMT model. We treated recipient mice with control vehicle or 200, 600, or 1,800 μg of PD-1 mAb intraperitoneally on days −5 and −1 before transplantation and compared the GVHD scores among the 4 groups. Mice administered 600 and 1,800 μg of PD-1 mAb showed significantly higher GVHD scores than those in the control group, and no difference was observed between the 600- and 1,800-μg PD-1 mAb groups (supplemental Figure 2A). Therefore, we defined 600 μg per mouse as an appropriate PD-1 mAb dose to effect a sufficient alloimmune reaction. Next, to determine the optimal duration of the last administration of PD-1 mAb and BMT, we treated recipient mice at different timings before transplantation (3 weeks, 1 week, and immediately before transplantation). Recipients administered PD-1 mAb immediately before transplantation showed high GVHD scores, whereas those treated with PD-1 mAb until 3 weeks and 1 week before transplantation showed similar GVHD scores compared with the control group (supplemental Figure 2B). Therefore, we treated the recipients with 600 μg of PD-1 mAb per mouse immediately before (days −5 and −1) transplantation in the pretransplantation PD-1 mAb experiments. PD-1 expression of the donor T cells was decreased after PD-1 mAb infusion (Figure 1F). On day 28 after HSCT, a significant difference was observed in clinical GVHD scores between the PD-1 mAb and control groups (Figure 1G). PD-1 mAb treatment only before transplantation also resulted in GVHD scores comparable to those in peritransplantation mAb treatment (Figure 1H).
These results indicate that the PD-1−/− graft and anti–PD-1 mAbs exacerbated GVHD. Thus, this HSCT model was appropriate for assessing the mechanisms underlying GVHD induced by PD-1 blockade.
PD-1−/− graft developed severe tissue damage in GVHD target organs
Next, we evaluated tissue damage in GVHD target organs. Sublethally irradiated BDF1 mice received transplants of 5 × 10⁶ SPs from either PD-1+/+ or PD-1−/− B6 mice together with 5 × 10⁶ TCD-BM cells from Ly 5.1 B6 mice. The recipient mice were anesthetized and euthanized on day 14, and the GVHD target organs, including the skin, liver, colon, and thymus, were harvested (Figure 2A). Histological examination revealed greater lymphocyte infiltration in GVHD target organs of the PD-1−/− group. Pathological scores were significantly higher in recipient mice in the PD-1−/− group than in the PD-1+/+ group (Figure 2B-C). Additionally, the thymuses of recipient mice in the PD-1−/− group displayed severe morphological changes, including decreased thymus size and a lack of demarcation between the cortex and medulla, which is typical of thymic GVHD46 (Figure 2D). CD4+ CD8+ DP cells were markedly depleted in the PD-1−/− group, and a significant difference was observed between the PD-1+/+ and PD-1−/− groups (Figure 2D). Chimerism analysis via flow cytometry revealed that graft-derived CD4+ conventional T cells (Tcons) and CD8 T cells were more evident in the thymuses of recipient mice in the PD-1−/− group (Figure 2E). Depletion of DP cells and histological abnormalities were not observed in the syngeneic model (supplemental Figure 3A). On day 28 after HSCT, the number of circulating T cells in the peripheral blood was significantly lower in the PD-1−/− group than in the PD-1+/+ group (supplemental Figure 3B). These results indicate that the PD-1−/− graft induced tissue damage in GVHD target organs, particularly in the thymus.
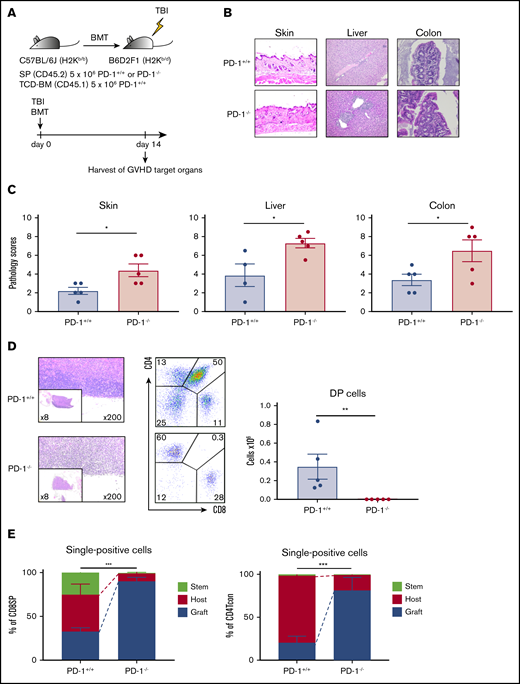
PD-1−/− graft-induced GVHD in target organs, especially in the thymus. (A) Sublethally irradiated BDF1 recipient mice received transplants of 5 × 10⁶ PD-1+/+ B6 or PD-1−/− B6 SPs and 5 × 10⁶ Ly 5.1 B6 TCD-BM cells (n = 5 per group). Recipient mice were euthanized on day 14 after HSCT, and the skin, liver, colon, and thymus were harvested. (B) Representative images of the skin, liver, and colon from recipient mice with hematoxylin and eosin (H&E) staining are shown (magnification, ×200 for skin and liver, ×400 for colon). (C) Pathological scores for the skin, liver, and colon on day 14 after HSCT are shown (PD-1+/+ vs PD-1−/−, P < .05). (D) Representative images of thymuses with H&E staining, lymphocyte gate of thymuses, and absolute number of double-positive (DP) cells in thymuses (PD-1+/+ vs PD-1−/−, P < .01). (E) Chimerism analysis of CD8 or CD4 single-positive conventional T cells (PD-1+/+ vs PD-1−/−, P < .001). Green, red, and blue indicate donor stem cell–, host-, and donor graft–derived cells, respectively. (D-E) Data are representative of 2 independent experiments. Data are shown as the mean ± standard error of the mean. *P < .05, **P < .01, ***P < .001.
PD-1−/− graft-induced GVHD in target organs, especially in the thymus. (A) Sublethally irradiated BDF1 recipient mice received transplants of 5 × 10⁶ PD-1+/+ B6 or PD-1−/− B6 SPs and 5 × 10⁶ Ly 5.1 B6 TCD-BM cells (n = 5 per group). Recipient mice were euthanized on day 14 after HSCT, and the skin, liver, colon, and thymus were harvested. (B) Representative images of the skin, liver, and colon from recipient mice with hematoxylin and eosin (H&E) staining are shown (magnification, ×200 for skin and liver, ×400 for colon). (C) Pathological scores for the skin, liver, and colon on day 14 after HSCT are shown (PD-1+/+ vs PD-1−/−, P < .05). (D) Representative images of thymuses with H&E staining, lymphocyte gate of thymuses, and absolute number of double-positive (DP) cells in thymuses (PD-1+/+ vs PD-1−/−, P < .01). (E) Chimerism analysis of CD8 or CD4 single-positive conventional T cells (PD-1+/+ vs PD-1−/−, P < .001). Green, red, and blue indicate donor stem cell–, host-, and donor graft–derived cells, respectively. (D-E) Data are representative of 2 independent experiments. Data are shown as the mean ± standard error of the mean. *P < .05, **P < .01, ***P < .001.
Effector T cells from PD-1−/− donors showed markedly high-level proliferation soon after HSCT
To explore the mechanisms underlying severe acute GVHD induced by the PD-1−/− graft, we assessed the reconstitution of T-cell subsets after HSCT via flow cytometry. Before evaluation in an allogeneic setting, we analyzed the SPs of 10-week-old PD-1+/+ and PD-1−/− B6 mice in a transplantation-naive setting. The Treg population was significantly higher in PD-1−/− B6 mice than in PD-1+/+ B6 mice (supplemental Figure 4A). Expression of Ki-67 in CD8 T cells, CD4 Tcons, and Tregs did not differ between PD-1+/+ and PD-1−/− B6 mice (supplemental Figure 4B). Annexin V expression in each T-cell subset was significantly higher in PD-1−/− B6 mice than in PD-1+/+ B6 mice (supplemental Figure 4B). Next, irradiated BDF1 mice administered 10 × 106 SPs from either PD-1+/+ B6 or PD-1−/− B6 were euthanized on day 3 for analysis. Ki-67 expression and in vivo cell division of donor graft–derived T cells were analyzed by flow cytometry (Figure 3A). PD-1−/− donor graft–derived CD8 T cells and CD4 Tcons showed significantly higher Ki-67 expression, and PD-1−/− graft–derived CD8 T cells had a significantly higher population of divided cells than those in the PD-1+/+ group. Tregs showed high Ki-67 expression and a high frequency of cell division in both the PD-1+/+ and PD-1−/− groups (Figure 3B-C). These results suggest that effector T cells from the PD-1−/− graft have high proliferation capacity and that enhanced expansion of effector T cells triggers lethal GVHD.
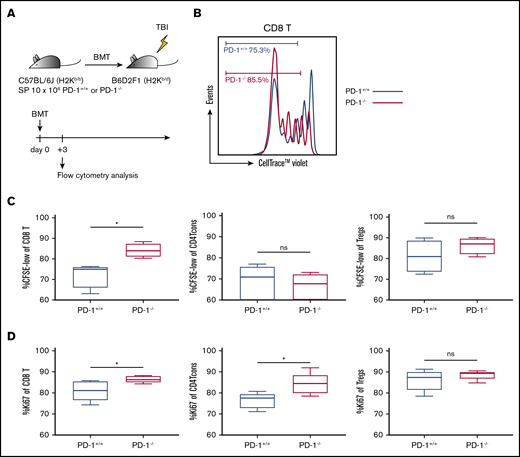
PD-1−/− donor graft–derived effector T cells exhibited high proliferative capacity. (A) Lethally irradiated BDF1 recipients received transplants of 10 × 106 PD-1+/+ B6 or PD-1−/− B6 SPs (n = 5 per group). All animals were euthanized, and spleen cells were harvested on day 3. (B) Representative image of cell division of graft-derived CD8 T cells and the population of graft-derived T cells. (C) Percentage of proliferated graft-derived T cells (divided ≥2) (CD8 T cells, PD-1+/+ vs PD-1−/−, P < .05). (D) Ki-67 expression of graft-derived T cells (CD8 T, PD-1+/+ vs PD-1−/−, P < .05; CD4 Tcons, PD-1+/+ vs PD-1−/−, P < .05). Data are expressed as the mean ± standard error of the mean. *P < .05. CFSE, carboxyfluorescein diacetate succinimidyl ester; ns, not significant.
PD-1−/− donor graft–derived effector T cells exhibited high proliferative capacity. (A) Lethally irradiated BDF1 recipients received transplants of 10 × 106 PD-1+/+ B6 or PD-1−/− B6 SPs (n = 5 per group). All animals were euthanized, and spleen cells were harvested on day 3. (B) Representative image of cell division of graft-derived CD8 T cells and the population of graft-derived T cells. (C) Percentage of proliferated graft-derived T cells (divided ≥2) (CD8 T cells, PD-1+/+ vs PD-1−/−, P < .05). (D) Ki-67 expression of graft-derived T cells (CD8 T, PD-1+/+ vs PD-1−/−, P < .05; CD4 Tcons, PD-1+/+ vs PD-1−/−, P < .05). Data are expressed as the mean ± standard error of the mean. *P < .05. CFSE, carboxyfluorescein diacetate succinimidyl ester; ns, not significant.
PD-1−/− donor Tregs increased proliferation transiently but could not maintain expansion because of high susceptibility to apoptosis
To explore homeostasis during the first 2 weeks after HSCT, sublethally irradiated BDF1 mice received transplants of 5 × 10⁶ SPs from either PD-1+/+ or PD-1−/− B6 SPs, together with 5 × 10⁶ TCD-BM cells from Ly5.1 B6 mice (Figure 4A). Recipient mice were euthanized, and SPs were harvested and analyzed on days 3, 7, and 14 after HSCT. Donor graft–derived T cells were defined as H2kd−/CD45.2+ gated cells (Figure 4B).
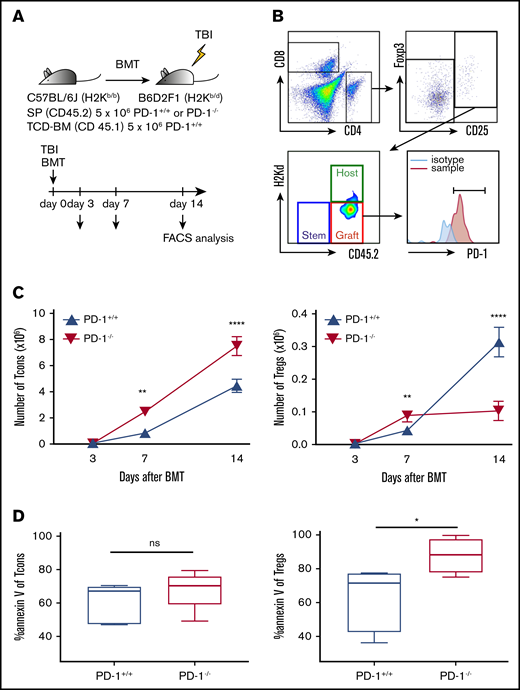
PD-1 inhibition promoted CD4 Tcon expansion and suppressed recovery of Tregs. (A) Sublethally irradiated BDF1 recipient mice received transplants of 5 × 10⁶ PD-1+/+ B6 or PD-1−/− B6 SPs and 5 × 10⁶ Ly 5.1 B6 TCD-BM cells (n = 5 per group). Recipient mice were euthanized on days 3, 7, and 14 after HSCT, and spleens were harvested. (B) Representative lymphocyte gates of the spleen for identification of CD4 and CD8 T-cell subsets and chimerism. (C) Numbers of donor spleen–derived CD4 Tcons and donor spleen–derived Tregs after HSCT (CD4 Tcons, PD-1+/+ vs PD-1−/−, P < .01 on day 7, P < .0001 on day 14; Tregs, PD-1+/+ vs PD-1−/−, P < .01 on day 7, P < .0001 on day 14). (D) Annexin V expression of spleen-derived T cells on day 14 after HSCT. Data are shown as the mean ± standard error of the mean. *P < .05, **P < .01, ****P < .0001. FACS, fluorescence-activated cell sorting.
PD-1 inhibition promoted CD4 Tcon expansion and suppressed recovery of Tregs. (A) Sublethally irradiated BDF1 recipient mice received transplants of 5 × 10⁶ PD-1+/+ B6 or PD-1−/− B6 SPs and 5 × 10⁶ Ly 5.1 B6 TCD-BM cells (n = 5 per group). Recipient mice were euthanized on days 3, 7, and 14 after HSCT, and spleens were harvested. (B) Representative lymphocyte gates of the spleen for identification of CD4 and CD8 T-cell subsets and chimerism. (C) Numbers of donor spleen–derived CD4 Tcons and donor spleen–derived Tregs after HSCT (CD4 Tcons, PD-1+/+ vs PD-1−/−, P < .01 on day 7, P < .0001 on day 14; Tregs, PD-1+/+ vs PD-1−/−, P < .01 on day 7, P < .0001 on day 14). (D) Annexin V expression of spleen-derived T cells on day 14 after HSCT. Data are shown as the mean ± standard error of the mean. *P < .05, **P < .01, ****P < .0001. FACS, fluorescence-activated cell sorting.
First, we evaluated PD-1 expression in donor T cells after HSCT. In the PD-1+/+ group, both Tregs and CD4 Tcons displayed increased PD-1 expression during the days after HSCT. PD-1−/− donor T cells did not express PD-1 (supplemental Figure 5).
PD-1−/− CD4 Tcons rapidly increased, and their numbers were significantly higher than those of PD-1+/+ CD4 Tcons during the first 2 weeks after HSCT (Figure 4C).
With regard to Tregs, PD-1−/− Tregs rapidly proliferated in the first week, and their numbers were significantly higher than those of PD-1+/+ Tregs on day 7; however, PD-1−/− Treg expansion was not sustained, and the number of Tregs in the PD-1−/− group was significantly lower than that in the PD-1+/+ group on day 14 (Figure 4C). We next analyzed annexin V expression of donor T cells on day 14. The expression level of annexin V of CD4 Tcons was comparable between the PD-1+/+ and PD-1−/− groups (Figure 4D). In contrast, PD-1−/− Tregs showed significantly higher annexin V expression than PD-1+/+ Tregs on day 14 after HSCT (Figure 4D), suggesting that PD-1−/− Tregs are more susceptible to apoptosis compared with PD-1+/+ Tregs.
PTCy ameliorated clinical GVHD after HSCT from allogeneic PD-1−/− donors
Effector T cells from PD-1−/− donor grafts were aggressively proliferative on day 3, indicating that these cells could be highly susceptible to the cytotoxic effects of Cy. We therefore tested the prophylactic efficacy of PTCy against severe GVHD with the PD-1−/− donor graft. Lethally irradiated recipient BDF1 mice received transplants of 10 × 106 SPs from either PD-1+/+ or PD-1−/− B6 mice, together with 5 × 10⁶ TCD-BM cells on day 0, and were treated with 50 mg/kg of Cy on day 3 (Figure 5A). PTCy improved the survival outcome and reduced GVHD severity in the PD-1−/− group, resulting in comparable survival rates between the PD-1+/+ and PD-1−/− groups because of PTCy prophylaxis (Figure 5B-C). We confirmed GVHD amelioration by PTCy in another acute GVHD mouse model using PD-1+/+ or PD-1−/− B6 donors and BALB/c recipients (supplemental Figure 6A-B). We further evaluated the effect of PTCy against GVHD after PD-1 mAb administration. PTCy also improved GVHD scores after pretransplantation administration of PD-1 mAb (Figure 5D-E).
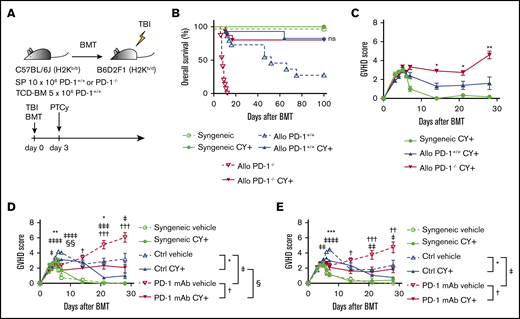
PTCy ameliorated GVHD caused by PD-1−/− graft and PD-1 mAb. (A) Lethally irradiated BDF1 recipients received transplants of 10 × 106 PD-1+/+ B6 or PD-1−/− B6 SPs and 5 × 10⁶ B6 TCD-BM cells (allogeneic group). The syngeneic group was administered the same amounts of SPs and TCD-BM cells from BDF1 mice (n = 9-15 per group). All recipient mice were intraperitoneally injected with 50 mg/kg of Cy on day 3 after HSCT. All animals were monitored daily for survival, and GVHD scores were monitored from days 3 to 7 and once per week from day 14. (B) Kaplan-Meier curve of survival after HSCT. Solid lines show outcomes of recipient mice treated with PTCy, and the dotted line shows survival without PTCy treatment (PD-1+/+ Cy+ vs PD-1−/− Cy+; ns). Data from 3 same experiments were combined. (C) Mean GVHD scores of PD-1+/+ or PD-1−/− donor mice (PD-1+/+ vs PD-1−/− on day 14, P < .05; day 21, P < .05; and day 28, P < .01). Data are representative of 3 independent experiments. (D) Lethally irradiated BDF1 recipients received transplants of 10 × 106 PD-1+/+ B6 SPs and 5 × 10⁶ B6 TCD-BM cells (allogeneic group). The syngeneic group was administered the same amounts of SPs and TCD-BM cells from BDF1 mice (n = 6-18 per group). Recipient mice were intraperitoneally injected with control mouse IgG or PD-1 mAb twice weekly between day −5 and +20 and were administered 50 mg/kg of Cy or vehicle on day 3 after HSCT. Mean GVHD scores of recipient mice treated with mouse IgG or peritransplantation PD-1 mAb ± PTCy (mouse IgG vs PD-1 mAb on day 5, P < .05; day 6, P < .0001; day 7, P < .0001; day 21, P < .001; and day 28, P < .05). Data from 2 same experiments were combined. (E) Lethally irradiated BDF1 recipients received transplants of 10 × 106 PD-1+/+ B6 SPs and 5 × 10⁶ B6 TCD-BM cells (allogeneic group). The syngeneic group was administered the same amounts of SPs and TCD-BM cells from BDF1 mice (n = 6-10 per group). Recipient mice were intraperitoneally injected with control mouse IgG or PD-1 mAb on days −5 and −1 and were administered 50 mg/kg of Cy or vehicle on day 3 after HSCT. Mean GVHD scores of recipient mice treated with mouse IgG or pretransplantation PD-1 mAb ± PTCy (mouse IgG vs PD-1 mAb on day 6, P < .01; day 7, P < .0001; day 21, P < .01; day 28, P < .05) Data from 2 same experiments were combined. Clinical scores are expressed as the mean ± standard error of the mean. *P < .05, **P < .01, ***P < .001, ****P < .0001. *, †, ‡, and § indicate the comparison between control IgG + vehicle vs control IgG + PTCy, PD-1 mAb + vehicle vs PD-1 mAb + PTCy, control IgG + vehicle vs PD-1 mAb + vehicle, and control + PTCy vs PD-1 mAb + PTCy, respectively.
PTCy ameliorated GVHD caused by PD-1−/− graft and PD-1 mAb. (A) Lethally irradiated BDF1 recipients received transplants of 10 × 106 PD-1+/+ B6 or PD-1−/− B6 SPs and 5 × 10⁶ B6 TCD-BM cells (allogeneic group). The syngeneic group was administered the same amounts of SPs and TCD-BM cells from BDF1 mice (n = 9-15 per group). All recipient mice were intraperitoneally injected with 50 mg/kg of Cy on day 3 after HSCT. All animals were monitored daily for survival, and GVHD scores were monitored from days 3 to 7 and once per week from day 14. (B) Kaplan-Meier curve of survival after HSCT. Solid lines show outcomes of recipient mice treated with PTCy, and the dotted line shows survival without PTCy treatment (PD-1+/+ Cy+ vs PD-1−/− Cy+; ns). Data from 3 same experiments were combined. (C) Mean GVHD scores of PD-1+/+ or PD-1−/− donor mice (PD-1+/+ vs PD-1−/− on day 14, P < .05; day 21, P < .05; and day 28, P < .01). Data are representative of 3 independent experiments. (D) Lethally irradiated BDF1 recipients received transplants of 10 × 106 PD-1+/+ B6 SPs and 5 × 10⁶ B6 TCD-BM cells (allogeneic group). The syngeneic group was administered the same amounts of SPs and TCD-BM cells from BDF1 mice (n = 6-18 per group). Recipient mice were intraperitoneally injected with control mouse IgG or PD-1 mAb twice weekly between day −5 and +20 and were administered 50 mg/kg of Cy or vehicle on day 3 after HSCT. Mean GVHD scores of recipient mice treated with mouse IgG or peritransplantation PD-1 mAb ± PTCy (mouse IgG vs PD-1 mAb on day 5, P < .05; day 6, P < .0001; day 7, P < .0001; day 21, P < .001; and day 28, P < .05). Data from 2 same experiments were combined. (E) Lethally irradiated BDF1 recipients received transplants of 10 × 106 PD-1+/+ B6 SPs and 5 × 10⁶ B6 TCD-BM cells (allogeneic group). The syngeneic group was administered the same amounts of SPs and TCD-BM cells from BDF1 mice (n = 6-10 per group). Recipient mice were intraperitoneally injected with control mouse IgG or PD-1 mAb on days −5 and −1 and were administered 50 mg/kg of Cy or vehicle on day 3 after HSCT. Mean GVHD scores of recipient mice treated with mouse IgG or pretransplantation PD-1 mAb ± PTCy (mouse IgG vs PD-1 mAb on day 6, P < .01; day 7, P < .0001; day 21, P < .01; day 28, P < .05) Data from 2 same experiments were combined. Clinical scores are expressed as the mean ± standard error of the mean. *P < .05, **P < .01, ***P < .001, ****P < .0001. *, †, ‡, and § indicate the comparison between control IgG + vehicle vs control IgG + PTCy, PD-1 mAb + vehicle vs PD-1 mAb + PTCy, control IgG + vehicle vs PD-1 mAb + vehicle, and control + PTCy vs PD-1 mAb + PTCy, respectively.
PTCy restored the balanced reconstitution of T-cell subsets and prevented tissue damage after HSCT from allogeneic PD-1−/− donors
We evaluated the effects of PTCy on tissue damage in GVHD target organs and the reconstitution of T-cell subsets in recipient mice after PD-1 blockade. Sublethally irradiated BDF1 mice received transplants of 5 × 10⁶ SPs from either PD-1+/+ or PD-1−/− B6 mice, together with 5 × 10⁶ TCD-BM cells from Ly5.1 B6 mice, and were administered PTCy on day 3. Histological analysis on day 14 demonstrated that lymphocyte infiltration in GVHD target organs were decreased irrespective of the PD-1 expression status of donor T cells and that the pathological scores were comparable between the 2 groups (Figure 6A-B). In terms of thymus effects, PTCy treatment completely alleviated histological abnormalities and facilitated the recovery of DP cell numbers in the thymuses of recipient mice in the PD-1−/− group (Figure 6C). In addition, CD4 Tcons and CD8 T cells in the thymuses of both the PD-1+/+ and PD-1−/− groups were predominantly residual host T cells (Figure 6D), suggesting that thymic damage resulting from donor T-cell infiltration was limited by PTCy. These results indicate that PTCy prevents damage to the GVHD target organs after PD-1 blockade.
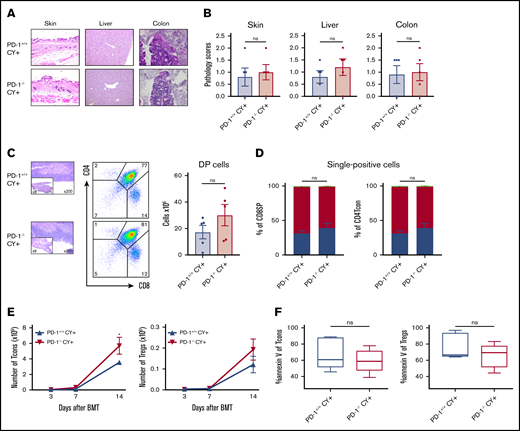
PTCy restored the balanced reconstitution of T-cell subsets and prevented tissue damage. Sublethally irradiated BDF1 recipient mice received transplants of 5 × 10⁶ PD-1+/+ B6 or PD-1−/− B6 SPs and 5 × 10⁶ Ly 5.1 B6 TCD-BM cells (n = 5 per group). All recipient mice were administered 50 mg/kg of PTCy intraperitoneally on day 3 after HSCT. (A) Representative images of the skin, liver, and colon from recipient mice with H&E staining are shown (magnification, ×200 for skin and liver, ×400 for colon). (B) Pathology scores of the skin, liver, and colon on day 14 after HSCT are shown. (C) Representative images of thymuses with H&E stains, lymphocyte gate of thymuses, and absolute number of DP cells in thymuses. (D) Chimerism analysis of CD8 or CD4 SP cells. Green, red, and blue indicate donor stem cell–, host-, and donor graft–derived cells, respectively. (E) Numbers of donor spleen–derived CD4 Tcons and donor spleen–derived Tregs after HSCT (CD4 Tcons, PD-1+/+ vs PD-1−/−, P < .05). (F) Annexin V expression of spleen-derived T cells on day 14 after HSCT. Data are expressed as the mean ± standard error of the mean. *P < .05.
PTCy restored the balanced reconstitution of T-cell subsets and prevented tissue damage. Sublethally irradiated BDF1 recipient mice received transplants of 5 × 10⁶ PD-1+/+ B6 or PD-1−/− B6 SPs and 5 × 10⁶ Ly 5.1 B6 TCD-BM cells (n = 5 per group). All recipient mice were administered 50 mg/kg of PTCy intraperitoneally on day 3 after HSCT. (A) Representative images of the skin, liver, and colon from recipient mice with H&E staining are shown (magnification, ×200 for skin and liver, ×400 for colon). (B) Pathology scores of the skin, liver, and colon on day 14 after HSCT are shown. (C) Representative images of thymuses with H&E stains, lymphocyte gate of thymuses, and absolute number of DP cells in thymuses. (D) Chimerism analysis of CD8 or CD4 SP cells. Green, red, and blue indicate donor stem cell–, host-, and donor graft–derived cells, respectively. (E) Numbers of donor spleen–derived CD4 Tcons and donor spleen–derived Tregs after HSCT (CD4 Tcons, PD-1+/+ vs PD-1−/−, P < .05). (F) Annexin V expression of spleen-derived T cells on day 14 after HSCT. Data are expressed as the mean ± standard error of the mean. *P < .05.
Analysis of T-cell reconstitution demonstrated that PTCy suppressed the early expansion of Tcons and Tregs on day 7, irrespective of the PD-1 expression status of donor T cells (Figure 6E). Thereafter, PD-1−/− CD4 Tcons gradually increased, and their number on day 14 was significantly higher than that of PD-1+/+ CD4 Tcons. Importantly, after PTCy treatment, the numbers of PD-1−/− Tregs and concomitant CD4 Tcons were increased and their susceptibility to apoptosis was lower on day 14 versus the non-PTCy setting (Figure 4D,F). These results suggest that PTCy restores T-cell homeostasis in recipients with PD-1 blockade.
PTCy preserved the antitumor effect of PD-1−/− T cells
To assess graft-versus-tumor effect after PTCy, sublethally irradiated BDF1 mice received transplants of 5 × 10⁶ SPs from PD-1+/+ or PD-1−/− B6 mice and 5 × 10⁶ TCD-BM cells from B6 mice, together with 0.5 × 10⁶ mastocytoma cells (P815), followed by PTCy on day 3 (supplemental Figure 7A). Control syngeneic transplantation (BDF1→BDF1) was also performed. After HSCT, overall survival was similar between the PD-1+/+ plus PTCy and PD-1−/− plus PTCy groups, and all recipients died as a result of tumor progression (supplemental Figure 7B-C), indicating that PTCy did not disrupt the antitumor effects of PD-1−/− effector T cells. Next, we evaluated tumor-infiltrating lymphocytes (TILs) in the liver of recipient mice in the PD-1+/+ and PD-1−/− donor transplantations after PTCy. The numbers of CD8+ TILs, CD4+ TILs, and Foxp3+ TILs did not significantly differ between the 2 groups. These results suggest that PTCy preserves the antitumor effect of PD-1−/− T cells (supplemental Figure 7C-D).
PTCy could not achieve maximum prophylactic effect against PD-1−/− donor–induced GVHD without Tregs in donor graft
A previous study demonstrated that the effect of PTCy was due not only to the depletion of alloreactive proliferative effector T cells, but also to the rapid recovery of donor Tregs.47 Therefore, we depleted Tregs in the donor graft and assessed the impact of PD-1−/− graft–derived Tregs on PTCy prophylaxis against PD-1−/− graft–induced GVHD. BDF1 mice were lethally irradiated and received transplants of 10 × 106 SPs from B6 mice (PD-1+/+, CD25+ T cell–replete [PD-1+/+ CD25+]; PD-1+/+, CD25+ T cell–deplete [PD-1+/+ CD25−]; PD-1−/−, CD25+ T cell–replete [PD-1−/− CD25+]; or PD-1−/−, CD25+ T cell–deplete [PD-1−/− CD25−]) and 5 × 10⁶ TCD-BM cells from B6 mice. PTCy was administered on day 3 after HSCT (Figure 7A). The PD-1−/− CD25− group showed a significantly lower survival rate and higher GVHD scores than the PD-1−/− CD25+ group (Figure 7B-C). The overall survival of the PD-1+/+ CD25− group was lower than that of the PD-1+/+ CD25+ group. These results indicate that Tregs play an important role in PTCy efficacy against GVHD, particularly for the PD-1−/− graft.
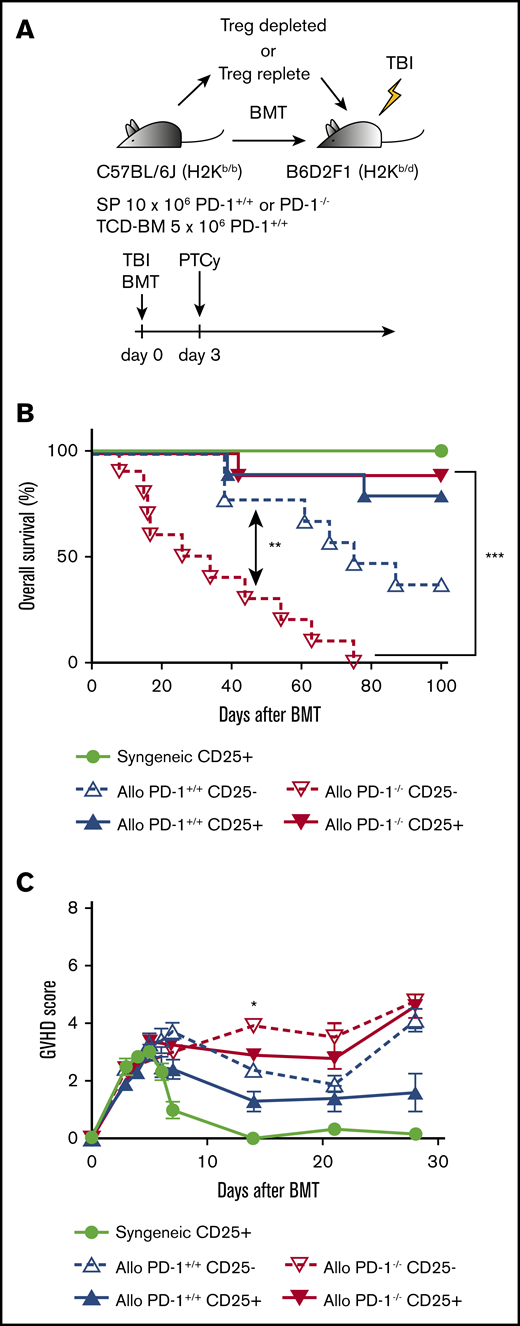
CD25+T-cell depletion abolished the efficacy of PTCy for recipient mice transplanted with PD-1−/− graft. (A) Lethally irradiated BDF1 recipients received transplants of 10 × 106 CD25-replete or CD25-depleted T cells from PD-1+/+ B6 SPs or PD-1−/− B6 SPs concomitantly with 5 × 10⁶ B6 TCD-BM cells (allogeneic group). The syngeneic group was administered the same amounts of SPs and TCD-BM from BDF1 mice (n = 10 per group). All recipient mice were administered 50 mg/kg of Cy intraperitoneally on day 3 after HSCT. All animals were monitored daily for survival, and GVHD scores were monitored from days 3 to 7 and once per week from day 14. (B) Kaplan-Meier survival curve after HSCT. Solid lines show the outcomes of recipient mice administered CD25-replete T cells, and the dotted line shows the survival of mice in the CD25-depleted group (PD-1−/− CD25+ vs PD-1−/− CD25−, P < .001). (C) Mean GVHD scores of recipient mice (PD-1−/− CD25+ vs PD-1−/− CD25− on day 14, P < .05). Data from 2 same experiments were combined. Clinical scores are expressed as the mean ± standard error of the mean. *P < .05, **P < .01, ***P < .001.
CD25+T-cell depletion abolished the efficacy of PTCy for recipient mice transplanted with PD-1−/− graft. (A) Lethally irradiated BDF1 recipients received transplants of 10 × 106 CD25-replete or CD25-depleted T cells from PD-1+/+ B6 SPs or PD-1−/− B6 SPs concomitantly with 5 × 10⁶ B6 TCD-BM cells (allogeneic group). The syngeneic group was administered the same amounts of SPs and TCD-BM from BDF1 mice (n = 10 per group). All recipient mice were administered 50 mg/kg of Cy intraperitoneally on day 3 after HSCT. All animals were monitored daily for survival, and GVHD scores were monitored from days 3 to 7 and once per week from day 14. (B) Kaplan-Meier survival curve after HSCT. Solid lines show the outcomes of recipient mice administered CD25-replete T cells, and the dotted line shows the survival of mice in the CD25-depleted group (PD-1−/− CD25+ vs PD-1−/− CD25−, P < .001). (C) Mean GVHD scores of recipient mice (PD-1−/− CD25+ vs PD-1−/− CD25− on day 14, P < .05). Data from 2 same experiments were combined. Clinical scores are expressed as the mean ± standard error of the mean. *P < .05, **P < .01, ***P < .001.
Discussion
This study provides insight into 3 aspects associated with the impact of PD-1 signaling on immune reconstitution after allo-HSCT. First, PD-1 inhibition did not uniformly affect graft-derived T cells within the T-cell subsets; this caused unbalanced reconstitution of the T-cell subsets, resulting in severe GVHD in the PD-1 knockout and PD-1 mAb models. Second, PD-1−/− donor T cells developed severe GVHD, particularly in the thymus. Few studies have focused on the effect of donor graft PD-1 expression on the thymus after HSCT, where acute GVHD in the thymus may lead to late central immune disturbances. Third, PTCy successfully ameliorated GVHD induced by PD-1−/− donor T cells, preserving the graft-versus-tumor effect.
Before analyzing the reconstitution of T-cell subsets posttransplantation, we first analyzed the basal levels of the proportion, proliferation, and apoptosis of T-cell subsets in PD-1−/− B6 mice as compared with those in PD-1+/+ B6 mice in the transplantation-naive setting. We found that each T-cell subset from PD-1−/− mice exhibited higher expression of annexin V than each respective subset from PD-1+/+ mice, indicating that inhibition of PD-1 signaling predisposes T-cell subsets to apoptotic susceptibility (supplemental Figure 4B). Annexin V level of PD-1−/− Tregs was much higher than that of PD-1−/− Tcons, but the Treg population was maintained in the noninflammatory transplantation-naive setting (supplemental Figure 4A). In contrast, in the inflammatory and lymphopenic posttransplantation settings, the apoptotic susceptibility of PD-1−/− Tregs was further elevated, and the cells did not maintain homeostasis, leading to a decrease of this cell population (Figure 4C-D right panels). Notably, the apoptotic susceptibility of PD-1−/− Tcons remained comparable to that of PD-1+/+ Tcons, and both PD-1−/− and PD-1+/+ Tcons continued increasing during the first 2 weeks (Figure 4C-D left panels). As demonstrated previously, Treg homeostasis may be fragile in the inflammatory or lymphopenic environment.34,48,49 Our results suggest that the posttransplantation inflammatory and lymphopenic environments drive PD-1−/− Treg fragility and collapse of homeostasis, leading to unbalanced immune recovery as a pathogenic basis of severe GVHD.
Similar to our recent study in a low-dose IL-2 treatment setting,41 PD-1−/− Tregs increased transiently but were counterbalanced by accelerated apoptosis, whereas PD-1−/− CD4 Tcons and CD8 T cells continued their drastic expansion. Unbalanced reconstitution of Tregs and CD4 Tcons after HSCT with prior PD-1 blockade therapy was also suggested in a human retrospective analysis.11 A previous study demonstrated that PD-1 blockade of donor T cells was associated with accelerated GVHD.9 Furthermore, another study revealed that PD-L1 was more important in host nonhematopoietic cells compared with hematopoietic cells in regulating GVHD.10 However, the effect of PD-1 expression on Treg homeostasis after HSCT was not explored in previous studies. To our knowledge, this is the first study to demonstrate that PD-1 signaling affects Treg expansion and apoptosis in an allo-HSCT setting. However, no definitive consensus has been reached regarding the role of PD-1 in Tregs,42,50-53 and additional investigations are warranted in this area.
Histopathological analyses revealed that PD-1−/− grafts develop GVHD in the skin, liver, colon, and, most strikingly, thymus. The thymus, which plays a critical role in central immune tolerance, is a GVHD target organ.54 During thymic GVHD, the number of thymic DP cells was decreased because of the failure of CD3, CD4, and CD8 triple-negative thymocytes to proliferate adequately, which increased apoptosis among DP thymocytes.46 Decreased demarcation between the cortex and medulla and disruption of its architecture have been reported in mouse models and patient samples.46,55-57 Thymic GVHD caused a decrease in the thymic output of naive T cells and impaired negative selection of thymocytes and Treg development, leading to chronic GVHD.58,59 In the present study, the thymuses of recipient mice in the PD-1−/− group displayed severe morphological changes that were typical of thymic GVHD. Flow cytometric analyses demonstrated that DP cells were markedly depleted and that infiltrating single-positive T cells were donor graft–derived T cells, suggesting thymic GVHD. Such thymic alterations were not observed in the syngeneic model after HSCT, supporting that thymic changes resulted from an allogeneic immune reaction. Importantly, the number of circulating T cells in the peripheral blood on day 28 after HSCT was significantly lower in the PD-1−/− group than in the PD-1+/+ group. However, we were unable to evaluate the impact of thymic GVHD after pretransplantation PD-1 blockade on chronic GVHD because of the acute GVHD mouse models used in the present study.60
Our results showed that PTCy efficiently suppressed the expansion of PD-1−/− CD4 Tcons. Importantly, after administering PTCy, the susceptibility of PD-1−/− Tregs to apoptosis was improved to a level comparable to that in other T cells, indicating that PTCy may rescue PD-1−/− Tregs from apoptosis. PTCy may deplete alloreactive proliferative effector T cells that produce endogenous IL-2 without eradicating Tregs that are resistant to PTCy as a result of aldehyde dehydrogenase expression.27 On the basis of the results, we presumed that PTCy reduces endogenous IL-2 production and rescues residual PD-1−/− Tregs from apoptosis, leading to a balanced reconstitution of T-cell subsets. Previous studies have demonstrated the instability of Foxp3 expression of Tregs in an inflammatory or lymphopenic environment,34,48,49 and PD-1 deficiency induced instability of Tregs,41 which has pathological potential in mice models.42 Thus, PD-1−/− Tregs may decrease Foxp3 expression within the inflammatory cytokine milieu during the early phase of allo-SCT, and PTCy may suppress the alloimmune cytokine storm and prolong the survival of PD-1−/− Tregs. Our model did not reveal the definitive mechanisms of PD-1−/− Treg transient expansion or their subsequent decline after allo-SCT. However, our data are consistent with previous clinical observations and may partially explain the underlying mechanisms.
There were some limitations to this study. The most important limitation was that our preclinical model mainly relied on a PD-1 knockout model. We conducted PD-1 antibody experiments and PD-1 blockade using antibodies that resulted in the exacerbation of acute GVHD (Figure 1G-H). Our antibody experiments demonstrated that pretransplantation antibody administration and peritransplantation administration resulted in similar GVHD severity (Figure 1G-H). This suggests that the negative impact of PD-1 antibody on GVHD continues for a certain period of time after the last antibody administration. In contrast, a certain time between the last PD-1 mAb administration and BMT resulted in GVHD severity comparable to that in the control group, suggesting that a certain washout period between the last PD-1 mAb administration and BMT could reduce the adverse impacts of PD-1 mAb on the allogeneic reaction in this mouse model, as observed in the clinical situation. However, differences in murine and human physiological and metabolic functions for PD-1 mAb made it difficult to create a murine BMT model that mirrored the human clinical setting. In fact, retrospective analyses in humans have demonstrated that the plasma concentration of PD-1 mAb persisted at allo-HSCT, even when PD-1 mAb administration was discontinued 7 weeks before allo-HSCT.8 Another clinical study reported that the biological effects of PD-1 inhibition lasted for ≥6 months.11 Because it is important to identify a sufficient washout period for PD-1 mAb, careful consideration in human clinical studies is needed. Moreover, it seems to be necessary to consider the difference in the degree of PD-1 inhibition between PD-1 knockout experiments and PD-1 mAb experiments. Partial PD-1 decrease with therapeutic blockade by mAbs does not necessarily parallel the PD-1 knockout setting. Because PD-1 signaling is still active even when diminished by PD-1 mAb, different operational mechanisms may work during systemic PD-1 blockade by mAbs or complete PD-1 inhibition by genetic ablation. Additional experimental studies are needed to evaluate this issue.
In conclusion, PTCy successfully ameliorated lethal GVHD caused by PD-1−/− grafts and anti–PD-1 mAbs. The influence of PD-1 inhibition differed within T-cell subsets. Retrospective studies suggested that PTCy has potential for GVHD prophylaxis in patients receiving PD-1 blockade therapy. Our present study strongly supports these clinical observations and proposes a biological mechanism governing the therapeutic approach.
Presented orally in abstract form at the 60th annual meeting of the American Society of Hematology, San Diego, CA, 2 December 2018.
For original data, please contact the corresponding author at k-matsu@md.okayama-u.ac.jp.
Acknowledgments
The authors thank Kyoko Maeda, Hiromi Nakashima, and all staff at the Institutional Animal Care and Research Advisory Committee, Okayama University Advanced Science Research Center, Okayama University Medical School.
This work was supported by JSPS KAKENHI grant 26461449.
Authorship
Contribution: S.I. designed and performed experiments and wrote the paper; Y. Meguri, T.K., H.S., Y.S., M.N., and M.I. performed experiments; Y. Maeda supervised the laboratory studies and edited the paper; and K.M. designed and supervised the research and edited the paper.
Conflict-of-interest disclosure: The authors declare no competing financial interests.
Correspondence: Ken-ichi Matsuoka, Department of Hematology and Oncology, Okayama University, 2-5-1 Shikata-cho, Kita-ku, Okayama, Okayama 700-8558, Japan; e-mail: k-matsu@md.okayama-u.ac.jp.

