

Key Points
Sptlc1 is essential for myeloid differentiation during hematopoiesis; ER stress prevents myeloid development in Sptlc1 mutant mice.
Accumulation of fatty acid promotes ER stress in Sptlc1 mutant myeloid progenitors.

Abstract
Serine palmitoyltransferase (SPT) long-chain base subunit 1 (SPTLC1) is 1 of the 2 main catalytic subunits of the SPT complex, which catalyzes the first and rate-limiting step of sphingolipid biosynthesis. Here, we show that Sptlc1 deletion in adult bone marrow (BM) cells results in defective myeloid differentiation. In chimeric mice from noncompetitive BM transplant assays, there was an expansion of the Lin− c-Kit+ Sca-1+ compartment due to increased multipotent progenitor production, but myeloid differentiation was severely compromised. We also show that defective biogenesis of sphingolipids in the endoplasmic reticulum (ER) leads to ER stress that affects myeloid differentiation. Furthermore, we demonstrate that transient accumulation of fatty acid, a substrate for sphingolipid biosynthesis, could be partially responsible for the ER stress. Independently, we find that ER stress in general, such as that induced by the chemical thapsigargin or the fatty acid palmitic acid, compromises myeloid differentiation in culture. These results identify perturbed sphingolipid metabolism as a source of ER stress, which may produce diverse pathological effects related to differential cell-type sensitivity.
Introduction
Sphingolipids are components of all eukaryotic cell membranes and are vital for the survival of organisms from yeast to mammals.1-10 Serine palmitoyltransferase (SPT) catalyzes the condensation of palmitoyl-CoA and serine to 3-ketosphinganine, a regulated rate-limiting step in the de novo biosynthetic pathway of sphingolipids in the endoplasmic reticulum (ER). The mammalian SPT holoenzyme is primarily a heterotrimeric complex composed of SPT long-chain base subunit 1 (SPTLC1; 53 kDa), SPTLC2 (63 kDa), and small subunit of SPTa (ssSPTa) or ssSPTb (10 kDa).11-17 SPTLC1 and SPTLC2 are part of the catalytic subunit whereas the small subunits confer substrate specificity. Previous studies have identified SPTLC1 as a critical determinant of SPT enzymatic activity and sphingomyelin synthesis and as a regulator of gastrulation.18 Deficiency of SPTLC2 in the liver resulted in impaired liver function.19 A mutation in the small subunit of the SPT complex, ssSPTb, results in neurodegeneration.20 Sptlc1 and Sptlc2 knockouts are embryonically lethal, necessitating the use of conditional knockout (CKO) mice to study their function in adult organisms.18
Adult hematopoietic progenitor cells are the major source of mature blood cells produced daily, and in humans those production numbers reach more than several hundred billion per day.21 Hematopoiesis is a highly regulated process that occurs mainly in the bone marrow (BM) microenvironment (niche) where blood cells are derived from hematopoietic stem cells (HSCs). During myeloid differentiation, HSCs commit to the formation of multipotent progenitors (MPPs), which further differentiate to form common myeloid progenitors (CMPs) and, subsequently, bipotent granulocyte-macrophage progenitors (GMPs) or megakaryocyte/erythrocyte progenitors (MEPs) that undergo terminal differentiation to granulocytes/macrophages or megakaryocytes/erythrocytes, respectively. Depending on the needs of the organism, these cells form unipotent progenitors and, eventually, terminally differentiated granulocytes or macrophages.22
There is keen interest in understanding the contextual significance of metabolic processes during differentiation in several systems, including hematopoiesis.23 The focus has been primarily on energy metabolism, specifically during stem cell maintenance and commitment to differentiation.23-25 Not all metabolic requirements necessary for specification along committed lineages are understood. We report here that SPTLC1 is essential for myeloid differentiation in adult hematopoietic tissue. Mx1-Cre–induced deletion of Sptlc1 results in reduced de novo biosynthesis of major sphingolipids and severely impaired myelopoiesis. The Sptlc1−/− lineages are poorly represented in competitive BM repopulation conditions. When the proportion of Sptlc1−/− HSCs is increased by providing more donor cells, the profile of the mutant BM cells (BMCs) appears similar to that observed in noncompetitive chimeric mice. In chimeric noncompetitive BM transplantation (BMT) studies, HSCs and MPPs are expanded and differentiation of the committed progenitors into myeloid progeny is affected in the mutant. The lack of sphingolipid synthesis in mutant BMCs leads to ER stress and compromises differentiation along the myeloid lineage. The ER stress occurs during the differentiation process in the LK cells that leads to the activation of apoptosis and death of these cells. We demonstrate that accumulation of fatty acid in the mutant cells can partly explain the observed ER stress. Induction of ER stress in wild-type BMCs using chemical inhibitors or fatty acid also suppresses differentiation along the myeloid pathway while sparing erythroid differentiation.
Methods
Our animal studies have been approved by the National Cancer Institute Animal Care and User Committee (protocol number 17-073).
Targeting of Sptlc1 gene and mice strain
The details of the targeting strategy and genetic cross for Mx1-Cre–mediated deletion of Sptlc1 (Sptlc1−/−) are elaborated in supplemental Methods.
Tissue culture and differentiation
Immunophenotyping and BMT studies
Sphingolipid analysis
Mass spectrometric estimation of sphingolipids was performed as in our previous studies.30
Single-cell messenger RNA sequencing
Single-cell samples were prepared using the 10× chromium workflow and sequenced on 2 NextSeqs as 4 samples per run. The 10× data set was analyzed by Seurat, an R package tool designed for analysis of single-cell RNA-sequencing (RNA-seq) data31 (satijalab.org/seurat/immune_alignment.html).
Statistical analysis
Our data were analyzed by 2-tailed unpaired Student t tests with Welch correction. Results were presented as the means and standard deviations of groups, with P < .05 considered to be statistically significant.
Results
SPTLC1 deficiency in adult hematopoietic cells affects BM and spleen
As Sptlc1 knockouts are embryonically lethal, we generated a CKO allele using the standard Cre-lox system and Bac recombineering (supplemental Figure 1A).18,32 We used Mx1-Cre transgenic mice to induce deletion of the floxed allele to study the adult hematopoietic system.33 Genotypes were confirmed by polymerase chain reaction (PCR) (supplemental Figure 1B). The Sptlc1+/+Mx1-Cre and Sptlc1flox/nullMx1-Cre mice were administered intraperitoneal injections of 500 μg of poly(I:C) to induce Cre-recombinase expression and delete Sptlc1 (Sptlc1−/−) in BMCs. Although no mortality was observed in the controls, the Sptlc1−/− mice died 4 days after the injection due to disruption of intestinal integrity (supplemental Figure 1C), fluid accumulation, and complications thereof caused by deletion of Sptlc1 in nonhematopoietic tissues (data not shown). Accordingly, all hematopoietic analyses in direct conditional knockouts were conducted 3 days after administration of poly(I:C). The gene is uniformly expressed in most lineages of the hematopoietic system with elevated levels in GMPs and MEPs (supplemental Figure 1D). The loss of SPTLC1 protein in BMCs was confirmed by western blotting (Figure 1A). Levels of sphingomyelins, ceramides, and hexosylceramides were significantly decreased in the Sptlc1−/− BMCs30 (Figure 1B; supplemental Table 1). Freshly isolated preparations of Sptlc1−/− BMCs were unusually red in color and cytocentrifuge preparations exhibited fewer myeloid cells including metamyelocytes as well as segmented and band neutrophils, whereas the proportion of erythroid cells was apparently higher (Figure 1C-D). The cellularity of the Sptlc1−/− BM was decreased (Figure 1E). Peripheral blood cell (PBC) analysis showed no significant differences in the blood cells of the Sptlc1−/− mice on the third day postinjection (supplemental Figure 1E). The size and cellularity of the spleen was reduced in Sptlc1−/− (supplemental Figure 1F-G) and splenic architecture was disrupted (supplemental Figure 1H). The loss of SPTLC1 had minimal effect on the thymus (supplemental Figure 1I). There were no significant differences in BM lineages in Sptlc1flox/nullMx1-Cre without induction by poly(I:C) compared with the control Sptlc1+/+Mx1-Cre (supplemental Figure 1J-N). These results show that global loss of Sptlc1 in the adult hematopoietic system results in reduced sphingolipid levels in BMCs and leads to a rapid depletion of mature myeloid cells in the BM, whereas RBCs and lymphoid cells are less affected.
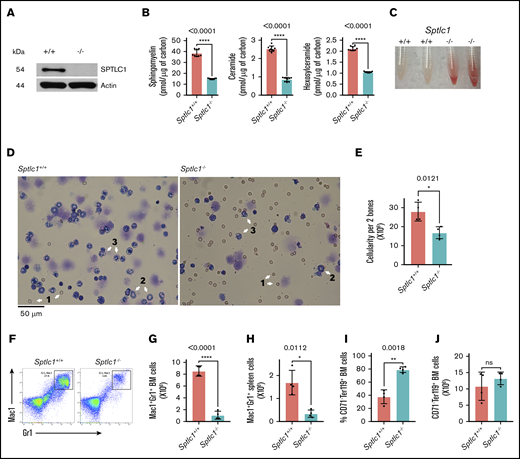
Deletion of Sptlc1 in mice using Mx1-Cre affects BM and spleen. (A) Western blot analysis for the loss of SPTLC1 protein in the Sptlc1−/− BMCs. (B) Sphingomyelin, ceramide, and hexosylceramide were analyzed by mass spectrometry and normalized to carbon content. The sphingomyelin levels were 38.5 ± 3 and 15 ± 0.4 pmol per microgram of carbon, the total ceramides were 2.5 ± 0.14 and 0.8 ± 0.1 pmol per microgram of carbon, and the hexosylceramides were 2.1 ± 0.09 and 1 ± 0.02 pmol per microgram of carbon in the Sptlc1+/+ and Sptlc1−/− BMCs, respectively. The results are from technical triplicates performed on BM cells from 3 mice of each genotype. (C) Representative images of BM tissue isolated from Sptlc1+/+ and Sptlc1−/− mice. (D) Wright-Giemsa staining of BMCs from the Sptlc1+/+ and Sptlc1−/− mice. 1, RBC; 2, metamyelocyte; and 3, segmented band cell. Scale bar, 50 μm. (E) BM cellularity was determined from 2 femurs on day 3 in the Sptlc1+/+ and Sptlc1−/− mice. (F) Myeloid differentiation in BM hematopoietic cells was analyzed by Mac-1 and Gr-1 staining 3 days after poly(I:C) injection (n = 4). (G) The total numbers of Mac-1+Gr-1+ cells were plotted for the Sptlc1+/+ and Sptlc1−/− mice (n = 4). (H) Myeloid differentiation in spleens obtained from Sptlc1+/+ and Sptlc1−/− mice was analyzed by Mac-1 and Gr-1 staining (n = 4). (I) The percentage of CD71−Ter119+ BMCs was plotted for the Sptlc1+/+ and Sptlc1−/− mice (n = 4). (J) The total numbers of CD71−Ter119+ BMCs were plotted for the Sptlc1+/+ and Sptlc1−/− mice (n = 4). All graphs are represented as mean ± standard error of the mean (SEM). P < .05 is significant, calculated from the unpaired Student t test. ns, not significant.
Deletion of Sptlc1 in mice using Mx1-Cre affects BM and spleen. (A) Western blot analysis for the loss of SPTLC1 protein in the Sptlc1−/− BMCs. (B) Sphingomyelin, ceramide, and hexosylceramide were analyzed by mass spectrometry and normalized to carbon content. The sphingomyelin levels were 38.5 ± 3 and 15 ± 0.4 pmol per microgram of carbon, the total ceramides were 2.5 ± 0.14 and 0.8 ± 0.1 pmol per microgram of carbon, and the hexosylceramides were 2.1 ± 0.09 and 1 ± 0.02 pmol per microgram of carbon in the Sptlc1+/+ and Sptlc1−/− BMCs, respectively. The results are from technical triplicates performed on BM cells from 3 mice of each genotype. (C) Representative images of BM tissue isolated from Sptlc1+/+ and Sptlc1−/− mice. (D) Wright-Giemsa staining of BMCs from the Sptlc1+/+ and Sptlc1−/− mice. 1, RBC; 2, metamyelocyte; and 3, segmented band cell. Scale bar, 50 μm. (E) BM cellularity was determined from 2 femurs on day 3 in the Sptlc1+/+ and Sptlc1−/− mice. (F) Myeloid differentiation in BM hematopoietic cells was analyzed by Mac-1 and Gr-1 staining 3 days after poly(I:C) injection (n = 4). (G) The total numbers of Mac-1+Gr-1+ cells were plotted for the Sptlc1+/+ and Sptlc1−/− mice (n = 4). (H) Myeloid differentiation in spleens obtained from Sptlc1+/+ and Sptlc1−/− mice was analyzed by Mac-1 and Gr-1 staining (n = 4). (I) The percentage of CD71−Ter119+ BMCs was plotted for the Sptlc1+/+ and Sptlc1−/− mice (n = 4). (J) The total numbers of CD71−Ter119+ BMCs were plotted for the Sptlc1+/+ and Sptlc1−/− mice (n = 4). All graphs are represented as mean ± standard error of the mean (SEM). P < .05 is significant, calculated from the unpaired Student t test. ns, not significant.
SPTLC1 deficiency in hematopoietic cells severely compromises myelopoiesis
To determine how loss of Sptlc1 affects hematopoietic lineage development 3 days after deletion in BMCs, we analyzed BMCs, thymocytes, and splenocytes for lineage markers expressed on myeloid cells (Mac-1; Gr-1), erythroid cells (CD71; Ter119), B lymphoid cells (immunoglobulin M [IgM]), and T lymphocytes (CD4; CD8) by flow cytometry. Granulocytes (Mac-1+; Gr-1+) were severely depleted in the Sptlc1−/− BM compared with littermate controls (more than sevenfold) (Figure 1F-G). The spleen also showed a significant reduction in granulocytes (Figure 1H; supplemental Figure 2A). The proportion of mature erythroid cells (CD71−; Ter119+) was increased in the BM whereas the cellularity was unchanged (Figure 1I-J). The CD4+, CD8+, and CD4+CD8+ thymocytes were not significantly affected (supplemental Figure 2B-D). B cells marked by IgM were decreased in Sptlc1−/−, albeit with marginal significance (supplemental Figure 2E). Thus, SPTLC1 deficiency impairs granulocyte development, whereas erythroid and lymphoid development are relatively spared. To determine the intrinsic requirement of SPTLC1 in hematopoiesis, we transplanted Sptlc1+/+Mx1-Cre and Sptlc1Flox/nullMx1-Cre BMCs in noncompetitive and competitive BM repopulation assays.29,34
In noncompetitive assays, chimeric mice were treated with poly(I:C) (15 μg per gram of body weight, followed by a second dose 2 days later) 6 weeks after transplantation of Sptlc1+/+ and Sptlc1flox/null BMCs. The majority of chimeric Sptlc1−/− mice did not survive beyond 4 to 5 weeks and therefore we analyzed mice 3 weeks after the last injection, when the mice appeared healthy. We have not resolved the cause of death in noncompetitive chimeric mice. Analysis of PBCs showed reduced neutrophils, lymphocytes, and monocytes but red blood cells (RBCs) and platelets were not compromised (Figure 2A-F). BM cellularity of Sptlc1−/− mice was decreased by 38% compared with the control (Figure 2G). Total donor Mac-1+Gr-1+ neutrophils were decreased by 83% (roughly fivefold), suggesting that SPTLC1 is intrinsically required for the development of granulocytes (Figure 2H-I). Macrophages and monocytes were similarly compromised (Figure 2J-K). Because CD45 is expressed in the early stages of erythroid development, we examined BMCs for donor erythroid progenitor cells, and found that these cells were increased in the BM of Sptlc1−/− mice, indicating that erythroid development was not compromised at this time (Figure 2L-N). The total number of Sptlc1−/− thymocytes was decreased (supplemental Figure 2F). However, there was no difference in the percentage of donor-derived CD4+, CD8+, and CD4+CD8+ T lymphocytes between Sptlc1+/+ and Sptlc1−/− chimeric mice (supplemental Figure 2G-L), indicating that the differentiation of T lymphocytes was largely unaffected in the thymus of the transplanted mice at this time. Finally, we observed no significant difference in B-lymphoid cells in the BM of Sptlc1+/+ and Sptlc1−/− chimeric mice (supplemental Figure 2M). Thus, a defect in the development of the myeloid cells is the predominant effect on lineage development in mice 3 weeks after the loss of SPT function in the adult hematopoietic system.
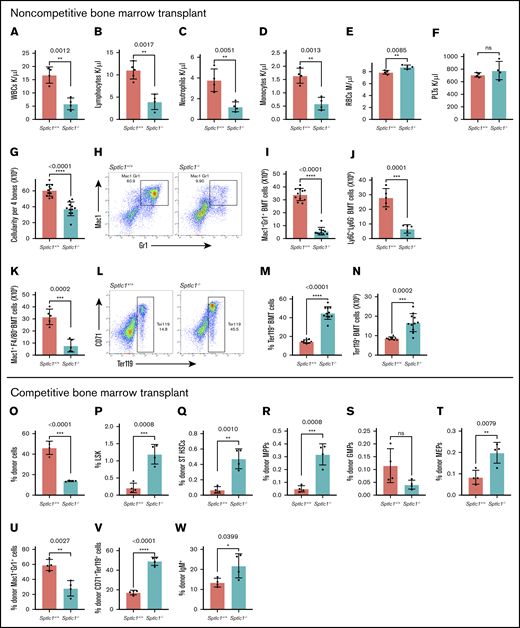
Sptlc1 deletion impairs myeloid differentiation in chimeric mice and compromises HSC development in competitive repopulation studies. (A-N) Studies done in chimeric noncompetitive repopulations studies. (A-F) Complete blood count (CBC) analysis of peripheral blood white blood cell (WBC), neutrophil, lymphocyte, monocyte, RBC, and platelet (PLT) counts 21 days after poly(I:C) injection for noncompetitive BMT Sptlc1+/+ and Sptlc1−/− mice (n = 4). (G) Total BM cellularity was determined for the Sptlc1+/+ and Sptlc1−/− 21 days after poly(I:C) injection in chimeric mice (n = 11). (H) Myeloid differentiation in BMCs was analyzed by Mac-1 and Gr-1 staining. (I) The total numbers of Mac-1+Gr-1+ cells were plotted for the Sptlc1+/+ and Sptlc1−/− (n = 11). (J) The total numbers of Ly6C+Ly6G− cells were plotted for the Sptlc1+/+ and Sptlc1−/− (n = 5). (K) The total numbers of Mac-1+ F4/80+ cells were plotted for the Sptlc1+/+ and Sptlc1−/− (n = 5). (L) Erythroid differentiation in transplanted BMCs was analyzed by CD71 and Ter119 staining. (M) The percentage of CD71−Ter119+ cells was plotted for the Sptlc1+/+ and Sptlc1−/− mice (n = 11). (N) The total numbers of CD71−Ter119+ cells were plotted for the transplanted Sptlc1+/+ and Sptlc1−/− mice (n = 11). (O-W) Studies done in competitive repopulation studies ratio (1:8), analyzed 3 weeks after poly(I:C) injection. The percentages of donor CD45.2 cells (O), donor Lin− c-Kit+ Sca-1+ (LSK) cells (P), donor ST-HSCs (Q), donor MPP cells (R), donor GMP cells (S), donor MEP cells (T), donor myeloid cells (U), donor erythroid cells (V), and donor lymphoid cells (W) of Sptlc1+/+ and Sptlc1−/− in competitive transplant studies were plotted. All graphs are represented as mean ± SEM. P < .05 is significant, calculated from the unpaired Student t test.
Sptlc1 deletion impairs myeloid differentiation in chimeric mice and compromises HSC development in competitive repopulation studies. (A-N) Studies done in chimeric noncompetitive repopulations studies. (A-F) Complete blood count (CBC) analysis of peripheral blood white blood cell (WBC), neutrophil, lymphocyte, monocyte, RBC, and platelet (PLT) counts 21 days after poly(I:C) injection for noncompetitive BMT Sptlc1+/+ and Sptlc1−/− mice (n = 4). (G) Total BM cellularity was determined for the Sptlc1+/+ and Sptlc1−/− 21 days after poly(I:C) injection in chimeric mice (n = 11). (H) Myeloid differentiation in BMCs was analyzed by Mac-1 and Gr-1 staining. (I) The total numbers of Mac-1+Gr-1+ cells were plotted for the Sptlc1+/+ and Sptlc1−/− (n = 11). (J) The total numbers of Ly6C+Ly6G− cells were plotted for the Sptlc1+/+ and Sptlc1−/− (n = 5). (K) The total numbers of Mac-1+ F4/80+ cells were plotted for the Sptlc1+/+ and Sptlc1−/− (n = 5). (L) Erythroid differentiation in transplanted BMCs was analyzed by CD71 and Ter119 staining. (M) The percentage of CD71−Ter119+ cells was plotted for the Sptlc1+/+ and Sptlc1−/− mice (n = 11). (N) The total numbers of CD71−Ter119+ cells were plotted for the transplanted Sptlc1+/+ and Sptlc1−/− mice (n = 11). (O-W) Studies done in competitive repopulation studies ratio (1:8), analyzed 3 weeks after poly(I:C) injection. The percentages of donor CD45.2 cells (O), donor Lin− c-Kit+ Sca-1+ (LSK) cells (P), donor ST-HSCs (Q), donor MPP cells (R), donor GMP cells (S), donor MEP cells (T), donor myeloid cells (U), donor erythroid cells (V), and donor lymphoid cells (W) of Sptlc1+/+ and Sptlc1−/− in competitive transplant studies were plotted. All graphs are represented as mean ± SEM. P < .05 is significant, calculated from the unpaired Student t test.
To evaluate the intrinsic role of SPTLC1 in HSC development, we evaluated loss of Sptlc1 in a competitive BMT assay, in which all mice survived. Sptlc1−/− HSCs showed little or no contribution to donor hematopoietic reconstitution (2% to 4%) 12 weeks after Sptlc1 deletion compared with 40% to 60% for control BMCs in this model, suggesting that SPTLC1 is required for HSC development (supplemental Figure 2N). Sptlc1−/− donor myeloid, B-cell, and erythroid cells were lost, and few cells were present 12 weeks after deleting Sptlc1 (supplemental Figure 2O-Q). Similarly, HSC and progenitor cell (HSPC) analysis showed few donor long-term HSCs (LT-HSCs) (CD34−; Flt3−), short-term HSCs (ST-HSCs) (CD34+;Flt3−), and MPPs (CD34+;Flt3+) present in mice 12 weeks after deletion of Spltc1 indicating that SPTLC1 is required for HSC development (supplemental Figure 2R-T). Because, in a competitive setting, the competing control BM HSPCs engage in active hematopoiesis and rescue any deficits caused by Sptlc1 deletion, the mutant HSPCs were relieved of the requirement to maintain homeostasis. We asked whether increasing the proportion of mutant HSPCs would allow us to evaluate their differentiation potential in a competitive environment. Therefore, we performed transplantation studies with a 1:8 population of wild-type (Sptlc1+/+Mx1-Cre) to mutant (Sptlc1flox/nullMx1-Cre) cells. Using this protocol, sufficient mutant BMCs populate the marrow after poly(I:C) injection (Figure 2O). Specifically, we found that Sptlc1−/− knockout BMCs show hematopoietic phenotypes similar to those observed in the noncompetitive chimeric mouse model. There is a relative expansion of the LSK compartment, including the MPP cells (Figure 2P-R). In the LK compartment, a trend toward decreasing GMPs and the MEPs is relatively increased (Figure 2S-T). Finally, we see decreased granulocytic development whereas erythroid and lymphoid compartments are relatively expanded (Figure 2U-W). This setting allowed determination of the cell-autonomous effects of Sptlc1 deletion and was found to encompass both HSCs and all lineages downstream. The requirement for Sptlc1 in HSC development in a competitive setting needs further study. To understand the mechanism underlying the failure to promote myelopoiesis in the absence of Sptlc1, we turned to a noncompetitive chimeric mouse model because under these conditions the Sptlc1−/− HSPC cells show robust reconstitution to dissect myeloid, erythroid, and lymphoid lineages.
Increased ST-HSCs and MPP cells in SPTLC1-deficient BM
To understand how loss of Sptlc1 leads to defects in myelogenesis, we evaluated HSPC development in the chimeric mice 21 days after loss of Sptlc1. HSCs were gated by forward scatter (FSC) and side scatter (SSC) for live cells, CD45.2 donor cells, and then lineage-negative cells (Lin−) (supplemental Figure 3A). Next, Lin− cells were further analyzed for the expression of c-Kit and Sca-1, identifying stem and MPP cells (LSK) and committed progenitor cells LK (Lin−; c-Kit+; Sca-1−) (Figure 3A). LSK cells include LT-HSCs, ST-HSCs, and MPPs (supplemental Figure 3B). We found that the total number of LSK cells in the BM was increased 7.9-fold in Sptlc1−/− chimeric mice compared with the Sptlc1+/+ (Figure 3B). Although little difference was observed in the numbers of LT-HSCs (Figure 3C), ST-HSCs (9.2-fold), and MPPs (8.8-fold) were significantly increased in BM from Sptlc1−/− mice when compared with the controls (Figure 3D-E). When gated using SLAM markers CD48 and CD150, the ST-HSCs were slightly reduced, whereas LT-HSCs was unaffected and MPPs were increased (Figure 3F-H). Analysis of the MPP cells using antibodies that recognize Flt3, CD150, and CD48 indicated an increase in all 3 subpopulations of MPP (MPP2, MPP3, and MPP4), demonstrating that MPPs were responsible for the increase in the LSK numbers (Figure 3I-K; supplemental Figure 3C-F). These 3 subpopulations of MPPs express Sptlc1 including slightly higher levels in MPP2 cells (supplemental Figure 3G) although the significance is not clear at this time.
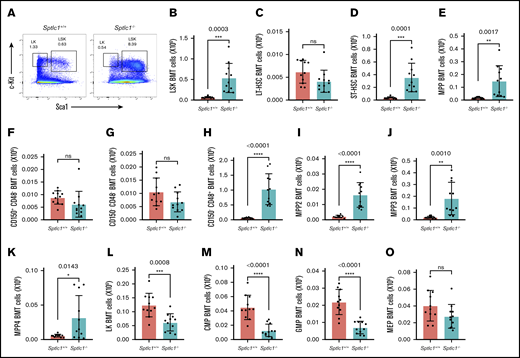
Sptlc1 deletion affects myeloid progenitors and increases ST-HSC and MPP populations in BMT cells. (A) The LSK and LK populations of HSPCs from transplanted BM were analyzed by Sca-1 and c-Kit staining 21 days after poly(I:C) injection. (B) The total number of LSK cells was plotted for the Sptlc1+/+ and Sptlc1−/− mice (n = 11). (C-E) The total numbers of LT-HSCs, ST-HSCs, and MPPs were plotted for the Sptlc1+/+ and Sptlc1−/− mice (n = 11). (F-H) The total numbers of CD150+ CD48−, CD150−CD48−, and CD150−CD48+ were plotted for the Sptlc1+/+ and Sptlc1−/− mice (n = 11). (I-K) The total numbers of MPP2, MPP3, and MPP4 were plotted for the Sptlc1+/+ and Sptlc1−/− mice (n = 11). (L) The total number of LK cells was plotted for the Sptlc1+/+ and Sptlc1−/− mice (n = 11). (M-O) The total numbers of CMPs, GMPs, and MEPs were plotted for the Sptlc1+/+ and Sptlc1−/− mice (n = 11). All graphs data are represented as mean ± SEM. P < .05 is significant, calculated from the unpaired Student t test.
Sptlc1 deletion affects myeloid progenitors and increases ST-HSC and MPP populations in BMT cells. (A) The LSK and LK populations of HSPCs from transplanted BM were analyzed by Sca-1 and c-Kit staining 21 days after poly(I:C) injection. (B) The total number of LSK cells was plotted for the Sptlc1+/+ and Sptlc1−/− mice (n = 11). (C-E) The total numbers of LT-HSCs, ST-HSCs, and MPPs were plotted for the Sptlc1+/+ and Sptlc1−/− mice (n = 11). (F-H) The total numbers of CD150+ CD48−, CD150−CD48−, and CD150−CD48+ were plotted for the Sptlc1+/+ and Sptlc1−/− mice (n = 11). (I-K) The total numbers of MPP2, MPP3, and MPP4 were plotted for the Sptlc1+/+ and Sptlc1−/− mice (n = 11). (L) The total number of LK cells was plotted for the Sptlc1+/+ and Sptlc1−/− mice (n = 11). (M-O) The total numbers of CMPs, GMPs, and MEPs were plotted for the Sptlc1+/+ and Sptlc1−/− mice (n = 11). All graphs data are represented as mean ± SEM. P < .05 is significant, calculated from the unpaired Student t test.
We analyzed the LK compartment for progenitors including CMPs (CD34+; FcR−), GMPs (CD34+; FcR+), and MEPs (CD34−; FcR−) (supplemental Figure 3H).35 Overall, LK cells were significantly reduced (2.1-fold) in the BM of chimeric Sptlc1−/− mice (Figure 3L). The donor CMPs (3.5-fold) and GMPs (threefold) were also reduced in Sptlc1−/− (Figure 3M-N). The MEP population was not significantly affected in the Sptlc1−/− BM at this time (Figure 3O), which confirms the observation that erythropoiesis is less affected than granulopoiesis. Taken together, these results suggest a defect in the production of CMPs/GMPs from MPPs whereas the generation of MEPs is not compromised.
Single-cell RNA-seq reveals lack of committed myeloid progenitors
We performed single-cell RNA-seq analysis on fluorescence-activated cell sorter (FACS)-purified MPP and LK populations of cells to understand the underlying transcriptional landscape of differentiating cells.36,37 The Sptlc1+/+ and Sptlc1−/− LK data sets were integrated and analyzed as 1 data set, allowing identification of cell types and markers conserved in both data sets and also comparison of the data sets due to SPTLC1 deletion within the clusters. The 2 data sets were integrated using canonical correlation analysis (CCA) to identify the common source of variation and then single integrated analysis on all the cells was performed using T-distributed stochastic neighbor embedding (t-SNE). This resulted in 16 clusters (C0-C15) and all clusters except C13 (only Sptlc1+/+ cells) and C14 (only Sptlc1−/− cells) had cells from both data sets (Figure 4A-B). The clusters were identified based on the expression of known lineage and stem cell markers.38 Cluster C0 expresses erythroid progenitor markers Kif1, Apoe, Gata1, Gata2, Car1/2, Meis1, and Itga2b (CD41), suggesting that it belongs to the MEP population (supplemental Figure 4A). Clusters C2, C6, and C15 express erythroid markers, and with the exception of C15 they express late erythroid marker Rhd, suggesting that they are more committed to forming erythroid progenitors (supplemental Figure 4A). Clusters C1, C3, C4, C5, C7, C9, and C13 express myeloid markers Elane, Ctsg, and Prtn3, suggesting myeloid-primed clusters (supplemental Figure 4B). However, clusters C1 and C9 also express granulocyte-specific marker Cebpe, suggesting a granulocytic bias in this cluster, whereas C3, C5, and C7 express Irf8, suggesting a monocytic fate (supplemental Figure 4B). C11 is a cell cluster expressing markers of dendritic cells (Cd74 and Irf8) and C8 displays markers of the megakaryocyte lineage (Pf4) (supplemental Figure 4B-C). Heat maps showing relative expression of these cluster-specific markers between the 2 genetic backgrounds clearly illustrate the downregulation of myeloid genes in the Sptlc1−/− LK cells in all clusters (Figure 4C). Violin plots for the myeloid gene Mpo showed a significant decrease in the Sptlc1−/− LK cells within individual clusters (Figure 4D). The relative expression of erythroid markers was not changed significantly between the Sptlc1+/+ and Sptlc1−/−, however the number of cells expressing erythroid markers were significantly higher in Sptlc1−/− LK clusters (Figure 4C,E). This indicates that in the Sptlc1−/− BM LK population, cells were more frequently primed for the erythroid lineage (∼65% cells) than the myeloid lineage (∼16% cells). On the other hand, Sptlc1+/+ LK cells showed a myeloid bias with ∼50% cells primed for myeloid lineage and ∼20% cells primed for erythroid lineage. Both Sptlc1+/+ (∼24%) and Sptlc1−/− (∼14%) LK cells had clusters of cells with markers indicating multilineage potential, albeit to a lesser degree in Sptlc1−/− (Figure 4F).

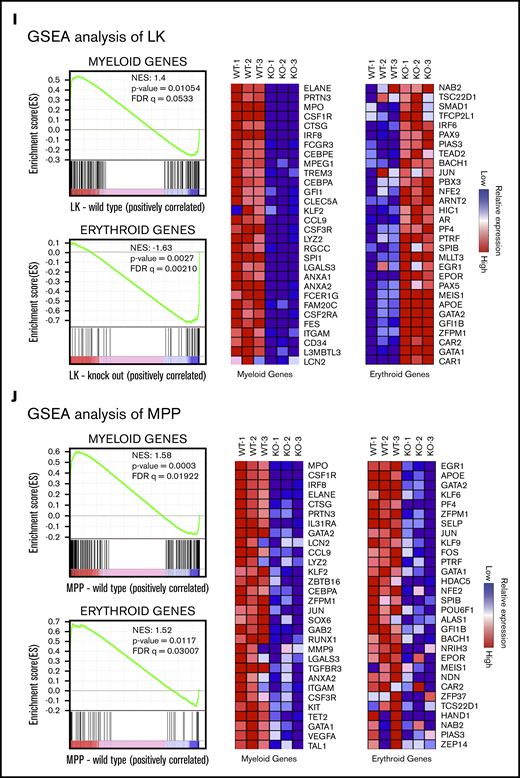
Single-cell transcription and GSEA profiles of LK and MPP cells from Sptlc1+/+and Sptlc1−/−. (A) A total of 3140 Sptlc1+/+ and 2808 Sptlc1−/− cells identified as LK by flow cytometry were divided into clusters based on individual gene-expression profiles. The plot shows a 2-dimensional representation (t-SNE) of transcriptome profiles of the Sptlc1+/+ and Sptlc1−/−, with each cluster highlighted in a different color. The integrated Sptlc1+/+ and Sptlc1−/− cells were represented in t-SNE plots. (B) The percentage of cells expressing relative lineage-specific markers in individual clusters from Sptlc1+/+ and Sptlc1−/− LK populations. (C) Heat maps of Sptlc1+/+ and Sptlc1−/− LK populations expressing myeloid-specific gene markers (Mpo, Elane, Ctsg, Prtn3, Irf8, and Cebpe) and erythroid-specific gene markers (Apoe, Klf1, Rhd, Hba.a1, Gata1, Gata2, Car1, and Car2). (D) Violin plots of the distributions of expression of Mpo, marker of the myeloid population, in LK cells. Comparison of expression levels for LK cells in clusters C1, C3, C4, C5, C7, and C9 of Sptlc1+/+ and Sptlc1−/− is shown. (E) Violin plots of the distributions of expression of Car2, a marker of the erythroid population. Comparison of expression levels for LK cells in clusters C2 and C5 of Sptlc1+/+ and Sptlc1−/− is shown. (F) The percentage of myeloid, erythroid, and multilineage cells in the Sptlc1+/+ and Sptlc1−/− LK populations. (G) A total of 3099 Sptlc1+/+ and 1997 Sptlc1−/− cells identified as MPPs by flow cytometry were divided into clusters based on individual gene-expression profiles. The plot shows a 2-dimensional representation (t-SNE) of transcriptome profiles of the Sptlc1+/+ and Sptlc1−/−, with each cluster highlighted in a different color. The integrated Sptlc1+/+ and Sptlc1−/− data set was represented in a t-SNE plot. (H) Violin plots of the distributions of expression of Hspa5 and Pdia6, indicators of ER stress, in Sptlc1+/+ and Sptlc1−/− MPP cells. (I-J) GSEA analysis of RNA-seq data showing indicated gene sets with differentially regulated genes between Sptlc1+/+ and Sptlc1−/− in LK (I) and MPP (J) cell populations, respectively. Heat map of top 30 genes were displayed. Relative expression levels are indicated. FDR, false discovery rate; NES, normalized enrichment score.
Single-cell transcription and GSEA profiles of LK and MPP cells from Sptlc1+/+and Sptlc1−/−. (A) A total of 3140 Sptlc1+/+ and 2808 Sptlc1−/− cells identified as LK by flow cytometry were divided into clusters based on individual gene-expression profiles. The plot shows a 2-dimensional representation (t-SNE) of transcriptome profiles of the Sptlc1+/+ and Sptlc1−/−, with each cluster highlighted in a different color. The integrated Sptlc1+/+ and Sptlc1−/− cells were represented in t-SNE plots. (B) The percentage of cells expressing relative lineage-specific markers in individual clusters from Sptlc1+/+ and Sptlc1−/− LK populations. (C) Heat maps of Sptlc1+/+ and Sptlc1−/− LK populations expressing myeloid-specific gene markers (Mpo, Elane, Ctsg, Prtn3, Irf8, and Cebpe) and erythroid-specific gene markers (Apoe, Klf1, Rhd, Hba.a1, Gata1, Gata2, Car1, and Car2). (D) Violin plots of the distributions of expression of Mpo, marker of the myeloid population, in LK cells. Comparison of expression levels for LK cells in clusters C1, C3, C4, C5, C7, and C9 of Sptlc1+/+ and Sptlc1−/− is shown. (E) Violin plots of the distributions of expression of Car2, a marker of the erythroid population. Comparison of expression levels for LK cells in clusters C2 and C5 of Sptlc1+/+ and Sptlc1−/− is shown. (F) The percentage of myeloid, erythroid, and multilineage cells in the Sptlc1+/+ and Sptlc1−/− LK populations. (G) A total of 3099 Sptlc1+/+ and 1997 Sptlc1−/− cells identified as MPPs by flow cytometry were divided into clusters based on individual gene-expression profiles. The plot shows a 2-dimensional representation (t-SNE) of transcriptome profiles of the Sptlc1+/+ and Sptlc1−/−, with each cluster highlighted in a different color. The integrated Sptlc1+/+ and Sptlc1−/− data set was represented in a t-SNE plot. (H) Violin plots of the distributions of expression of Hspa5 and Pdia6, indicators of ER stress, in Sptlc1+/+ and Sptlc1−/− MPP cells. (I-J) GSEA analysis of RNA-seq data showing indicated gene sets with differentially regulated genes between Sptlc1+/+ and Sptlc1−/− in LK (I) and MPP (J) cell populations, respectively. Heat map of top 30 genes were displayed. Relative expression levels are indicated. FDR, false discovery rate; NES, normalized enrichment score.
A similar analysis in Sptlc1+/+ and Sptlc1−/− MPP cells resulted in 12 clusters (Figure 4G) with similar percentages of cells from both data sets in all clusters except C6 and C11 (supplemental Figure 4D). Cluster C6 showed dendritic cell fate as it expressed Cd74 and Irf8 (supplemental Figure 4E). Interestingly, cluster C11 contained very few cells and was almost exclusively composed of Sptlc1−/− MPPs (41 cells vs 2 Sptlc1+/+ cells) (supplemental Figure 4F). Clusters C0, C1, C2 C4, C5, C7, C10, C11, and C12 express not only myeloid marker Mpo but also erythroid markers Apoe and Meis1, suggesting multilineage potential. In addition, cells in cluster C5 express Irf8 and Elane, suggesting granulocyte-macrophage bias. Only 1 cluster, C8, expresses both the erythroid markers Apoe and Gata1 (supplemental Figure 4G); curiously, Sptlc1−/− MPP displays a twofold increase in this cluster of cells whereas the rest of the myeloid clusters were similarly populated by both cell types (supplemental Figure 4H). Cluster C11 expressed myeloid markers Mpo and Elane, suggesting that this was a committed myeloid cluster. Intriguingly, this cluster of MPP cells from Sptlc1−/− expresses the ER stress genes Pdia4, Hspa5, Pdia6, Xbp1, and Hsp90b1 (Figure 4H; supplemental Figure 4I). In conclusion, single-cell RNA-seq analysis of MPP and LK cells indicates that the defects in myelopoiesis in Sptlc1−/− cells mostly begin in the LK compartment.
The analysis of the LK compartment complemented the FACS data in confirming the proportion of different lineages, however, we did not obtain information regarding possible defects in the myeloid progenitors. Total RNA-seq analysis was also performed at an earlier time point, 7 days after poly(I:C) injection. Although RNA-seq analysis generally confirmed the findings of the single-cell RNA-seq experiment, we were unable to obtain potential mechanistic insight into defects in myeloid differentiation in Sptlc1−/− BMCs. Hallmark pathway analysis data are shown in supplemental Figure 4J. In HSCs and MPPs, we see upregulation of MYC targets, mTORC1 signaling and oxidative phosphorylation pathway genes in the mutant, whereas in the LK compartment these genes are upregulated in the wild-type cells. Interestingly, heme metabolism genes are upregulated in all 3 examined compartments of the Sptlc1−/−. As observed in single-cell RNA-seq analysis, gene-set enrichment analysis (GSEA) profiles indicated that genes of myeloid lineage were abundant in the wild-type LK compartment whereas the mutant was enriched for erythroid markers (Figure 4I). Surprisingly, the control MPPs in general had more robust expression of both myeloid and erythroid lineage genes compared with the mutant cells (Figure 4J). Although this highlights a differential expression pattern, the mutant MPPs are still capable of robustly differentiating into MEPs and mature erythrocytes. Although both single-cell RNA-seq and total RNA-seq data confirm the loss of myeloid progenitors in the LK compartment, we were unable to decipher a cause for failure of myeloid differentiation in Sptlc1−/− BM.
Differentiation defects in Sptlc1−/− BM cells in culture
To determine the mechanism(s) for how loss of Sptlc1 prevents myeloid cell development, we used in vitro BMC culture experiments.26 Granulocyte/macrophage colony formation was reduced by 72% for the LSK and 75% for the LK cells derived from the Sptlc1−/− chimeric mice (7 days) (Figure 5A-B). In liquid medium containing interleukin 3 (IL-3) and granulocyte macrophage colony-stimulating factor (GM-CSF), Sptlc1−/− Lin− cells showed a 92.7% reduction in Mac-1+Gr-1+ cells compared with the control after 4 days of culture (Figure 5C-D). Similar results were obtained with BMCs obtained from direct injection of poly(I:C) (supplemental Figure 5A). Cytocentrifuge preparations of Sptlc1−/− BMC cultures confirmed the block in myeloid development (supplemental Figure 5B-D). Cleaved caspase 3 was increased in these cells, suggesting that Sptlc1−/− cells were undergoing apoptosis, which could account for the decrease in cell viability observed in these cultures (Figure 5E; supplemental Figure 5E). Annexin V and propidium iodide (PI)–positive cells were increased in the LK but not the LSK cells of the Sptlc1−/− in chimeric mice 21 days after the Sptlc1 deletion, indicating that SPTLC1 is more critical for LK survival in vivo (Figure 5F-G). BMCs were cultured in erythropoietin (EPO), IL-3, stem cell factor (SCF), and insulin to promote erythroid differentiation. Differentiation of Sptlc1−/− BMCs along the erythroid lineage was not compromised in vitro, mimicking the in vivo situation (Figure 5H; supplemental Figure 5F). Erythroid colony formation was also not compromised in Sptlc1−/− (Figure 5I).

Myeloid differentiation defects in Sptlc1−/−BMCs. In vitro culture. (A-B) The total numbers of CFUs for Sptlc1+/+ and Sptlc1−/− FACS-sorted LK and LSK cells. The results are from 4 Sptlc1+/+ and 4 Sptlc1−/− mice. (C) Sptlc1+/+ and Sptlc1−/− Lin− cells were induced to differentiate in liquid culture with medium containing GM-CSF and IL-3. After 4 days, cells were stained for Mac-1 and Gr-1. The results are from 3 Sptlc1+/+ and 3 Sptlc1−/− mice. (D) The percentage of Mac-1+Gr-1+ cells was plotted for Sptlc1+/+ and Sptlc1−/−. (E) Western blot analysis of cell extracts from BMCs cultured in the presence of GM-CSF and IL-3 for 4 days. Sptlc1+/+ and Sptlc1−/− lysates were probed for caspase 3. (F) The percentages of LK cells staining positive for annexin V and PI were plotted for 4 Sptlc1+/+ and 4 Sptlc1−/− 21 days after poly(I:C) injection. (G) The percentages of LSK cells staining positive for annexin V and PI were plotted for 4 Sptlc1+/+ and 4 Sptlc1−/− 21 days after poly(I:C) injection. (H) The percentage of CD71−Ter119+ cells was plotted for Sptlc1+/+ and Sptlc1−/− cells. (I) The total numbers of CFU-E for Sptlc1+/+ and Sptlc1−/− FACS-sorted LSK cells. The results are from technical triplicates of samples from 3 Sptlc1+/+ and 3 Sptlc1−/− mice. Representative photographs of LSKs differentiating into erythroid colonies taken after 10 days of solid culture (bright field microscopy; original magnification ×2). (J) Lin− cells isolated from Sptlc1+/+ and Sptlc1−/− mice cultured in the presence of mSCF and IL-3 for 3 days, serum starved for 3 hours followed by stimulated with GM-CSF (50 ng/mL) for 10 minutes at 37°C. Western blots for p-AKT, p-ERK1/2, and p-STAT3 and their respective dephosphorylated forms. Data representative of 3 independent experiments. (J′) Quantitative data representative of 3 independent experiments. All graphs are represented as mean ± SEM. P < .05 is significant, calculated from the unpaired Student t test.
Myeloid differentiation defects in Sptlc1−/−BMCs. In vitro culture. (A-B) The total numbers of CFUs for Sptlc1+/+ and Sptlc1−/− FACS-sorted LK and LSK cells. The results are from 4 Sptlc1+/+ and 4 Sptlc1−/− mice. (C) Sptlc1+/+ and Sptlc1−/− Lin− cells were induced to differentiate in liquid culture with medium containing GM-CSF and IL-3. After 4 days, cells were stained for Mac-1 and Gr-1. The results are from 3 Sptlc1+/+ and 3 Sptlc1−/− mice. (D) The percentage of Mac-1+Gr-1+ cells was plotted for Sptlc1+/+ and Sptlc1−/−. (E) Western blot analysis of cell extracts from BMCs cultured in the presence of GM-CSF and IL-3 for 4 days. Sptlc1+/+ and Sptlc1−/− lysates were probed for caspase 3. (F) The percentages of LK cells staining positive for annexin V and PI were plotted for 4 Sptlc1+/+ and 4 Sptlc1−/− 21 days after poly(I:C) injection. (G) The percentages of LSK cells staining positive for annexin V and PI were plotted for 4 Sptlc1+/+ and 4 Sptlc1−/− 21 days after poly(I:C) injection. (H) The percentage of CD71−Ter119+ cells was plotted for Sptlc1+/+ and Sptlc1−/− cells. (I) The total numbers of CFU-E for Sptlc1+/+ and Sptlc1−/− FACS-sorted LSK cells. The results are from technical triplicates of samples from 3 Sptlc1+/+ and 3 Sptlc1−/− mice. Representative photographs of LSKs differentiating into erythroid colonies taken after 10 days of solid culture (bright field microscopy; original magnification ×2). (J) Lin− cells isolated from Sptlc1+/+ and Sptlc1−/− mice cultured in the presence of mSCF and IL-3 for 3 days, serum starved for 3 hours followed by stimulated with GM-CSF (50 ng/mL) for 10 minutes at 37°C. Western blots for p-AKT, p-ERK1/2, and p-STAT3 and their respective dephosphorylated forms. Data representative of 3 independent experiments. (J′) Quantitative data representative of 3 independent experiments. All graphs are represented as mean ± SEM. P < .05 is significant, calculated from the unpaired Student t test.
Loss of SPTLC1 decreased sphingomyelin levels (Figure 1B), which is normally present at the plasma membrane. This decreased sphingomyelin could affect cytokine signaling in myeloid cells. To test this, Sptlc1+/+ and Sptlc1−/− Lin− cells were isolated, cultured in murine SCF (mSCF) and IL-3 for 3 days, serum starved for 3 hours, then stimulated with 50 ng/mL GM-CSF, macrophage colony-stimulating factor (M-CSF), and granulocyte colony-stimulating factor (G-CSF) for 10 minutes. GM-CSF receptor signaling, including phosphorylated AKT (p-AKT), phosphorylated extracellular signal-regulated kinase (p-ERK1/2), and phosphorylated STAT3 (p-STAT3) were not decreased but ERK1/2 and STAT3 rather showed slightly higher phosphorylation levels in the mutant (Figure 5J-J′). Similarly, signaling via M-CSF and G-CSF was not compromised (supplemental Figure 5G-H). These experiments suggest that lowered sphingomyelin does not impair the signal transduction process.
ER stress disrupts granulopoiesis
Many lipid biosynthetic pathways operate within the membrane environs of the ER, and dysregulation of these pathways has been proposed to induce ER stress and activate the unfolded protein response (UPR).39-41 Therefore, we evaluated whether differentiating mutant cells exhibited ER stress and activation of the UPR. Nucleated BMCs were isolated from Sptlc1+/+ and Sptlc1−/− mice 3 days after poly(I:C) injection and analyzed for expression of UPR proteins by western blotting. The levels of Grp78 (binding immunoglobulin protein [BiP]) and cleaved protein kinase R-line endoplasmic reticulum kinase (PERK) products were increased in the Sptlc1−/− BMCs (Figure 6A-A′). CMP/GMPs isolated from these mice also showed elevated Xbp1s splice product compared with the Sptlc1+/+ controls (supplemental Figure 6A). In addition, we found that BMC cultures of Sptlc1−/− that were induced to differentiate along myeloid lineage displayed higher expression of Grp78, p-IRE1α (p-inositol–requiring transmembrane kinase/endonuclease 1α), PERK, and protein disulfide isomerase (PDI) than control cultures, although calreticulin, a ER-resident protein, remained unchanged, mirroring the difference noted earlier in the nucleated BM samples (Figure 6B-B′).42 We also observed an increase in Grp78 in the Gr1+ and LK cells but not in LSK cells by flow cytometry in chimeric mice 4 days after Sptlc1 deletion (Figure 6C-E; supplemental Figure 6B-D). Evidence of ER stress was also observed when we examined the mutant progenitor population that was derived from the Lin− cells (supplemental Figure 6E).

Sptlc1−/−BMCs exhibit ER stress that compromises myeloid differentiation. (A) Western blot analysis of Sptlc1+/+ and Sptlc1−/− BM cells harvested 3 days after poly(I:C) injection. Lysates were probed for Grp78 and PERK. Cleaved PERK products were detectable in the Sptlc1−/−. (A′) Quantitative data representative of 3 independent experiments. (B) Western blot analysis of cell extracts of Sptlc1+/+ and Sptlc1−/− BMCs cultured for 4 days in the presence of GM-CSF and IL-3. Lysates were probed for Grp78, p-IRE1α, PERK, PDI, and calreticulin. (B′) Quantitative data representative of 3 independent experiments. (C-E) The Grp78 (BiP) staining of Gr1, LK, and LSK cells was plotted for 5 Sptlc1+/+ and 5 Sptlc1−/− BMT mice, analyzed 4 days after poly(I:C) injection (n = 5). (F) The wild-type BM cells were cultured in the presence of GM-CSF and IL-3 factors in liquid culture with dimethyl sulfoxide (DMSO) (control) and Tg (10 nM) for 2 days and stained for Mac-1 and Gr-1. The percentage of Mac-1+Gr-1+ cells was plotted for control and Tg-treated cells (n = 6). (G) Western blot analysis of Grp78 and PDI for lysates from control and Tg-treated cells. Lanes: 1, nucleated BMCs (before culture); 2, control; and 3, Tg-treated cells. (H) The percentages of radiolabeled fatty acids were plotted for the Sptlc1+/+ and Sptlc1−/−. (I) Wild-type BM cells were cultured in the presence of GM-CSF and IL-3 with bovine serum albumin (BSA) (control) and with sodium palmitate (200 μM) for 4 days. The cells were stained for Mac-1 and Gr-1. The percentage of Mac-1+Gr-1+ cells was plotted for control and palmitate-treated cells (n = 6). (J) Western blots of Grp78 and PDI for lysates of control and palmitate-treated cells. Lanes: 1, nucleated BMCs; 2, control; and 3, palmitate-treated cells. (K) The percentage of CD71−Ter119+ cells was plotted for control and Tg-treated cells (n = 7). (L) The percentage of CD71−Ter119+ cells was plotted for control and palmitate-treated cells (n = 7). All graphs are represented as mean ± SEM. P < .05 is significant, calculated from the unpaired Student t test.
Sptlc1−/−BMCs exhibit ER stress that compromises myeloid differentiation. (A) Western blot analysis of Sptlc1+/+ and Sptlc1−/− BM cells harvested 3 days after poly(I:C) injection. Lysates were probed for Grp78 and PERK. Cleaved PERK products were detectable in the Sptlc1−/−. (A′) Quantitative data representative of 3 independent experiments. (B) Western blot analysis of cell extracts of Sptlc1+/+ and Sptlc1−/− BMCs cultured for 4 days in the presence of GM-CSF and IL-3. Lysates were probed for Grp78, p-IRE1α, PERK, PDI, and calreticulin. (B′) Quantitative data representative of 3 independent experiments. (C-E) The Grp78 (BiP) staining of Gr1, LK, and LSK cells was plotted for 5 Sptlc1+/+ and 5 Sptlc1−/− BMT mice, analyzed 4 days after poly(I:C) injection (n = 5). (F) The wild-type BM cells were cultured in the presence of GM-CSF and IL-3 factors in liquid culture with dimethyl sulfoxide (DMSO) (control) and Tg (10 nM) for 2 days and stained for Mac-1 and Gr-1. The percentage of Mac-1+Gr-1+ cells was plotted for control and Tg-treated cells (n = 6). (G) Western blot analysis of Grp78 and PDI for lysates from control and Tg-treated cells. Lanes: 1, nucleated BMCs (before culture); 2, control; and 3, Tg-treated cells. (H) The percentages of radiolabeled fatty acids were plotted for the Sptlc1+/+ and Sptlc1−/−. (I) Wild-type BM cells were cultured in the presence of GM-CSF and IL-3 with bovine serum albumin (BSA) (control) and with sodium palmitate (200 μM) for 4 days. The cells were stained for Mac-1 and Gr-1. The percentage of Mac-1+Gr-1+ cells was plotted for control and palmitate-treated cells (n = 6). (J) Western blots of Grp78 and PDI for lysates of control and palmitate-treated cells. Lanes: 1, nucleated BMCs; 2, control; and 3, palmitate-treated cells. (K) The percentage of CD71−Ter119+ cells was plotted for control and Tg-treated cells (n = 7). (L) The percentage of CD71−Ter119+ cells was plotted for control and palmitate-treated cells (n = 7). All graphs are represented as mean ± SEM. P < .05 is significant, calculated from the unpaired Student t test.
To validate whether ER stress was detrimental for granulopoiesis, we used thapsigargin (Tg), a drug that induces ER stress by inhibiting ER Ca2+ ATPase (sarcoplasmic reticulum calcium transport ATPase) activity.43 BMCs differentiated along myeloid lineage in the presence of Tg exhibited a 42.4% decrease in Mac-1+Gr-1+ cells than the control (Figure 6F; supplemental Figure 6F). Grp78 and PDI were elevated and Giemsa-stained cytocentrifuged slides reveal a scarcity of myeloid cells (Figure 6G; supplemental Figure 6G).
To study whether the absence of SPTLC1 affects the levels of its substrate, fatty acid, we metabolically labeled Sptlc1+/+ and Sptlc1−/− BMCs with [14C] acetate for 36 hours in medium containing IL-3 and GM-CSF and resolved the lipids on thin layer chromatography (supplemental Figure 6H). Fatty acid levels in the Sptlc1−/− were found to be >2.5-fold higher than in the control (Figure 6H).
To test whether palmitate could induce ER stress and diminish myeloid differentiation as observed in the Sptlc1−/−, we treated wild-type BMCs with 200 μM sodium palmitate for 4 days.44 These cultures showed a substantial decrease in Mac-1+Gr-1+ cells (Figure 6I; supplemental Figure 6I-J) and Grp78 and PDI expression levels were increased (Figure 6J). We observed no significant changes in the numbers of immature erythroid cells in the Tg-treated cultures compared with control cultures (Figure 6K; supplemental Figure 6K). Similarly, in palmitate-treated cultures, no difference was observed in the immature erythroid population (Figure 6L; supplemental Figure 6L), indicating that erythropoiesis was not compromised by Tg- or palmitate-induced ER stress. Myeloid differentiation was also compromised in BM cultures subjected to treatment with other ER stress inducers such as tunicamycin and 2-deoxyglucose, thus confirming that ER stress affects myeloid differentiation (supplemental Figure 6M-N). Collectively, these results support the notion that acute accumulation of palmitic acid could contribute to the ER stress in part, in turn interfering with the process of myelopoiesis while sparing erythropoiesis.
Discussion
Sphingolipids are integral membrane components and changes in their metabolic flux are anticipated to impact organelle physiology. Deficiency of ceramide phosphoethanolamine in Drosophila leads to defects at the plasma membrane, resulting in accelerated aging and photosensitive epilepsy; increased ceramide affects organismal homeostasis requiring adaptations involving glycolytic and lipolytic pathways.45-47 De novo biosynthesis of sphingolipids is initiated in the ER, a dynamic tubular structure that is not only involved in the synthesis of lipids, but is also the primary site for the biosynthesis, maturation, and folding of proteins for the secretory pathway. Missense mutations in Sptlc1 and Sptlc2 cause autosomal-dominant hereditary sensory neuropathy.48 Cultures of lymphoblast from the Sptlc1 mutant patients had defects in mitochondria. They also exhibited decreased BiP and Ero1-Lα expression, indicating ER dysfunction.49 Recently, it was shown that wild-type CD8+ T cells require SPTLC2 function to promote metabolic fitness and hereditary sensory autonomic neuropathy-1 patients and mice null for the Sptlc2 gene were found to be defective in CD8+ T function due to ER stress.50 High-density lipoprotein–bound sphingosine 1-phosphate has been shown to suppress lymphopoiesis.51
The functional studies reported here reveal a vital and distinct function for Sptlc1 in hematopoiesis. Initial identification of its role in hematopoiesis came from the CKO allele using Mx1-Cre–induced ablation in the HSCs. Sptlc1-deleted mice show severe hematopoietic defects and die soon after the deletion of the gene. Transplantation studies recapitulate the hematopoietic phenotype confirming its intrinsic role. Specifically, loss of Sptlc1 in adult chimeric mice leads to an initial expansion of MPPs, a decrease in CMPs/GMPs, and a decrease in neutrophil differentiation. Sptlc1−/− mice do not survive beyond 1 month due to blockade in myeloid differentiation. Competitive transplantation experiments provided us with an avenue to distinguish between the cell-autonomous effects of Sptlc1 from the superimposed effects due to compensatory mechanisms. In the absence of peripheral cytopenia, the contribution of the Sptlc1−/− cells to HSCs, progenitors, and the lineage-positive cells is rapidly reduced. The loss of mature blood cells elicits compensatory stress-induced hematopoiesis in the noncompetitive setting.52 The limited myeloproliferative phenotype in the CKO is explained by ER stress following Sptlc1 deletion in the progenitor population attributed, at least in part, to accumulation of palmitic acid. The mutant shows a significant increase in the fatty acids, and it is known that palmitic and stearic acids induce ER stress in hepatocytes.44 We found that addition of palmitate to myeloid cultures induces ER stress and causes a decrease in granulocyte formation similar to the phenotype observed in the Sptlc1−/−. This contribution can be further substantiated by combining Sptlc1 and Atgl double knockout using Mx-1Cre–deleted conditional alleles. The loss of adipose triglyceride lipase should help address whether hydrolysis of triacylglycerol influences the steady-state level of fatty acid. Reducing its contribution in the double mutant could mitigate the component of ER stress arising from decreased utilization by the de novo sphingolipid biosynthetic pathway in Sptlc1 null mice.53,54 The lack of sphingolipid metabolic flux in the ER could also induce stress in the Sptlc1 mutant mice. The ER is a sensor that collates signals from varied sources and responds appropriately during growth and division of a cell.55 It is widely connected within the cell to other organelles and is therefore a functionally and architecturally complex intracellular hub.56 Given that progenitor cells are committing to lineages endowed with unique functions, it is likely that the ER undergoes profound changes during these stages of commitment and is thus sensitive to perturbations of ER function. Indeed, when the RNA isolated for RNA-seq was probed for 701 ER-associated genes from the MSigDB (software.broadinstitute.org/gsea/msigdb/collections.jsp#H), we find an enrichment for these genes in the control LK population compared with the MPP cells (supplemental Figure 7A). Such enrichment was not found when HSCs were compared with MPP (not shown) or even in the Sptlc1 mutant LK cells (supplemental Figure 7B), indicating that perhaps such enrichment was mostly confined to the myeloid progenitor cells that were severely reduced in the mutant BMCs. Because the Sptlc1 mutant LK cells do not show enrichment of ER genes, a comparison of LK cells of Sptlc1+/+ and Sptlc1−/− shows an enrichment in the wild-type compared with the mutant (not shown).
Several of the enzymes of the sphingolipid biosynthetic pathway and their associated metabolites have been reported to be correlated with acute and chronic myeloid leukemia.57 No correlation of SPTLC1 status to myeloid malignancies has been reported. Given that SPTLC1 deficiency results in poor myeloid differentiation and expansion of the LSK compartment, it would be interesting to examine whether the loss of SPTLC function has any correlation to either pathogenesis or outcome of myeloid malignancies.
Acknowledgments
The authors thank Ira Daar, Susan Mackem, Mark Lewandoski, and Terry Yamaguchi for critical comments on the manuscript.
This work was supported by the intramural division of the National Cancer Institute, National Institutes of Health (Division of Health and Human Services). U.A. was supported by National Institutes of Health, National Institute of General Medical Sciences grant R01GM110288.
The content of this publication does not necessarily reflect the views or policies of the Department of Health and Human Services, nor does mention of trade names, commercial products, or organizations imply endorsement by the US government.
Authorship
Contribution: V.P., U.A., J.R.K., and J.K.A. conceived the study and designed the experiments; V.P., D.A., S.M.S., J.L., D.G.M., T. Abimannan, L.B., K.D.K., N.V., and D.B. performed the experiments; S.D.F. and T. Andresson performed mass spectrometric analysis of sphingolipids; L.T. assisted in the generation of the knockout mice; and V.P., U.A., and J.K.A. wrote and edited the manuscript with assistance from all the authors.
Conflict-of-interest disclosure: The authors declare no competing financial interests.
The current affiliation for D.A. is MaxCyte, Inc, Gaithersburg, MD.
The current affiliation for S.M.S. is Department of Radiation Oncology, City of Hope National Medical Center, Duarte, CA.
The current affiliation for J.L. is US Food and Drug Administration, Silver Spring, MD.
The current affiliation for K.D.K. is Basic Science Program, Leidos Inc, Frederick National Laboratory for Cancer Research, Frederick, MD.
The current affiliation for J.R.K. is Basic Science Program, Leidos Inc, Frederick National Laboratory for Cancer Research, Frederick, MD.
Correspondence: Jairaj K. Acharya, National Cancer Institute, Room 22-90B, Building 560, 1050 Boyle St, Frederick, MD 21702; e-mail: acharyaj@mail.nih.gov.

