

Key Points
First description of the relevance of the CAR engineering approach to develop CAR-CD8+ Tregs for clinical trials in transplantation.
A2-CAR CD8+ Treg interactions with HLA-A*02+ ECs induce a noncytotoxic fine-tuned and protolerogenic activation of ECs.

Abstract
Polyclonal CD8+CD45RClow/− Tregs are potent regulatory cells able to control solid organ transplantation rejection and even induce tolerance. However, donor major histocompatibility complex (MHC)–specific Tregs are more potent than polyclonal Tregs in suppressing T-cell responses and preventing acute as well as chronic rejection in rodent models. The difficulty of identifying disease-relevant antigens able to stimulate Tregs has reduced the possibility of obtaining antigen-specific Tregs. To bypass this requirement and gain the advantage of antigen specificity, and thus improve the therapeutic potential of CD8+ Tregs, we stably introduced a chimeric antigen receptor (CAR) derived from a HLA-A*02 antigen-specific antibody (A2-CAR) in human CD8+ Tregs and developed a clinically compatible protocol of transduction and expansion. We demonstrated that A2-CAR CD8+ Tregs were not phenotypically altered by the process, were specifically activated, and did not exhibit cytotoxic activity toward HLA-A*02+ kidney endothelial cells (ECs). We showed that A2-CAR CD8+ Tregs were more potent suppressors of immune responses induced by HLA-A*02 mismatch than control-CAR CD8+ Tregs, both in vitro and in vivo, in models of human skin graft rejection and graft-versus-host disease (GVHD) in NOD.Cg-PrkdcscidIl2rgtm1Wjl/SzJ (NSG) mice. We showed that integrity of human skin graft was preserved with A2-CAR CD8+ Tregs at least 100 days in vivo after administration, and that interaction between the A2-CAR CD8+ Tregs and HLA-A*02+ kidney ECs resulted in a fine-tuned and protolerogenic activation of the ECs without cytotoxicity. Together, our results demonstrated the relevance of the CAR engineering approach to develop antigen-specific CAR-CD8+ Tregs for clinical trials in transplantation, and potentially in other diseases.
Introduction
Organ transplantation and graft-versus-host disease (GVHD) need new therapeutics that will avoid or reduce immunosuppression and at the same time reduce acute rejection and chronic allograft dysfunction, as well as acute and chronic GVHD.1-3 Immunointerventions aiming to induce tolerance have been applied both in animal models and patients.4 Cell therapy and infusion of regulatory T cells (Tregs) is a particularly novel and potentially important new treatment, with several clinical trials that have shown the absence of toxicity, using polyclonal CD4+ Tregs.5-7 Several reports have shown that donor-specific CD4+ Tregs and CD8+ Tregs are more potent than polyclonal Tregs in suppressing T-cell responses and preventing acute as well as chronic rejections in mouse models.8-13 In recent years, T-cell immunotherapy using chimeric antigen receptors (CARs) conferring precise antigen specificity to CD4+ and CD8+ T cells have given outstanding results in the treatment of leukemia and lymphomas.14
In a less-explored strategy, CD4+ Tregs have been modified to express CARs directed against tissue antigens in autoimmunity, immunogenic therapeutic proteins, or donor alloantigens, and have allowed targeted suppression of tissue-destructive immune responses in animal models (see Maldini et al15 for a review). In transplantation, recent publications showed that CD4+ Tregs expressing a CAR with anti-HLA-A*02 binding domains resulted in inhibition of human HLA-A*02+ skin graft rejection or GVHD mediated by HLA-A*02+ peripheral blood mononuclear cells (PBMCs) in immunodeficient NOD.Cg-PrkdcscidIl2rgtm1Wjl/SzJ (NSG) mice.16-18 These models showed that a CAR with single alloantigen specificity (HLA-A*02) could confer graft protection against other alloantigens because the HLA incompatibilities between donors and recipients were not limited to HLA-A*02.
CD8+ Tregs have now been identified and analyzed in a variety of models and human diseases, including organ transplantation and GVHD,19 and have characteristics that make them a potential option or combinatorial therapy to CD4+ Tregs (for a review, see Bézie et al20 ). We and others have described CD8+CD45RClow/− Tregs in human19 and rat.13,21-23 In certain models of tolerance induction, both CD4+ and CD8+ Tregs are induced,24-26 and in other models, CD8+ Tregs play a major role vs CD4+ Tregs.21,27 Interestingly, CD4+ and CD8+ Tregs have been shown to have additive or synergistic effects.28 Furthermore, CD8+ Tregs have been shown to induce CD4+ Tregs that suppress graft rejection concurrently.29 Human CD8+CD45RClow/− Tregs show excellent expansion in vitro, comparable to the CD4+ Tregs ones.19 CD8+ CD45RClow/− Tregs suppress CD4+ and CD8+ T-cell immune responses through the production of interferon γ (IFN-γ),21 fibroleukin-2 (FGL-2),30 and interleukin 34 (IL-34).26 We showed that these cytokines act downstream on endothelial cells (ECs) and dendritic cells (DCs), inducing indoleamine 2,3-dioxygenase (IDO), as well as inducing M2 macrophages (Mregs) and Bregs. Certain CD8+ Tregs mediate their suppressive effect through cytotoxicity,20 but this is not the case for rat22 or human19 CD8+CD45RClow/− Tregs, as well as for other types of CD8+ Tregs.20
To the best of our knowledge, CD8+ Tregs have not been modified by CAR expression, neither in organ transplantation or GVHD nor in any other immune-mediated diseases, such as in autoimmunity. We thus explored as a first proof of concept whether human CD8+ Tregs expressing a CAR directed to HLA-A*02 (A2-CAR CD8+ Tregs) could inhibit solid organ graft rejection and GVHD more efficiently than polyclonal Tregs, as well as the mechanisms involved.
We show that human CD8+ Tregs could be transduced with lentiviral vectors to stably express an anti-HLA-A*02 CAR and expanded in vitro. A2-CAR CD8+ Tregs were significantly more suppressive on CD4+ and CD8+ effector T-cell proliferation in vitro vs polyclonal CD8+ Tregs. A2-CAR CD8+ Tregs were also more suppressor in vivo in models of human HLA-A*02+ skin graft rejection and of GVHD by human HLA-A*02+ PBMCs in NSG mice. A2-CAR CD8+ Tregs were not cytotoxic against HLA-A*02+ ECs and did activate a protective tolerogenic signature in human kidney ECs.
Material and methods
Cell isolation
Blood was collected at the Etablissement Français du Sang from healthy volunteers. PBMCs were purified from blood by Ficoll-Paque density-gradient centrifugation (Eurobio, Courtaboeuf, France). HLA-A*02 expression was defined by flow cytometry. A hypotonic solution and low centrifugation were used to remove remaining red cells and platelets. CD8+ Tregs were obtained by magnetic depletion of monocytes (CD14+, CD16+), NK cells (CD56+), B cells (CD19+), and CD4+ cells, and by fluorescence-activated cell sorter (FACS) Aria IIu (BD Biosciences, Mountain View, CA) sorting based on living (Dapi−) lymphocyte morphology, CD8+ and CD45RClow expression. CD4+CD25− effector T cells, and CD8+CD45RChigh effector T cells were isolated by negative selection of monocytes (CD14+, CD16+), NK cells (CD56+), and B cells (CD19+), and FACS Aria-positive selection of Dapi−CD3+CD4+CD25− cells or CD3+CD4−CD45RChigh cells, respectively. Antigen presenting cells (APCs) were isolated by magnetic depletion of CD3+ cells (OKT3 clone and Dynabeads, Invitrogen) and 35 Gy irradiation. Purity of cell populations was >97%.
CAR Tregs/endothelium interactions were explored in vitro, using banked primary human vascular ECs prospectively isolated from kidney transplant donors (Institut de Transplantation Urologie-Néphrologie, CHU de Nantes) and stored in liquid nitrogen (DIVAT Sample Biocollection, French Health Ministry project number 02G55). ECs were negative for the expression of the Her2 antigen. ECs were isolated and cultured as previously described.31 ECs from HLA-A*02+ and HLA-A*02− carriers were used between cell culture passages 2 and 5.
Lentivirus production
Plasmids recombinant for CARs of second generation specific for HLA-A*02 or for Her2 as irrelevant controls were kindly provided by Megan Levings.17 pRSV-RRE and pMDLg (RRE, gag, pol) and pMD2G (vesicular stomatitis virus G [VSVG] env) recombinant plasmids (Addgene) and lentivirus production protocol were provided by the GenoCellEdit Platform (INSERM UMR 1064-CRTI). Briefly, HEK293T were seeded in Dulbecco’s modified Eagle medium (Thermo Fisher) 10% fetal calf serum (FCS) and transfected with plasmids, using CaCl2. The day after, cells were washed and then cultured in advanced Dulbecco’s modified Eagle medium (Thermo Fisher) free of FCS. At days 2 and 3 after transfection, supernatant was harvested, 0.45 µm filtered, concentrated by 90-minute 25 000 rpm spin, and stored at −80°C. Lentivirus titration was performed on Jurkat cells. Briefly, 1.0 × 10⁵ Jurkat cells were seeded in flat-bottom 96-well plates with a range of lentivirus volumes. Transduction efficiency was assessed by low-affinity nerve growth factor receptor-positive (LNGFR+) and c-Myc+ costaining after 3 days of culture by flow cytometry, and concentration of infectious particles was calculated.
CD8+ Treg lentiviral transduction and expansion protocol
CD8+CD45RClow Tregs and CD8+CD45RChighCD45RA+CCR7− Teffs from HLA-A*02− healthy volunteers were seeded at 105 cells in 100 µL medium per well in 96-well flat-bottom plates previously coated with anti-CD3 monoclonal antibodies (mAbs; clone OKT3, 1 µg/mL, 50 µL per well). Medium used at day 0 was RPMI 1640 (Thermo Fisher), supplemented with penicillin (100 U/mL), streptomycin (0.1 mg/mL), sodium pyruvate (1 mM), glutamine (2 mM), HEPES buffer (1mM), nonessential amino acids (1X), human AB serum (5%, Sigma Aldrich), anti-CD28 mAbs (clone CD28.2, 1 µg/mL), IL-2 (1000 U/mL for Tregs and 100 U/mL for Teffs; Proleukine), IL-15 (10 ng/mL for Tregs and 5 ng/mL for Teffs; Miltenyi Biotec), and IL-7 (5 ng/mL for Teffs only; Miltenyi Biotec). Cells were centrifuged for 1 minute at 430g before incubation overnight (ON) at 37°C 5% CO2. At day 1 and day 2, VSVG-pseudotyped lentivirus encoding for CARs was gently added on cells at multiplicity of infection 10, and the plate was centrifuged for 1 minute at 430g before incubation at 37°C 5% CO2. At day 3, medium was added to reach a 10% human AB serum final concentration that was maintained during the following expansion process. At day 7, cells were harvested and FACS Aria sorted on CAR expression based on LNGFR+ staining, and then newly stimulated with anti-CD3 and anti-CD28 mAbs for a second round of 7 days of expansion. Cytokines were freshly added in culture medium every 2 days, and fresh medium was added when required.
Monoclonal antibodies and flow cytometry
For phenotypic analysis of CAR Tregs, cells were stimulated with PMA (50 ng/mL) and ionomycin (1 μg/mL) for 4 hours in the presence of brefeldin A (10 μg/mL). Fc receptors were blocked (BD Biosciences) and cells were permeabilized using Fixation/Permeabilization kit (Ebiosciences). Antibodies used for the staining are listed in Table 1.
Antibodies
| Marker | Clone | Provider |
|---|---|---|
| Active caspase 3 | C92-605 | BD Biosciences |
| Annexin V | N/A | BD Biosciences |
| BTLA-4 | J168-540 | BD Biosciences |
| CCR4 | 1G1 | BD Biosciences |
| CCR7 | 3D12 | BD Biosciences |
| CD103 | Ber-ACT8 | BD Biosciences |
| CD127 | hIL-7R-M21 | BD Biosciences |
| CD14 | M5E2 | BD Biosciences |
| CD154 | TRAP1 | BD Biosciences |
| CD16 | 3G8 | Homemade |
| CD19 | HIB19 | BD Biosciences |
| CD25 | M-A251 | BD Biosciences |
| CD27 | M-T271 | BD Biosciences |
| CD28 | CD28.2 | Homemade |
| CD3 | OKT3 | Homemade |
| UCHT1 | BD Biosciences | |
| CD4 | RPA-T4 | BD Biosciences |
| CD45 human | HI30 | BD Biosciences |
| CD45 mouse | 30-F11 | BD Biosciences |
| CD45RA | HI100 | BD Biosciences |
| CD45RC | MT2 | IQ Product |
| CD56 | MY31 | BD Biosciences |
| CD62L | DREG-56 | BD Biosciences |
| CD69 | FN50 | BD Biosciences |
| CD8 | RPA-T8 | BD Biosciences |
| CLA | HECA-452 | BD Biosciences |
| CTLA-4 | BNI3 | BD Biosciences |
| CXCR3 | 1C6 | BD Biosciences |
| CXCR5 | RF8B2 | BD Biosciences |
| FasL | NOK-1 | BD Biosciences |
| Foxp3 | 259D/C7 | BD Biosciences |
| GARP | 7B11 | BD Biosciences |
| GITR | 108-17 | Biolegend |
| DT5D3 | Miltenyi | |
| Goat anti-mouse immunoglobulin G | A32728 | Thermo Fisher Scientific |
| Granzyme B | GB11 | BD Biosciences |
| HLA-A*02 | BB7.2 | BD Biosciences |
| HLA-DR | G46-6 | BD Biosciences |
| IFN-γ | B27 | BD Biosciences |
| IL-10 | JES3-9D7 | BD Biosciences |
| IL-34 | # 578416 | R&D Biotechne |
| Integrin β7 | FIB504 | BD Biosciences |
| Involucrin | SY-5 | Sigma |
| LAP | 27232 | R&D Biotechne |
| LNGFR | ME20.4-1.H4 | Miltenyi Biotec |
| Myc | SH1-26E7.1.3 | Miltenyi Biotec |
| PD1 | eBioJ105 (J105) | eBiosciences |
| Perforin | deltaG9 | BD Biosciences |
| Phospho Zap70 | 17A/P-ZAP70 | BD Biosciences |
| Tbet | O4-46 | BD Biosciences |
| TGFβ | TW4-9E7 | BD Biosciences |
| TIM-3 | 7D3 | BD Biosciences |
HLA-A*02 monomers (provided by the P2R Platform, Structure Fédérative de Recherche [SFR], Nantes, France) were tetramerized with PE-streptavidin (BD Biosciences, Mountain View, CA), as previously described.13 Cells were incubated for 1 hour at 4°C with HLA-A*02 tetramers or for 30 minutes at room temperature (RT) with HLA-A*02 dextramers (Immudex) for HLA-A2 recognition assay. Fluorescence was measured with a LSR II, a Canto II, or an Aria IIu cytometer (BD Biosciences, Mountain View, CA) and analyzed with FLOWJO software (Tree Star, Inc., Ashland, OR).
Suppression assay
CAR Tregs were labeled with CPD-V450 (Thermo Fisher Scientific) and tested for suppressive activity in a range of ratios from 1:1 to 1:80 on carboxyfluorescein diacetate succinimidyl ester (CFSE)–labeled (Thermo Fisher Scientific) responder CD4+CD25− T cells or CD8+CD45RChigh T cells stimulated with allogeneic APCs at a 1:1 ratio. HLA-A*02 target was expressed either by responder T cells or APCs. Proliferation of responder T cells was analyzed by flow cytometry after the exclusion of CPD V450-stained Tregs on CFSE dilution (Thermo Fisher Scientific) or cell events count (123count eBeads; Thermo Fisher Scientific) after 5 days of coculture in complete RPMI1640 medium supplemented with 5% human AB serum.
In vitro cytotoxicity assay
CAR-Tregs or CAR-Teffs were added on a confluent monolayer of HLA-A*02+ or HLA-A*02− ECs in flat-bottom 96-well plates in a range of ratios from 1:2 to 5:1 Tcells:ECs, and cells were centrifuged for 1 minute at 430g before 3 hours of incubation at 37°C 5% CO2. Then, ECs were harvested using Tripsine-EDTA solution (Gibco) and analyzed for caspase-3 activation by flow cytometry in living cells after the exclusion of CD3+ cells. For apoptosis analysis in PBMCs, CAR-Tregs were cultured with HLA-A*02+ or HLA-A*02− allogeneic PBMCs for 24 hours in a range of T cells:PBMCs in ratios from 5:1 to 1:2. Apoptosis was analyzed by flow cytometry in monocytes, B cells, and T cells by gating on CD14+, CD19+, and CD3+ LNGFR− cells, respectively, using Annexin V staining.
CAR-mediated activation assay
A total of 2.0 × 10⁵ CAR Tregs were plated with 4.0 × 10⁵ APCs (CD3-depleted PBMCs) in a flat-bottom 96-well plate in 200 µL RPMI 1640 medium (Thermo Fisher Scientific) supplemented with 10% FCS. For Zap70 phosphorylation analysis, cells were cocultured for 5, 10, or 20 minutes, and then harvested on ice and fixed with paraformaldehyde 2%, stained for CD3+LNGFR+ expression, and stained intracellularly for phosphorylated Zap70 (BD Bioscience, Mountain View, CA). For other markers, cells were harvested after 24-hour coculture. Brefeldin A was added the 4 last hours of culture for cytokines analysis. Antibodies used for flow cytometry are listed in Table 1.
Humanized mice models
The 8- to 12-week-old NSG mice were bred in our own animal facilities in specific-pathogen free conditions (Humanized Platform Labex IGO, accreditation number C44-278), and this study was carried out according to permit numbers APAFIS 3168 and APAFIS 14810 from the Ministry of Research.
In vivo cytotoxicity assessment.
HLA-A*02 transgenic NSG mice were 1.5 Gy irradiated and IV injected 24 hours later with 1.5 × 10⁷ CAR Tregs or CAR Teffs. Mice were assessed by body weight measurement and histological analysis of organs 100 days after Treg infusion or 25 days after CAR Teff infusion. Organs were fixed in paraformaldehyde 4%, included in paraffin, colored with hematoxylin phloxine safran, and scanned with NanoZoomer HAMAMATSU at the MicroPICell Platform, SFR, Nantes.
Xenogeneic GVHD experiments.
NSG mice were 1.5 Gy irradiated, and 24 hours later, they were IV injected with 1.5 × 10⁷ fresh PBMCs from HLA-A*02+ healthy volunteers with or without CAR Tregs at a ratio of PBMC:Tregs of 1:1 or 3:1. GVHD development was evaluated by body weight loss, human PBMC engraftment was monitored in blood, and organ integrity was analyzed at day 100, as previously described, and compared with organs from mice harvested 15 days after PBMC-only infusion.19
Human skin transplantation.
Human skins were obtained from HLA-A*02+ healthy volunteers from abdominoplasty surgery, and transplantation was performed as previously described.19 One month later, 5 × 10⁶ PBMCs from HLA-A*02+ healthy volunteers were IV injected with or without syngeneic CAR Tregs. Graft rejection was scored from 0 to 3 based on dryness (score 1), rigidity (score 2), and scab (score 3) by macroscopic observation, and histological analysis was performed on skin graft at day 100. Human PBMCs engraftment was monitored in blood by flow cytometry.
HLA-A*02 genotyping and real-time polymerase chain reaction analysis
Human skin was analyzed for HLA-A*02 gDNA amplification after proteinase K digestion by polymerase chain reaction (PCR), using primers listed in Table 2 and Herculase II Fusion DNA Polymerases (Agilent). The thermal conditions were the following: 10 seconds at 95°C, 10 seconds at 60°C, and 30 seconds at 72°C. Caliper LabChip was used for PCR product electrophoresis.
gDNA primer
| Gene | Sequence |
|---|---|
| HLA-A*02 | 5′- CCTCGTCCCCAGGCTCT-3′ |
| 5′-GTCCCAATTGTCTCCCCTC-3′ |
| Gene | Sequence |
|---|---|
| HLA-A*02 | 5′- CCTCGTCCCCAGGCTCT-3′ |
| 5′-GTCCCAATTGTCTCCCCTC-3′ |
Adherent ECs were cultured with CAR Tregs at ratio 1:1 for 6 hours and harvested in Trizol after nonadherent Treg elimination by washing. Briefly, mRNAs were reverse transcribed with oligo deoxythymine, random primers, and Moloney Murine leukemia virus reverse transcriptase (Life Technologies) and quantified by real-time PCR, using TaqMan probes listed in Table 3 associated with the TaqMan Universal PCR master Mix (Thermo Fisher Scientific). The reaction was performed on an Applied Biosystems Via7 equipment (Life Technologies). The thermal conditions were the following: 2 minutes at 50°C and 10 minutes at 95°C, followed by 40 cycles at 15 seconds 95°C and 1 minute at 60°C. For each gene, 2ΔΔCT was normalized to housekeeping gene and to basal expression in ECs cultured without CAR Tregs.
cDNA TaqMan probes
| Gene | Reference (Thermo Fisher) |
|---|---|
| RPLPO | Hs99999902_m1 |
| VCAM | Hs00365486_m1 |
| ICAM | Hs00164932_m1 |
| IL-6 | Hs00174131-m1 |
| IL-8 | Hs00174103_m1 |
| HLAA | Hs01058806_g1 |
| CCL2 | Hs00234140_m1 |
| CX3CL1 | Hs00171086_m1 |
| IDO | Hs00984148_m1 |
| IL-1B | Hs01555410_m1 |
| HMOX1 | Hs01110250_m1 |
| BCL2 | Hs00608023_m1 |
| A20 | Hs00234713_m1 |
| NFKBIA | Hs00355671_g1 |
| CIITA | Hs00172106_m1 |
Calcium flux assessment in Tregs and ECs by time-lapse videomicroscopy
Adherent ECs were labeled with Fura-2 calcium indicator (Thermo Fisher Scientific) at 7.5 µM in Hanks balanced salt solution medium containing calcium (Thermo Fisher) for 1 hour at RT. Cells were seeded in µ-slide 8-well (ibidi, #80826; Martinsried, Germany) plate in Hanks balanced salt solution supplemented with 1% FCS, and measurements of fura-2 fluorescence at 340 and 380 nm were obtained using a widefield Leica DMI 6000B microscope (MicroPICell core facilities, SFR Institut de Recherche en Santé, Nantes, France) for 15 minutes. Calcium flux was quantified by the ratio 340 nm (free calcium)/380 nm (bound calcium) intensity in all individual cells tracked over time by Icy Software (created by the Quantitative Image Analysis Unit at Institut Pasteur, Paris, France).
Immunohistochemistry
Human skin grafts and surrounding mouse skin were harvested 100 days after cell injection and fixed 10 days in paraformaldehyde 4%. Paraffin embedding and 5-µm sections were performed by the MicroPICell platform (Université de Nantes, Nantes, France). Sections were deparaffinized and rehydrated by 5-minute successive washes in xylene (3 times), gradient of alcohol solutions (100%, 90%, then 70%), distilled water, and phosphate-buffered saline 1×. Epitopes were retrieved by 45-minute incubation in 98°C heated 1× citrate buffer at pH 6 (ab64236; Abcam, Cambridge, United Kingdom) and washes with water and then phosphate-buffered saline. Nonspecific antibody staining was limited by 30 minutes of saturation using 5% bovine serum albumin. Involucrin staining was performed by ON incubation with anti-human involucrin antibody (Sigma, I9018) at 4°C, washes with phosphate-buffered saline, and 1 hour and 30 minutes of incubation with goat anti-mouse immunoglobulin G AF647 secondary antibody (A32728; Thermo Fisher Scientific) at RT. Sections were mounted with Prolong Gold antifade Reagent (P36934; Thermo Fisher Scientific). Images were captured using NanoZoomer slide scanner (Hamamatsu Photonics, Japan).
Statistical analysis
Two-way analysis of variance (ANOVA) repeated measure (RM) test and Bonferroni posttest were performed on a cytotoxicity assay in a range of T cells:ECs ratios, on CAR-mediated activation tests over time, on suppression assays in a range of Tregs:Teffs, on calcium flux quantification in ECs over time, and on body weight evolution over time for GVHD follow-up. Mann-Whitney U test was performed on gene expression analysis in ECs to compare A2-CAR and ctrl-CAR Tregs mediated effect, on phenotype comparison of A2-CAR vs Her2-CAR vs nontransduced cells (NT) CD8+ Tregs after expansion, and after 24 hours of stimulation with APCs. Log rank (Mantel Cox) test was used for skin graft survival and GVHD mouse survival analyses.
Results
Generation of HLA-A*02-specific CAR (A2-CAR) engineered CD8+ Tregs and expansion
We developed a protocol of transduction and expansion of primary CD8+CD45RClow/− Tregs, using a second-generation HLA-A*02-specific CAR previously used for CD4+CD25hiCD45RA+ Tregs17 for further application in transplantation. We generated lentiviral vectors encoding the HLA-A*02-CAR or an irrelevant control Her2-CAR, both encoding a Myc-tag and the LNGFR and confirmed their surface expression by transduction of Jurkat cells (supplemental Figure 1A). We confirmed the efficacy of the A2-CAR lentiviral transduction on total T cells or CD8+ Tregs sorted on the basis of their low/negative expression of CD45RC, as previously described (Figure 1A),19 by detecting the extracellular Myc-tag and LNGFR (Figure 1B). CD8+ Tregs were stimulated with anti-CD3/CD28 mAbs and successively transduced 2 days in a row at days 1 and 2, as we observed that successive infections of CD8+ Tregs resulted in higher CAR transduction efficiency (supplemental Figure 1B) and then expanded (in presence of IL-2 and IL-15) until sorted at day 7 based on LNGFR expression (supplemental Figure 1B). Sorted CD8+ Tregs were then expanded again for 7 days until day 14 (Figure 1C). With this protocol, we obtained around 20% of transduction of CD8+CD45RClow/− Tregs at day 7 before sorting (Figure 1D) and 100% of LNGFR+-sorted CD8+ Tregs maintained LNGFR expression at day 14 (Figure 1E), whereas day 7 LNGFR−-sorted Tregs remained negative. CD8+CD45RClow/− Tregs were not affected by the transduction in their capacity to expand, and an average 100-fold expansion was obtained after 14 days of expansion (Figure 1F). Finally, we used HLA-A*02 tetramers to confirm the specificity of the binding of the HLA-A*02-specific CAR compared with the Her2-specific CAR, reflecting the low frequency of natural alloreactive CD8+ Tregs (Figure 1G). The expression of a functional CAR by CD8+ Tregs was maintained for at least 28 days of in vitro culture (supplemental Figure 1C).
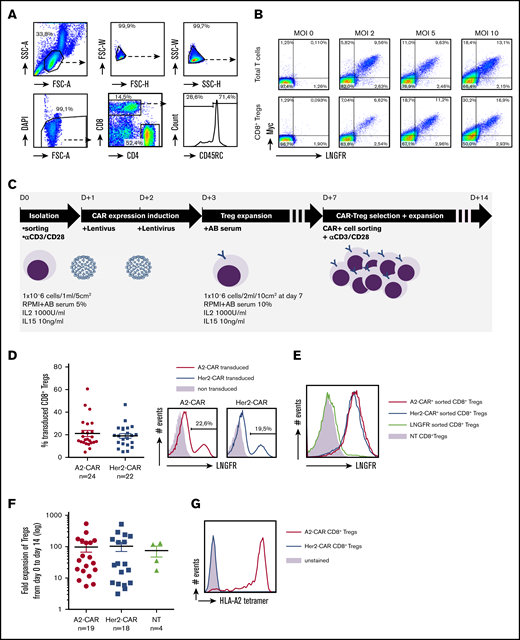
Generation of HLA-A*02-specific CAR CD8+ Tregs. (A) Gating strategy for CD8+CD45RClow nTreg sorting by FACS Aria from PBMCs. CD8+ Tregs were selected on morphology, exclusion of doublets and dead cells, and positive selection of CD8+ and CD45RC−/low expression. (B) Total T cells and purified CD8+ Tregs were stimulated ON with anti-CD3 and anti-CD28 mAbs (day 0), transduced with CAR recombinant lentivirus at days 1 and 2 in a range of multiplicity of infection from 2 to 10, calculated on lentivirus titration on Jurkat cells. CAR expression was analyzed at day 8 by flow cytometry staining of cMyc and LNGFR. (C) Schematic depicting the process for CAR CD8+ Treg production. CD8+ Tregs were isolated, stimulated, transduced twice with CAR-encoding lentivirus, expanded, selected on CAR expression, and expanded for a total culture of 14 days. (D) FACS analysis of CAR expression by CD8+ Tregs after 7 days of culture based on LNGFR staining. (Left) Percentage of cells expressing the A2-CAR (n = 24) or Her2-CAR (n = 22) at day 7 before purification. Mean ± standard error of the mean (SEM) is shown. (Right) Representative histograms of LNGFR expression in A2- and Her2-CAR transduced CD8+ Tregs compared with nontransduced cells. (E) Representative histogram of LNFGR staining on CD8+ Tregs cultured 14 days previously purified at day 7 on A2- or Her2-CAR expression compared with NT cells. (F) Expansion fold of CD8+ Tregs from day 0 plating to day 14 harvesting when transduced with A2-CAR (n = 19) or Her2-CAR (n = 18) compared with NT (n = 4). Mean ± SEM. (G) A2-CAR and Her2-CAR CD8+ Tregs were incubated or not (unstained) with HLA-A*02 tetramer labeled with PE and assessed for anti-HLA-A*02 recognition. Representative histogram of 3 experiments.
Generation of HLA-A*02-specific CAR CD8+ Tregs. (A) Gating strategy for CD8+CD45RClow nTreg sorting by FACS Aria from PBMCs. CD8+ Tregs were selected on morphology, exclusion of doublets and dead cells, and positive selection of CD8+ and CD45RC−/low expression. (B) Total T cells and purified CD8+ Tregs were stimulated ON with anti-CD3 and anti-CD28 mAbs (day 0), transduced with CAR recombinant lentivirus at days 1 and 2 in a range of multiplicity of infection from 2 to 10, calculated on lentivirus titration on Jurkat cells. CAR expression was analyzed at day 8 by flow cytometry staining of cMyc and LNGFR. (C) Schematic depicting the process for CAR CD8+ Treg production. CD8+ Tregs were isolated, stimulated, transduced twice with CAR-encoding lentivirus, expanded, selected on CAR expression, and expanded for a total culture of 14 days. (D) FACS analysis of CAR expression by CD8+ Tregs after 7 days of culture based on LNGFR staining. (Left) Percentage of cells expressing the A2-CAR (n = 24) or Her2-CAR (n = 22) at day 7 before purification. Mean ± standard error of the mean (SEM) is shown. (Right) Representative histograms of LNGFR expression in A2- and Her2-CAR transduced CD8+ Tregs compared with nontransduced cells. (E) Representative histogram of LNFGR staining on CD8+ Tregs cultured 14 days previously purified at day 7 on A2- or Her2-CAR expression compared with NT cells. (F) Expansion fold of CD8+ Tregs from day 0 plating to day 14 harvesting when transduced with A2-CAR (n = 19) or Her2-CAR (n = 18) compared with NT (n = 4). Mean ± SEM. (G) A2-CAR and Her2-CAR CD8+ Tregs were incubated or not (unstained) with HLA-A*02 tetramer labeled with PE and assessed for anti-HLA-A*02 recognition. Representative histogram of 3 experiments.
A2-CAR CD8+ Tregs remained stable in their regulatory phenotype and did not acquire killing activity toward endothelial cells in vitro nor in vivo
By analyzing a panel of CD8+ Treg expression markers that we previously described, including Foxp3, cytokines such as IL-10, IL-34, transforming growth factor β, and IFN-γ that play a crucial role in the suppressive activity of CD8+ Tregs,19,26 but also including cytotoxic and exhaustion markers, we determined whether the transduction and expression of the CAR affected the phenotype of the expanded CD8+ Tregs and their capacity to respond to a full activation induced by a PMA ionomycin stimulation. We did not observe relevant differences in the percentage of expression or in MFI (data not shown) of the markers by the CAR CD8+ Tregs vs NT, although for both Her2-CAR and A2-CAR CD8+ Tregs we observed a trend or significantly more expression of CD25, ITGβ7, Foxp3, GzmB, and BTLA4 and less expression of PD-1 and CD127 (Figure 2A). Thus, these data suggest that A2-CAR expression did not alter the CD8+ Tregs phenotype compared with nontransduced CD8+ Tregs. Also, these data suggest that the CD8+ Tregs did not gain cytotoxicity potential (perforin and FASL are not or little expressed) or exhaustion (PD-1 and BTLA4 are not expressed or at very low levels).
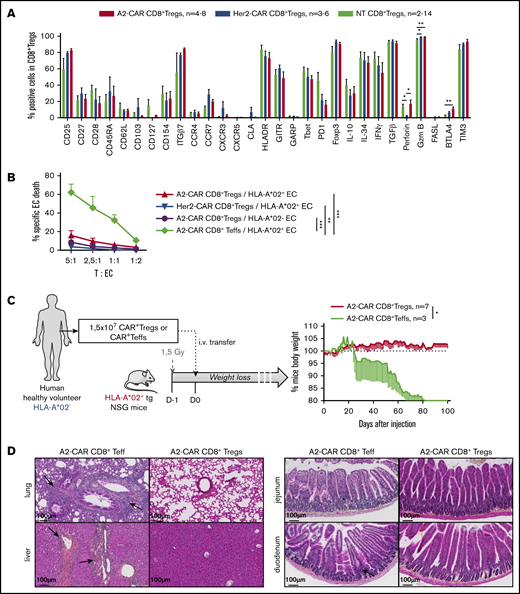
Expression of a functional CAR by CD8+ Tregs does not affect their Treg-like phenotype and does not confer cytotoxic activity against HLA-A*02+ cells. (A) Cultured (14 days) A2-CAR (in red) and Her2-CAR (in blue) CD8+ Tregs and nontransduced CD8+ Tregs (NT, in green) were stimulated with PMA/ionomycin (except for CD25 analysis) in the presence of brefeldin A for 4 hours and analyzed for expression of Tregs-associated markers. Shown is the percentage of CD8+ Tregs expressing each marker. Mann-Whitney U test, *P < .05; **P < .01. (B) A2-CAR (red and purple lines, n = 6) and Her2-CAR (blue line, n = 4) CD8+ Tregs or A2-CAR CD8+ Teffs (green line) were cultured with ECs expressing (red, blue, and green lines) or not (purple line) HLA-A*02 in a range of CAR T cells:ECs ratios for 3 hours of culture, and ECs were analyzed for caspase 3 activation by flow cytometry. Percentage of specific EC death was calculated by the subtraction of the staining of ECs in absence of Tregs. Mean ± SEM is represented. Two-way RM test, **P < .01; ***P < .001. (C) A total of 1.5 × 10⁷ A2-CAR CD8+ Tregs or CD8+ Teffs were generated from HLA-A*02− PBMCs. Irradiated HLA-A*02 transgenic NSG mice received either A2-CAR CD8+ Tregs or A2-CAR CD8+ Teffs alone to assess in vivo cytotoxicity as reflected by mice body weight loss (mean ± SEM). (D) Anatomopathological analysis of lesions in liver, lung, and gut performed at day 100 in HLA-A*02 transgenic NSG mice injected with A2-CAR CD8+ Tregs in comparison with A2-CAR CD8+ Teffs-injected mice analyzed at time of euthanasia. Arrows and stars show immune cell infiltrate and tissue injury.
Expression of a functional CAR by CD8+ Tregs does not affect their Treg-like phenotype and does not confer cytotoxic activity against HLA-A*02+ cells. (A) Cultured (14 days) A2-CAR (in red) and Her2-CAR (in blue) CD8+ Tregs and nontransduced CD8+ Tregs (NT, in green) were stimulated with PMA/ionomycin (except for CD25 analysis) in the presence of brefeldin A for 4 hours and analyzed for expression of Tregs-associated markers. Shown is the percentage of CD8+ Tregs expressing each marker. Mann-Whitney U test, *P < .05; **P < .01. (B) A2-CAR (red and purple lines, n = 6) and Her2-CAR (blue line, n = 4) CD8+ Tregs or A2-CAR CD8+ Teffs (green line) were cultured with ECs expressing (red, blue, and green lines) or not (purple line) HLA-A*02 in a range of CAR T cells:ECs ratios for 3 hours of culture, and ECs were analyzed for caspase 3 activation by flow cytometry. Percentage of specific EC death was calculated by the subtraction of the staining of ECs in absence of Tregs. Mean ± SEM is represented. Two-way RM test, **P < .01; ***P < .001. (C) A total of 1.5 × 10⁷ A2-CAR CD8+ Tregs or CD8+ Teffs were generated from HLA-A*02− PBMCs. Irradiated HLA-A*02 transgenic NSG mice received either A2-CAR CD8+ Tregs or A2-CAR CD8+ Teffs alone to assess in vivo cytotoxicity as reflected by mice body weight loss (mean ± SEM). (D) Anatomopathological analysis of lesions in liver, lung, and gut performed at day 100 in HLA-A*02 transgenic NSG mice injected with A2-CAR CD8+ Tregs in comparison with A2-CAR CD8+ Teffs-injected mice analyzed at time of euthanasia. Arrows and stars show immune cell infiltrate and tissue injury.
Engineering of A2-CAR enables the transplant-specific targeting of donor ECs expressing HLA-A*02. Thus, to establish the absence of A2-CAR–mediated cytotoxity toward ECs, the killing activity of the A2-CAR CD8+ Tregs was assessed both in vitro in presence of donor graft ECs carrying (A2+) or not (A2−) the HLA-A*02 allele (Figure 2B; supplemental Figure 1D) or in vivo in HLA-A*02 transgenic mice (Figure 2C). In vitro, in the presence of increasing numbers of A2-CAR or Her2-CAR CD8+ Tregs, we did not observe any significant increased percentage of specific A2+ or A2−/Her2− EC death, as measured by active caspase 3 staining, in contrast to A2-CAR-transduced CD8+ Teffs that induced a significant and high EC death (Figure 2B). In vivo, the injection of a high number (1.5 × 10⁷ cells) of A2-CAR CD8+ Tregs in HLA-A*02+ transgenic mice did not result in GVHD, as shown by weight loss measurement until day 100, in contrast to mice injected with 1.5 × 10⁷ A2-CAR CD8+ Teffs (Figure 2C). This was confirmed by lung, liver, and gut histology demonstrating preserved architecture and absence of infiltration in mice injected with A2-CAR CD8+ Tregs compared with A2-CAR CD8+ Teffs (Figure 2D). Analysis of the engraftment confirmed that CD8+ Tregs could be detected long term (d25 and d80) in both the spleen and blood of the HLA-A2 transgenic NSG mice (supplemental Figure 2). The CAR was still expressed by CD8+ Tregs and still able to recognize the HLA-A*02 molecule, as shown by the HLA-A*02 dextramer staining 25 days after injection in mice (supplemental Figure 2).
Altogether, the results confirm the absence of cytotoxicity of A2-CAR CD8+ Tregs as we described previously for polyclonal expanded CD8+ Tregs.19
Interaction of the CD8+ Tregs with HLA-A*02+ target cells induced a specific activation of both CD8+ Tregs and HLA-A*02+ cells
To further understand the consequence of the CAR-mediated vs T-cell receptor (TCR)–mediated stimulation on the CD8+ Tregs and to further decipher the functionality of A2-CAR CD8+ Tregs, we analyzed the intracellular pathway of signalization after incubation of the CAR-CD8+ Tregs in the presence of HLA-A*02+ or HLA-A*02− allogeneic APCs (Figure 3A-B). We observed that only HLA-A*02+ APC stimulation of A2-CAR CD8+ Tregs rapidly and significantly increased the level of phospho-ZAP70 in comparison with the other conditions, where the few alloreactive CD8+ Tregs could only be activated through their TCRs (Figure 3A). Thus, contact with HLA-A*02 targets triggers A2-CAR CD8+ Tregs activation by CAR CD3ζ, reflected by the phosphorylation of ZAP70. The CAR-mediated stimulation also resulted in a significantly increased percentage of activated CD8+ Tregs, based on the activation marker CD69 and IFN-γ and IL-34 cytokines, compared with TCR-mediated stimulation (Figure 3B). We saw no significant differences for CD154, GARP, LAP, CTLA-4, GITR, PD1, BTLA4, TIM3, and TGFβ that were already strongly expressed by the CD8+ Tregs before the CAR or TCR-specific stimulation, as shown by the condition with no APCs (Figure 3B).
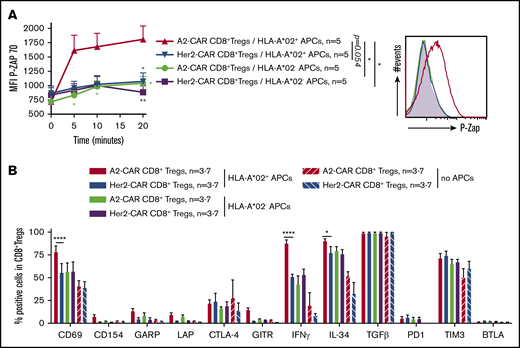
A2-CAR CD8+ Tregs are specifically activated through the CAR. (A-B) A2-CAR and Her2-CAR CD8+ Tregs were cultured with allogeneic APCs expressing or not HLA-A*02 at a ratio of 1:1 and then analyzed for activation markers. (A) CAR-Tregs were cocultured with APCs for 5 to 20 minutes and fixed and stained for phosphorylated Zap70, as revealed by mean fluorescence intensity. Time 0 corresponds to no contact with APCs. n = 5 for each group. (Left) Mean ± SEM. (Right) Representative staining. Two-way RM ANOVA test and Bonferroni posttest, *P < .05; **P < .01. (B) Cells were cocultured for 24 hours in the presence of brefeldin A for the last 4 hours, and analyzed by flow cytometry for activation markers and cytokines expression. Unstimulated Tregs (Tregs with no APCs) are shown as basal control. Percentage of CAR CD8+ Tregs expressing the marker is shown. n = 3-7 for each group. Mean ± SEM are represented. Mann-Whitney U test, *P < .05; ****P < .0001.
A2-CAR CD8+ Tregs are specifically activated through the CAR. (A-B) A2-CAR and Her2-CAR CD8+ Tregs were cultured with allogeneic APCs expressing or not HLA-A*02 at a ratio of 1:1 and then analyzed for activation markers. (A) CAR-Tregs were cocultured with APCs for 5 to 20 minutes and fixed and stained for phosphorylated Zap70, as revealed by mean fluorescence intensity. Time 0 corresponds to no contact with APCs. n = 5 for each group. (Left) Mean ± SEM. (Right) Representative staining. Two-way RM ANOVA test and Bonferroni posttest, *P < .05; **P < .01. (B) Cells were cocultured for 24 hours in the presence of brefeldin A for the last 4 hours, and analyzed by flow cytometry for activation markers and cytokines expression. Unstimulated Tregs (Tregs with no APCs) are shown as basal control. Percentage of CAR CD8+ Tregs expressing the marker is shown. n = 3-7 for each group. Mean ± SEM are represented. Mann-Whitney U test, *P < .05; ****P < .0001.
We then analyzed the calcium signaling in the Fura2-AM calcium probe-labeled ECs after contact with the CAR-specific CD8+ Tregs or CD8+ Teffs or control agonist anti-HLA-A*02 mAbs (Figure 4A-B). We observed a strong increased of calcium flux in the HLA-A*02+ ECs after incubation with the anti-HLA-A*02 mAbs or CD8+ Teffs. The increase was also detectable, but lower, in the presence of A2-CAR CD8+ Tregs, whereas negative controls (Her2-CAR CD8+ Tregs in presence of HLA-A*02+Her2− ECs and A2-CAR CD8+ Tregs in the presence of HLA-A*02−Her2− ECs) remained basal for calcium flux signaling.
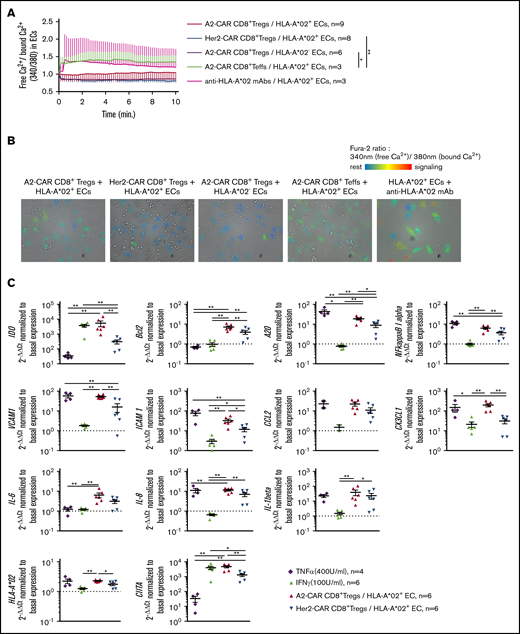
HLA-A*02+ recognition by A2-CAR CD8+ Tregs induces a fine-tuned activation of ECs. (A-B) HLA-A*02+ (red, blue, green, and pink lines) or HLA-A*02− (purple line) ECs were labeled with Fura-2 probe calcium flux reporting marker and cocultured with A2-CAR (red and purple lines) or Her2-CAR CD8+ Tregs (blue line) or CD8+ Teffs (green line) for 15 minutes under microscopic observation (time-lapse assay) to measure calcium flux in ECs. Positive control of activation was obtained by adding 10 µg/mL anti-HLA-A*02 mAbs to ECs culture (pink line). (A) Activation score of ECs over coculture duration with T cells was calculated by doing the ratio of free calcium (340 nm emission of Fura-2) divided by bound calcium (380 nm emission of Fura-2). Mean ± SEM are represented. Two-way RM ANOVA test, *P < .05; **P < .01. (B) Representative photos after 5 minutes of coculture. Resting cells are colored in blue and turn to red when activated. (C) A2-CAR (red) or Her2-CAR CD8+ Tregs (blue) were cultured with HLA-A*02+ ECs for 6 hours and analyzed by quantitative reverse transcription PCR for expression of genes associated to status of ECs or adhesion or cell recruitment. Tumor necrosis factor α (purple) and IFN-γ (green) were added as controls for EC activation. Gene expression was normalized to basal expression in unstimulated ECs. Mean ± SEM is shown. Mann-Whitney U test, *P < .05; **P < .01.
HLA-A*02+ recognition by A2-CAR CD8+ Tregs induces a fine-tuned activation of ECs. (A-B) HLA-A*02+ (red, blue, green, and pink lines) or HLA-A*02− (purple line) ECs were labeled with Fura-2 probe calcium flux reporting marker and cocultured with A2-CAR (red and purple lines) or Her2-CAR CD8+ Tregs (blue line) or CD8+ Teffs (green line) for 15 minutes under microscopic observation (time-lapse assay) to measure calcium flux in ECs. Positive control of activation was obtained by adding 10 µg/mL anti-HLA-A*02 mAbs to ECs culture (pink line). (A) Activation score of ECs over coculture duration with T cells was calculated by doing the ratio of free calcium (340 nm emission of Fura-2) divided by bound calcium (380 nm emission of Fura-2). Mean ± SEM are represented. Two-way RM ANOVA test, *P < .05; **P < .01. (B) Representative photos after 5 minutes of coculture. Resting cells are colored in blue and turn to red when activated. (C) A2-CAR (red) or Her2-CAR CD8+ Tregs (blue) were cultured with HLA-A*02+ ECs for 6 hours and analyzed by quantitative reverse transcription PCR for expression of genes associated to status of ECs or adhesion or cell recruitment. Tumor necrosis factor α (purple) and IFN-γ (green) were added as controls for EC activation. Gene expression was normalized to basal expression in unstimulated ECs. Mean ± SEM is shown. Mann-Whitney U test, *P < .05; **P < .01.
To further understand the consequence of the signaling and activation of the HLA-A*02+/− Her2− ECs in the presence of A2- or Her2-CAR CD8+ Tregs in comparison with IFN-γ or tumor necrosis factor α stimulus, we recovered the adherent layer of ECs after 6 hours of incubation after careful washing, and analyzed several genes associated with tolerance or inflammation by quantitative reverse transcription PCR (Figure 4C). Interestingly, we observed that genes associated with tolerance or EC protection, such as IDO, anti-apoptotic Bcl2, or the negative regulator of NF-kB-dependent gene expression A20, were significantly induced in the ECs after contact with A2-CAR CD8+ Tregs compared with controls (Figure 4C). IDO overexpression was particularly striking and correlates with our previous description of a role for this molecule in CD8+ Tregs-mediated tolerance induction.21 We observed a less pronounced increase of adhesion molecules VCAM1 and ICAM1 expression, chemokine CX3CL1, activation markers HLA-A*02, and CIITA, but no differences for the expression of the NF-κB inhibitor α or the proinflammatory chemokine CCL2 (Figure 4C). We found no differences in expression of proinflammatory IL-6, IL-8, and IL-1b cytokines.
Altogether, these results confirm that A2-CAR CD8+ Tregs specifically bind to and interact with HLA-A*02 expressing target cells compared with irrelevant (Her2) CAR CD8+ Tregs. They also suggest a potential activation of tolerogenic mechanisms of the endothelium of a kidney graft by the A2-CAR-specific CD8+ Tregs.
HLA-A*02 specificity conferred by the CAR improved CD8+ Tregs suppressive activity in vitro and in vivo
To confirm our hypothesis of an increased ability to suppress a major histocompatibility complex (MHC) mismatched triggered immune response of the CAR-specific CD8+ Tregs, we tested the A2-CAR or Her2-CAR CD8+ Tregs in different settings (ie, in the presence of HLA-A*02+ APCs and CFSE-labeled CD4+ Teffs [Figure 5A]; HLA-A*02+ APCs and CFSE-labeled CD8+ Teffs [Figure 5B]; HLA-A*02− APCs and CFSE-labeled HLA-A*02+ CD4+ Teffs [supplemental Figure 3A]; or HLA-A*02− APCs and CFSE-labeled HLA-A*02+ CD8+ Teffs [supplemental Figure 3B]). In the settings in the presence of HLA-A*02+ APCs that mimic mainly the direct allo-response in transplantation, we observed a significant and strong increase of the suppressive capacity of A2-CAR CD8+ Tregs on Teff cells compared with Her2-CAR or polyclonal CD8+ Tregs (NT) at all ratios assessed, even at a 1:40 ratio (Figure 5A-B). The A2-CAR CD8+ Tregs also better suppressed the proliferation of CD4+ or CD8+ Teffs when HLA-A*02 was expressed by the responder cells (supplemental Figure 3A-B). The strong specific suppressive capacity observed by the A2-CAR CD8+ Tregs was not mediated by cell death, as A2-CAR CD8+ Tregs did not induce apoptosis of HLA-A*02+CD3+, CD19+, or CD14+ cells in vitro (supplemental Figure 4).

Conferring HLA-A*02 specificity to CD8+ Tregs improves their suppressive capacity on a HLA-A*02-mismatched proliferation in vitro. A2-CAR, Her2-CAR, and NT CD8+ Tregs were tested in a range of ratios to CD4+ (A) or CD8+ (B) Teffs stimulated by allogeneic HLA-A*02+ APCs. (Upper left) Schematic depicting cells cocultured and expression of HLA-A*02 target on cells. (Lower left) Representative histograms of CFSE profile in Teffs at day 5 of culture in the absence (filled gray) or in presence of A2-CAR (red line), Her2-CAR (blue line), or nontransduced (green line) CD8+ Tregs in a range of ratio Tregs:Teffs. (Right) Relative proportion of proliferating Teff cells normalized to proliferation in the absence of Tregs, in a range of Tregs:Teffs ratios. n = 6-8, as indicated on each figure. Means ± SEM are represented. Two-way RM ANOVA test and Bonferroni posttest, *P < .05; **P < .01; ***P < .001.
Conferring HLA-A*02 specificity to CD8+ Tregs improves their suppressive capacity on a HLA-A*02-mismatched proliferation in vitro. A2-CAR, Her2-CAR, and NT CD8+ Tregs were tested in a range of ratios to CD4+ (A) or CD8+ (B) Teffs stimulated by allogeneic HLA-A*02+ APCs. (Upper left) Schematic depicting cells cocultured and expression of HLA-A*02 target on cells. (Lower left) Representative histograms of CFSE profile in Teffs at day 5 of culture in the absence (filled gray) or in presence of A2-CAR (red line), Her2-CAR (blue line), or nontransduced (green line) CD8+ Tregs in a range of ratio Tregs:Teffs. (Right) Relative proportion of proliferating Teff cells normalized to proliferation in the absence of Tregs, in a range of Tregs:Teffs ratios. n = 6-8, as indicated on each figure. Means ± SEM are represented. Two-way RM ANOVA test and Bonferroni posttest, *P < .05; **P < .01; ***P < .001.
We then assessed the potential of such transduced A2-CAR CD8+ Tregs in vivo, first in a model of HLA-A*02+ human skin transplantation in immunodeficient nonobese diabetic/severe combined immunodeficiency IL-2Rγ−/− (NSG) mice (Figure 6A; supplemental Figure 5). At a low ratio of PBMC:CAR-Tregs of 3:1, we observed that the A2-CAR CD8+ Tregs inhibited allogeneic HLA-A*02+ skin transplant rejection in 50% of the mice compared with Her2-CAR CD8+ Tregs that did not inhibit transplant rejection (Figure 6B). At a 1:1 ratio, A2-CAR CD8+ Tregs inhibited graft rejection in 100% mice vs 25% in mice treated with Her2-CAR CD8+ Tregs. Analysis of the engraftment showed increased percentage with time of human CD45 in A2-CAR CD8+ Tregs-treated mice at a 3:1 PBMCs:Tregs ratio (Figure 6C; supplemental Figure 6). Histological assessment of more than 100 days tolerated skin graft demonstrated in A2-CAR CD8+ Tregs-treated mice a lower immune cell infiltration than in PBMC-only-treated mice that showed heavy leukocyte infiltration (Figure 6D). Preserved skin architecture was evidenced in skin graft of A2-CAR CD8+ Tregs-treated mice assessed more than 100 days after transplantation with detectable and defined involucrin+ epidermal layer (Figure 6E), in contrast to PBMC-only treated mice.
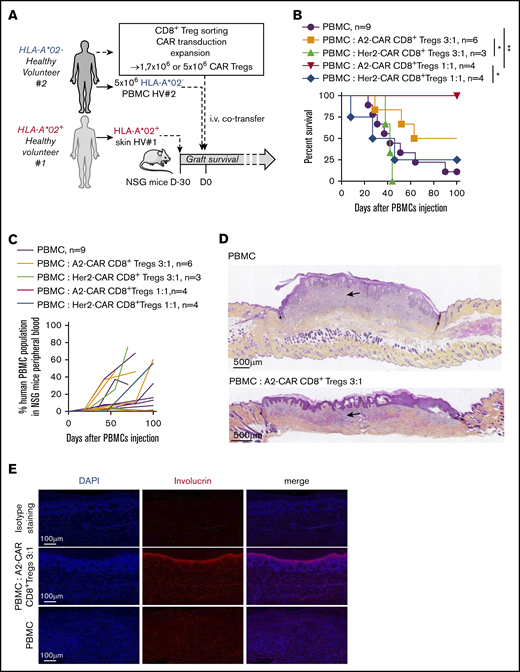
A2-CAR CD8+ Treg therapy efficiently controls HLA-A*02 mismatched skin graft allogeneic rejection. (A) Schematic depicting the model of human skin graft in NSG mice. Skin from HLA-A*02+ human healthy volunteer (HV#1) was grafted on immuno-incompetent NSG mice, and 1 month later (= day 0 of graft survival challenge), mice were IV injected with 5 × 10⁶ PBMCs from a HLA-A*02 mismatched healthy volunteer (HV#2, HLA-A*02−) to induce an allogeneic rejection of the skin graft. A2-CAR or Her2-CAR CD8+ Tregs were generated from PBMCs of HV#2 donor and co-injected with PBMCs in grafted mice at a PBMCs:Tregs ratio of 3:1 or 1:1. (B) Survival of skin graft over time based on macroscopic features of rejection in mice treated with A2-CAR CD8+ Tregs at a ratio of PBMCs:Tregs of 3:1 (orange line, n = 6) or 1:1 (red line, n = 4) or Her2-CAR at a ratio of PBMCs:Tregs of 3:1 (green line, n = 3) or 1:1 (blue line, n = 4) or not treated (purple line, n = 9). Log rank (Mantel Cox) test, *P < .05; **P < .01. (C) Percentage human PBMCs in mouse blood over time after cell transfer. One line represents 1 mouse. (D) Representative photos of HPS coloration of human skin tissue grafted 100 days after cell transfer. Arrows show immune cell infiltrate, stars delimit human skin graft interface with mouse skin, scales are indicated on photos. (Upper) Representative photo of a skin graft of mice injected with PBMCs, macroscopic score, 3. (Lower) Representative photo of skin graft of mice injected with PBMCs and treated with A2-CAR CD8+ Tregs, macroscopic score, 2. (E) Human skin grafts were assessed 100 days after cell transfer of PBMCs ± A2-CAR CD8+ Tregs by immunofluorescence stains of 4′,6-diamidino-2-phenylindole (DAPI) and involucrin staining. Images are representative stains; scale is indicated on the bottom left.
A2-CAR CD8+ Treg therapy efficiently controls HLA-A*02 mismatched skin graft allogeneic rejection. (A) Schematic depicting the model of human skin graft in NSG mice. Skin from HLA-A*02+ human healthy volunteer (HV#1) was grafted on immuno-incompetent NSG mice, and 1 month later (= day 0 of graft survival challenge), mice were IV injected with 5 × 10⁶ PBMCs from a HLA-A*02 mismatched healthy volunteer (HV#2, HLA-A*02−) to induce an allogeneic rejection of the skin graft. A2-CAR or Her2-CAR CD8+ Tregs were generated from PBMCs of HV#2 donor and co-injected with PBMCs in grafted mice at a PBMCs:Tregs ratio of 3:1 or 1:1. (B) Survival of skin graft over time based on macroscopic features of rejection in mice treated with A2-CAR CD8+ Tregs at a ratio of PBMCs:Tregs of 3:1 (orange line, n = 6) or 1:1 (red line, n = 4) or Her2-CAR at a ratio of PBMCs:Tregs of 3:1 (green line, n = 3) or 1:1 (blue line, n = 4) or not treated (purple line, n = 9). Log rank (Mantel Cox) test, *P < .05; **P < .01. (C) Percentage human PBMCs in mouse blood over time after cell transfer. One line represents 1 mouse. (D) Representative photos of HPS coloration of human skin tissue grafted 100 days after cell transfer. Arrows show immune cell infiltrate, stars delimit human skin graft interface with mouse skin, scales are indicated on photos. (Upper) Representative photo of a skin graft of mice injected with PBMCs, macroscopic score, 3. (Lower) Representative photo of skin graft of mice injected with PBMCs and treated with A2-CAR CD8+ Tregs, macroscopic score, 2. (E) Human skin grafts were assessed 100 days after cell transfer of PBMCs ± A2-CAR CD8+ Tregs by immunofluorescence stains of 4′,6-diamidino-2-phenylindole (DAPI) and involucrin staining. Images are representative stains; scale is indicated on the bottom left.
We then analyzed the suppressive capacity of the A2-CAR CD8+ Tregs in a xenogeneic model of GVHD in NSG mice humanized with HLA-A*02+ PBMCs (Figure 7A). In this setting, we observed a complete inhibition of GVHD occurrence in mice that received A2-CAR CD8+ Tregs and PBMCs at a ratio 1:1, while at the same ratio of Her2-CAR, CD8+ Tregs could not inhibit GVHD, as shown by percentage survival (Figure 7B) and weight loss (Figure 7C). This effect was dose dependent, as at a lower ratio of 3:1, A2-CAR CD8+ Tregs inhibited GVHD in 1 of 3 mice (Figure 7B-C). This inhibition of the GVHD was associated with a strong decreased of human cells in the peripheral blood of the mice injected with the A2-CAR CD8+ Tregs compared with mice injected with the Her2-CAR CD8+ Tregs, as shown by monitoring twice a month until day of euthanasia (Figure 7D), and was likely a result of an inhibition of the proliferation of the HLA-A*02+ PBMCs. Histological assessment of the lung and liver of long-surviving mice injected with 5 × 10⁶ or 1.5 × 10⁷ A2-CAR CD8+ Tregs showed low immune cell infiltration and preserved tissue integrity, particularly at the 1:1 ratio (Figure 7E).
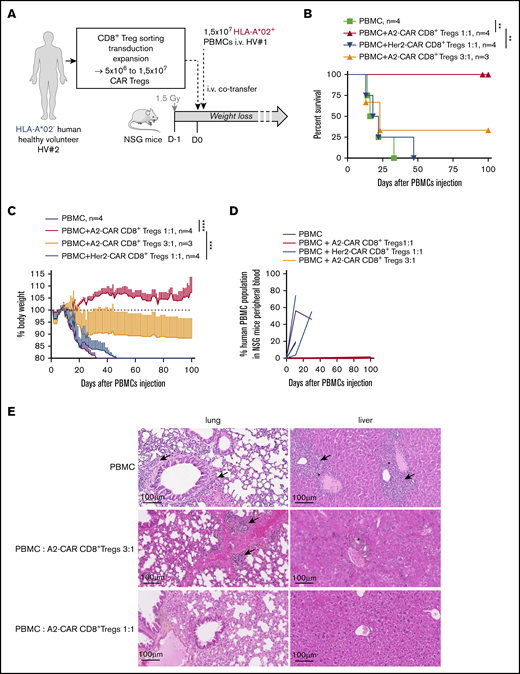
A2-CAR CD8+ Treg therapy prevents HLA-A*02+ PBMCs from inducing xenogeneic GVHD. (A) Schematic depicting the model of GVHD xenogeneic reaction induced by 1.5 × 10⁷ IV injected human PBMCs toward 1.5 Gy irradiated mouse tissues. PBMCs used were from a HLA-A*02+ healthy volunteer (HV#1) and were co-injected or not with CAR CD8+ Tregs generated from a HLA-A*02− healthy volunteer (HV#2) at PBMCs:Tregs ratios of 1:1 or 3:1. (B-C) Percentage of mouse survival (B) and percentage of mouse body weight followed-up over time (C) after cell transfer in mice injected with PBMCs alone (green line, n = 4) or cotreated with A2-CAR CD8+ Tregs at a ratio of 1:1 (red line, n = 4) or 3:1 (orange line, n = 3), or with Her2-CAR CD8+ Tregs at a ratio of 1:1 (blue line, n = 4). (B) Log Rank (Mantel Cox) test, **P < .01. (C) One line represents 1 mouse. Two-way RM ANOVA test, ***P < .001; ****P < .0001. (D) Percentage of human cells in mice blood from day 0 to day 100. n = 3 for each group and n = 2 for PBMCs alone. One line represents 1 mouse. (E) Histological analysis of organ integrity by HPS coloration at day 15 for mice injected with PBMCs and day 100 for mice injected with PBMCs:A2-CAR Tregs at a ratio of 3:1 and 1:1. Arrows show immune cell infiltrate, stars hepatocyte necrosis.
A2-CAR CD8+ Treg therapy prevents HLA-A*02+ PBMCs from inducing xenogeneic GVHD. (A) Schematic depicting the model of GVHD xenogeneic reaction induced by 1.5 × 10⁷ IV injected human PBMCs toward 1.5 Gy irradiated mouse tissues. PBMCs used were from a HLA-A*02+ healthy volunteer (HV#1) and were co-injected or not with CAR CD8+ Tregs generated from a HLA-A*02− healthy volunteer (HV#2) at PBMCs:Tregs ratios of 1:1 or 3:1. (B-C) Percentage of mouse survival (B) and percentage of mouse body weight followed-up over time (C) after cell transfer in mice injected with PBMCs alone (green line, n = 4) or cotreated with A2-CAR CD8+ Tregs at a ratio of 1:1 (red line, n = 4) or 3:1 (orange line, n = 3), or with Her2-CAR CD8+ Tregs at a ratio of 1:1 (blue line, n = 4). (B) Log Rank (Mantel Cox) test, **P < .01. (C) One line represents 1 mouse. Two-way RM ANOVA test, ***P < .001; ****P < .0001. (D) Percentage of human cells in mice blood from day 0 to day 100. n = 3 for each group and n = 2 for PBMCs alone. One line represents 1 mouse. (E) Histological analysis of organ integrity by HPS coloration at day 15 for mice injected with PBMCs and day 100 for mice injected with PBMCs:A2-CAR Tregs at a ratio of 3:1 and 1:1. Arrows show immune cell infiltrate, stars hepatocyte necrosis.
Thus, conferring donor specificity to CD8+ Tregs significantly improved their suppressive capacity in vitro and in vivo in human skin transplant rejection and GVHD in NSG mice.
Discussion
Cell therapy with polyclonal CD4+ Tregs has been performed in phase 1 trials in patients with kidney or liver transplantation5-7 and 4 ongoing trials as part of the consortium The ONE Study (www.onestudy.org), as well to treat GVHD.32 Proof of clinical benefit awaits larger clinical trials. Although phase 1 clinical trials with donor-specific CD4+ Treg expanded with donor cells are ongoing, antigen-specific CD4+ and CD8+ Treg treatment in transplantation have been only reported in animal models, and have been shown to be more efficient than polyclonal Treg treatment.9-11,13,33 Thus, antigen-specific T cells would allow the therapeutic use of fewer cells, and thus with reduced costs and likely fewer off effects. Another strategy to confer antigen-specific suppression to Tregs is by gene expression of a TCR for a cognate antigen. This was proven in a mouse model of allotransplantation.11 Nevertheless, to generate polyclonal or TCR-expressing antigen-specific T cells is difficult to standardize for clinical use, as it demands the use of donor or recipient APCs in organ transplantation or GVHD, respectively, or guanosine monophosphate-grade MHC tetramers, as well as amplification of rare antigen-specific T cells within a starting cell population. Furthermore, the use of TCR brings the complexity of the restriction by the MHC and the need to identify donor peptides presented by recipient MHC.
The use of CAR technology overcomes these obstacles. Pioneer work by the Z. Eshhar laboratory described the generation of a CAR directed against a tumor antigen that, once expressed in T cells, endowed the cells with antigen specificity independent of TCR recognition, and thus of APCs and antigen presentation.34 This was the basis of the extraordinary development of CAR T effector cells in cancer.14 T-cell genetic engineering using CAR gives the possibility of initiating the expansion from a population of transduced cells that is larger than the population of natural antigen-specific T cells and obviates the need for antigen.14,15,35 Furthermore, it opens the possibility of off-the-shelf allogeneic cell products, as it does not depend on recognition of antigen in the context of a given MHC, as is the case with TCRs.35 Cell therapy with CAR CD4+ Tregs was first described in a model of inflammatory colitis.36 In the transplantation field, anti-HLA-A*02 CAR CD4+ Tregs have been recently shown to inhibit acute tissue rejection and acute GVHD in NSG mice.16-18
Polyclonal CD8+ Tregs with alloantigen specificity have been generated in vitro and used in vitro or in rodent models, but there have not been clinical trials with them (for a review, see Bézie et al20 ). We have shown that polyclonal CD4+ and CD8+ Tregs have an equivalent suppressive potential and expansion capacity up to day 28,19 but they have not yet been studied as a combination to offer better protection from graft rejection or GVHD. To the best of our knowledge, there have been no reports on CD8+ Tregs expressing a CAR directed to alloantigens or any other antigen aiming to reduce unwanted immune responses. As a first proof of concept, we describe here the use of an anti-HLA-A*02 CAR that has already been used with CD4+ Tregs.17 Furthermore, as HLA-A*02 has a prevalence in Europe between 20% and 40% of the population,37,38 the highest among HLA-A and B antigens, A2-CAR Tregs could represent a real clinical option, as there would be between 10% and 20% of HLA-A*02+ donors and HLA-A*02− recipients. New CARs with specificities against other HLA antigens could expand the repertoire of CAR Tregs for organ or bone marrow transplantation.
Previous manuscripts generating A2-CAR CD4+ Tregs used retrovirus16 or lentivirus,17,18 and only 1 using lentivirus18 reported efficiency of average 60%, whereas the efficiency of lentiviral transduction of CD8+ Tregs averaged 20%. Although variability of production of lentiviral vectors could explain this difference, future studies should aim to increase the efficiency of lentiviral transduction of CD8+ Tregs.
In vitro expansion of A2-CAR CD8+ Tregs showed an 100-fold increase in 14 days of culture, the same as the one obtained with the Her2-CAR and nontransduced CD8+ Tregs, and similar to the one previously reported by our group.19 From the previously published work with A2-CAR CD4+ Tregs, only one manuscript reported an expansion of 20-fold in 14 days.17 Because the number of CD8+ Treg cells that can be isolated from blood is larger than for CD4+ Tregs (8.0 × 10⁴ CD8+CD45RClow/− Tregs vs 1.8 × 10⁴ CD4+CD25+CD45RA+ Tregs per milliliter blood), and despite lower transduction efficiency, the high expansion potential of A2-CAR CD8+ Tregs allows us to obtain from a buffy coat a clinically applicable number of A2-CAR CD8+ Tregs (2.8 × 10⁶ cells/kg for a patient of 70 kg). As previously shown for A2-CAR CD4+ Tregs generated with a second-generation CAR,16-18 the phenotype, activation, and cytotoxicity of A2-CAR CD8+ Tregs was not modified compared with the one of nontransduced cells or irrelevant CAR transduced ones.
Suppression for A2-CAR CD8+ Tregs vs irrelevant CAR CD8+ Tregs (50% suppression at 1:40 vs 1:1, respectively) increased in higher proportion compared with the previously described 50% suppression obtained with A2-CAR CD4+ Treg vs irrelevant CAR CD4+ Tregs only doubled, from 1:16 to 1: 32 ratios,18 1:10 to 1:20,17 and 1:64 to 1:128.16
It is important to define the bidirectional interactions of antidonor CAR Tregs with ECs, as they will be the first cells recognized by the CAR Tregs. With the exception of results showing increased migration by A2-CAR CD4+ Tregs through HLA-A2 endothelial cells,18 the results in the present manuscript are the first to more extensively analyze these interactions. Although it is reassuring that EC protective and tolerogenic molecules are induced by A2-CAR CD8+ Tregs in vitro, and that there are no deleterious effects in HLA-A2 NSG mice in vivo, there are limits of molecular incompatibilities in this model, such as between adhesion molecules, and therefore potential harmful effects that could be masked by these suboptimal molecular interactions. For example, although we have demonstrated the presence of A2-CAR CD8+ Tregs at the time of GVHD, they could become artificially exhausted or anergic in the absence of human factors such as IL-2. Furthermore, we also observed the induction of proinflammatory molecules in ECs in vitro. Finally, the in vitro model we used with static contact is artificial vs the in vivo conditions, and this can be a source of artifacts on both ways, beneficial and detrimental effects of the CAR Treg-EC interaction. Therefore, it will be important in the future to further analyze the effects of CAR Tregs on ECs, using, for example, human vessels or tissue graft models with human vasculature using larger immunodeficient animals, such as rats.39 However, A2-CAR CD8+ Tregs were detected a long time after injection. Furthermore, human skin rejection and GVHD were both more efficiently suppressed by A2-CAR than by Her2-CAR CD8+ Tregs, arguing for suppressive capacity and against cytotoxic potential, as both cell products bear their endogenous TCRs that could mediate cytotoxicity. Previous publications with A2-CAR CD4+ Tregs explored either only GVHD17 or skin16,18 rejection models, but not both.
CAR CD8+ Tregs appear as alternative or complementary to CAR CD4+ Tregs, as they have favorable production process characteristics, at least comparable efficiency, and do not show undesirable effects such as cytotoxicity, although cytotoxicity has been described as a potential mechanism of action of both CD4+ and CD8+ Tregs. Future work should compare CAR CD8+ and CAR CD4+ Tregs side by side in the same model, and also in combination, as it has been shown that the combination of CAR CD4+ and CAR CD8+ Teffs was superior to each one alone.40
Immune responses against alloantigens are initiated by the direct, semidirect, and indirect allorecognition pathways in which donor MHC antigens are presented by donor cells (direct) or by recipient APCs either as cell membrane fragments (semidirect) or processed into peptides and presented by recipient MHC molecules (indirect).41 Direct antigen presentation is predominantly involved in acute rejection, whereas indirect antigen presentation is involved in chronic rejection.41 Mouse, rat, and human CD4+ and CD8+ Tregs recognizing donor antigens by direct or indirect pathways suppress T-cell responses more efficiently than polyclonal CD4+ and CD8+ Tregs.8-13,42-44 Importantly, chronic rejection was only inhibited by CD4+ Tregs with indirect and not by direct antigen recognition.9,11 Antidonor MHC CAR Tregs will recognize donor MHC antigens mimicking direct and eventually semidirect antigen presentation, but not indirect antigen presentation, and thus inhibit more efficiently acute vs chronic rejection. Although the effect of CAR Tregs has not been yet assessed in chronic rejection models,16-18 it could also be possible that antidonor MHC CAR Tregs activated in the graft may overcome chronic rejection. In the context of GVHD, our results in HLA-A2 transgenic mice suggest that if HLA-A2 is expressed by the recipient, A2-CAR CD8+ Tregs will be activated, but will not attack the tissues of the host.
CARs of increasing affinities expressed by Teff cells allowed cell activation at lower thresholds of antigen expression, but not higher activation responses.45 Increasing the affinity of transduced TCRs expressed by T CD8+ effector cells also increased their function.46 The effect of CARs of different affinities expressed by Tregs has not yet been reported, but in striking contrast to T CD4+ effector cells, TCRs with a wide range of affinities all increased CD4+ Treg suppressive activity.47 In addition, a TCR of very low affinity that was unable to direct CD4+ Teff responses was able to increase the suppressive activity of CD4+ Treg.47 In contrast to these previous results, mouse CD4+ Treg expressing TCRs recognizing the same alloantigen peptide:MHC complex with different avidities showed a direct correlation between suppressive activity and avidity.48 Future studies should determine whether CD4+ or CD8+ Treg expressing CARs of different affinities will show variations in their activity.
CARs generated from mouse mAbs generate antibody responses that can decrease the efficacy of therapy and CARs, using fully human ScFv, have been generated.49 Future developments in the area of CAR Tregs could include the use of fully human antibodies, which in the case of mAbs anti-MHC or anti-peptide:MHC complexes mimicking indirect-antigen presentation could be isolated from peripheral blood of volunteers previously immunized or from immunoglobulin humanized animals, as we have recently described.50
Some of the second-generation CARs using CD28 as intracellular costimulation signal have been shown to generate antigen-independent tonic signals that favor T-cell exhaustion,51 whereas CARs with the 4-1BB did not.49 Future work will address the effect of CARs with different intracellular signaling modules on CAR Treg function.
Acknowledgments
The authors thank Megan Levings for providing the CAR constructs and critical reading of the manuscript. The authors thank Steven Nedellec and Philippe Hulin and the microscopic facility MicroPICell SFR Bonamy in Nantes for their technical expertise and assistance in cell imaging experiments. The authors thank P. Guérif, I. Guihard, and A. Fleury from the CHU of Nantes for their help.
This work was partially funded by Labex “Immunotherapy, Graft, Oncology” (IGO) project (no. ANR-11-LABX-0016-01) and TxCell S.A. This work was realized in the context of the Institut Hospitalo-Universitaire (IHU)–Cesti project (ANR-10-IBHU-005). Labex IGO and IHU-Cesti projects are part of the “Investissements d’Avenir” French Government program managed by the ANR. The IHU-Cesti project is also supported by Nantes Métropole and Région Pays de la Loire. This work was also realized in the context of the support provided by the Fondation Progreffe.
Authorship
Contribution: S.B. performed experiments, analyzed data, and wrote the manuscript; B.C., N.D., J.L., N.G., and V.N.-D. performed experiments and analyzed data; F.B.-W. and F.D. provided essential reagents; and I.A. and C.G. designed the research, analyzed data, and wrote the manuscript.
Conflict-of-interest disclosure: S.B., I.A., and C.G. and have patents that have been licensed to TxCell SA, a Sangamo company. The remaining authors declare no competing financial interests.
Correspondence: Carole Guillonneau, INSERM UMR1064, Center for Research in Transplantation and Immunology–ITUN, 30 Bd Jean Monnet, 44093 Nantes Cedex 01, France; e-mail: carole.guillonneau@univ-nantes.fr; and Ignacio Anegon, INSERM UMR1064, Center for Research in Transplantation and Immunology–ITUN, 30 Bd Jean Monnet, 44093 Nantes Cedex 01, France; e-mail: ignacio.anegon@univ-nantes.fr.

