

Abstract
Allogeneic hematopoietic stem cell transplantation (HSCT) using αβ T-/B-cell–depleted grafts recently emerged as a transplant strategy and highlighted the potential role of γδ T cells on HSCT outcomes. Our aim was to scrutinize available evidence of γδ T-cell impact on relapse, infections, survival, and acute graft-versus-host disease (aGVHD). We performed a systematic review and meta-analysis of studies assessing γδ T cells in HSCT. We searched PubMed, Web of Science, Scopus, and conference abstracts from inception to March 2019 for relevant studies. We included all studies that assessed γδ T cells associated with HSCT. Data were extracted independently by 2 investigators based on strict selection criteria. A random-effects model was used to pool outcomes across studies. Primary outcome was disease relapse. We also assessed infections, survival, and aGVHD incidence. The review was registered with PROSPERO (CRD42019133344). Our search returned 2412 studies, of which 11 (919 patients) were eligible for meta-analysis. Median follow-up was 30 months (interquartile range, 22-32). High γδ T-cell values after HSCT were associated with less disease relapse (risk ratio [RR], 0.58; 95% confidence interval [95% CI], 0.40-0.84; P = .004; I2 = 0%), fewer viral infections (RR, 0.59; 95% CI, 0.43-0.82; P = .002; I2 = 0%) and higher overall (HR, 0.28; 95% CI, 0.18-0.44; P < .00001; I2 = 0%) and disease-free survivals (HR 0.29; 95% CI, 0.18-0.48; P < .00001; I2 = 0%). We found no association between high γδ T-cell values and aGVHD incidence (RR, 0.72; 95% CI, 0.41-1.27; P = .26; I2 = 0%). In conclusion, high γδ T cells after HSCT is associated with a favorable clinical outcome but not with aGVHD development, suggesting that γδ T cells have a significant effect on the success of HSCT. This study was registered with PROSPERO as #CRD42019133344.
Introduction
Allogeneic hematopoietic stem cell transplantation (HSCT) offers a potential cure for a variety of life-threatening hematological diseases. The most common causes of posttransplantation mortality are underlying disease relapse, infections, and graft-versus-host disease (GVHD). In this context, graft manipulation strategies have developed and been refined over the past 20 years to improve HSCT outcomes, moving from CD34 selection to CD3 depletion and, more recently, to αβ T-/B-cell depletion.1 These strategies aim to reduce GVHD while retaining cells that can mediate graft-versus-leukemia (GVL) effect and control infections. Several concerns exist with these strategies, primarily whether remaining cells will be sufficient to prevent disease recurrence and infections without causing GVHD.
γδ T cells are a unique population of lymphocytes that mediate innate immunity against a wide variety of infections and exert effective antitumor activity.2 Understanding the role of γδ T cells in HSCT has been the subject of numerous studies in the past decade.1,3 Early studies observed that long-term disease-free survival (DFS) of leukemia patients who received αβ T-cell–depleted (TCD) partially mismatched related donor (PMRD) transplants had high numbers of circulating γδ T cells after HSCT.4,5 More recent studies with non-TCD PMRD6 and autologous HSCT7 further corroborated these findings, describing an improved survival in patients with higher γδ T-cell counts posttransplantation. These studies suggested that the recovery of γδ T cells after HSCT is critical for an efficient GVL effect3 and possibly to control infections,8 helping to pave the way to a more broad application of graft manipulation strategies. As result, haploidentical αβ T-/B-cell–depleted HSCT is currently used with great success to treat children with malignant9,10 and nonmalignant disorders.11 These works argue that the clinical improvement after HSCT relies on the spared γδ T cells in the grafts, which exhibit strong antileukemia potential without mediating GVHD,9-11 and can participate in the control of opportunistic infections.3 Indeed, recent studies indicate that γδ T cells are capable of adaptive responses and undergo clonal expansion after cytomegalovirus (CMV) reactivation,12 but it is unclear whether this decreases infection frequency after HSCT.
Preclinical studies from the late 1990s has shown a beneficial role of γδ T cells on improving allogeneic engraftment without causing lethal GVHD,13,14 indicating potential benefits of this T-cell subpopulation on HSCT setting. Conversely, several mice studies suggest that γδ T cells contribute toward GVHD development,15,16 and a key study described that the graft content of donor γδ T cells predicted the risk of acute GVHD (aGVHD).17 Altogether, these works propose that γδ T cells might be beneficial in HSCT but with the cost of higher incidence of GVHD. Considering that αβ T-/B-cell–depleted HSCT is increasingly used in patients with no matched donor9-11 and that γδ T cell–enriched donor lymphocyte products are being under current investigation,18 consistent evidence is needed that supports beneficial effects of γδ T cell enrichment with no detrimental effect to the patients. We aimed to determine whether the concentration of γδ T cells in the graft or during immune reconstitution influenced the clinical outcome following HSCT and aGVHD incidence.
Methods
Search strategy and selection criteria
This systematic review and meta-analysis was performed following the PRISMA guidelines for conducting and reporting systematic reviews.19 In March 2019, we conducted a comprehensive literature search for potentially relevant studies of γδ T cells and their effect on HSCT outcomes (relapse, infections, overall and DFS, and aGVHD) with no publication time limits. Inclusion criteria were: (1) original studies (randomized, cohort, case-control, prospective and retrospective observational studies) enrolling adult or pediatric patients who had undergone peripheral blood, umbilical cord blood, or bone marrow HSCT (allogeneic and autologous) as therapy for any condition (malignant or not); and (2) have had γδ T cells (absolute count, percentage, or subsets) measured in the graft before transplantation or during immune reconstitution process.
Studies that reported dichotomous data (high vs low γδ T-cell groups) together with number of events (relapse, infections, or aGVHD) and time-to-event data (overall or DFS) during the follow-up period were included in the meta-analysis, whereas those who reported associative data were included in the qualitative synthesis. We excluded reviews, studies that reported insufficient data, experimental in vitro studies of expanded or modified γδ T cells, animal models, or studies in which presenting outcomes were not relevant to the searching protocol. Articles not in English were excluded if translations of the abstracts were not available.
Two authors (L.C.M.A. and A.G.) searched PubMed/Medline, Web of Science, and Scopus, in duplicate and independently of each other with the following search terms: “(hematopoietic stem cell transplantation OR HSCT) AND (γ δ OR γδ)” and “(bone marrow transplantation OR BMT) AND (gamma delta OR γδ).” We also checked for unpublished relevant studies and conference abstracts of the American Society of Blood and Marrow Transplantation, the European Group for Blood and Marrow Transplantation, and the American Society of Hematology. We checked references of selected publications for additional potentially relevant studies.
Two investigators (L.C.M.A. and A.G.) assessed all studies’ eligibility based on title and abstract. Potentially eligible studies were retrieved, and the full study report evaluated. We resolved disagreements by consensus or discussion, or they were adjudicated by a third reviewer (M.U.). We contacted study authors to clarify results details when necessary; if no answer was obtained or these data were not available, the record was excluded.
Data analysis
Data were extracted onto data extraction forms by 2 reviewers independently (L.C.M.A. and A.G.) and included author name, year of publication, journal, number of subjects, donor and patient age/sex, underlying disease, donor type, graft source, conditioning regiment, GVHD prophylaxis, median and range of follow-up, timepoint, γδ T-cell phenotype, and outcomes. Groups definition was based on γδ T-cell content reported by the works: high or low γδ T-cell numbers. We extracted the number of events in each group by annotating the number of relapses, infection reactivation events after HSCT, number of patients alive (overall and disease-free) and aGVHD events in each group.20 The number of subjects in each group is denoted as “total” throughout the figures. Duplicate publications and meeting abstracts were not included in the final selection. We did subgroup analyses on the basis of sample origin: blood, when γδ T-cell numbers were obtained in patients’ blood after HSCT; and grafts, when the intragraft γδ T-cell content was assessed and associated with the outcome. For each study included in the meta-analysis, we extracted the number of events in each group and the total number of subjects. In case of time-to-event analysis, we extracted the hazard ratios (HR) of high vs low γδ T-cell counts effect on overall survival (OS) and DFS. If not available, HR was estimated from published summary statistics by using the spreadsheet provided by Tierney et al.21 Disagreements on data extraction were resolved by consensus with the supervision of a third reviewer (M.U.).
To judge study quality, we used for the current systematic review a modified Newcastle-Ottawa Scale and Research Triangle Institute Item Bank to assess the risk of bias and confounding factors in observational studies,22,23 as recommended by the Cochrane Collaboration (supplemental Appendices).19,20 Risk of bias was assessed by 2 reviewers (L.C.M.A. and A.G.) independently.
Underlying disease relapse was defined as the primary outcome of this review. Secondary outcomes were infections, OS, DFS, and aGVHD incidence. Meta-analyses were performed using Review Manager (RevMan),24 version 5.3, by Mantel-Haenszel25 method for dichotomous data, or generic Inverse Variance26 for time-to-event outcome. We used random effects to calculate pooled risks on the basis of assumption that the true effect size of γδ T cells effect would vary between studies.27 Results are shown as risk ratio (RR) or HR with 95% confidence interval (CI), as calculated following the Cochrane handbook.20 The RR and HR for immune reconstitution studies and graft subgroup evaluations were calculated separately. Then, we grouped all studies to calculate a pooled risk effect for each outcome. The overall effect significance was calculated by the z test,20 with P < .05 set as significant.
We assessed heterogeneity in the meta-analysis with the I2 statistics.28,29 The test use χ2 and degrees of freedom to describe the percentage of the variability in effect estimates that is due to heterogeneity rather than sampling error (chance).20 I2 reflects the percentage of total variation across studies, and values greater than 25%, 50%, or 75% were considered to respectively indicate low, moderate, or high heterogeneity.29 If P < .05, the pooled analysis was considered significantly heterogeneous.20 We also used τ2 to estimate the dispersion of true effect sizes between studies, with low values meaning low dispersion and consequently low heterogeneity.20
Results
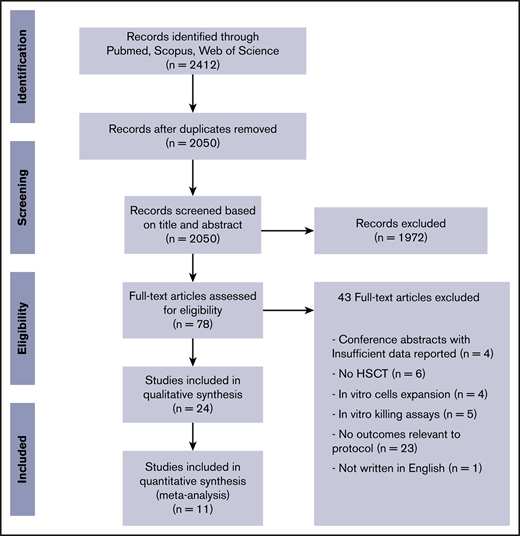
The initial literature search found 2412 potentially eligible records. After removing duplicates and screening titles/abstracts, we fully reviewed 78 reports, of which 43 were excluded (Figure 1). We included 24 studies (21 full papers and 3 meeting abstracts) in qualitative synthesis,12,30-52 summarized in Table 1. Eleven studies were used in meta-analysis, enrolling 919 patients.4-8,17,53-57 From those reports, 8 evaluated γδ T-cell reconstitution after HSCT and 3 evaluated γδ T-cell content in the graft (Table 2).
Summary of patients’ characteristics and γδ T-cell clinical outcomes (qualitative).
| aGVHD | Relapse | Viral infections | |||||||||||||||
|---|---|---|---|---|---|---|---|---|---|---|---|---|---|---|---|---|---|
| Study | N | Male, n (%) | Patient age, median (range), y | Donors | Source | Diagnosis (n) | Cond. | GVHD prophylaxis | Follow-up, median (range) | γδ Phenotype | Grade, d | n (%) | Outcome | n (%) | Outcome | n (%) | Outcome |
| Norton et al (1992)30 | 10 | NR | 29 | NR | BM | AML (6), ALL (2), CML (1), NHL (1) | NR | NR | 120 d (20-480) | Anti-TCRVδ1 IHC | NR | 7 (70) | No association between γδ T-cell number and aGVHD | NR | NR | NR | NR |
| Diamond et al (1995)41 | 130 | NR | 33 (15-56) | MUD, SIB | BM | ALL (24), AML (30), CML (47), myeloma (6), MDS (5), AA (4), lymphoma (4), others (10) | NR | CSA, MTX, prednisone | NR | Anti-TCRγδ IHC | 1-3, 100 d | 50 (38) | Lymphocytic infiltrates from GIT, liver, and skin are memory αβ T cells | NR | NR | NR | NR |
| Hirokawa et al (2000)46 | 23 | NR | 32 (16-49) | MUD | PB (3) + BM (20) | ALL (3), AML (4), MDS (2), CML (2) | MAC | CSA, MTX | 1.5 y | Total γδ, Vδ-chain CDR3 spectratype | 1-3, 100 d | 5 (22) | No association between γδ T-cell number and aGVHD | NR | NR | NR | No association between γδ T-cell number and CMV reactivation |
| Galimberti et al (2006)47 | 20 | 13 (65) | 51 (35-66) | SIB | PB (20) | MM (20) | NMA | CSA, MTX | 35 mo (17-128) | Vδ-chain CDR3 spectratype, anti-TCRVδ2 IF | >2, 100 d | 8 (40) | Appearance of a new T-cell prominent clone after aGVHD onset | 6 (30) | Appearance of a new T-cell prominent clone after achieved MRD-negativity | 5 (25) | No new T-cell clones associated with CMV reactivation |
| Fujishima et al (2007)48 | 44 | 22 (50) | 30 (16-58) | MUD | PB (7) + BM (35) + CB (2) | AML (15), ALL/LBL (16), CML (8), MDS (3), AA (1), atypical CML (1) | MAC | CSA, MTX | 10 y | Total γδ, Vδ1, Vδ2, Vδ3, and Vδ1 CDR3 spectratype | >2, 100 d | 16 (36) | No association between Vδ1 TCR clonality and aGVHD | 14 (32) | No association between Vδ1 TCR clonality and relapse | 24 (54) | No association between Vδ1 TCR clonality and CMV reactivation. EBV is associated with Vδ1 skewed distribution |
| Koh et al (2007)49 | 20 | NR | NR | NR | NR | NR | NR | NR | 100 d | CD3+ TCRVδ2+ | lcGvHD and ecGvHD | 14 (70) | Reduced γδ T-cell count and frequency in cGVHD group | NR | NR | NR | NR |
| Barron et al (2009)50 | 38 | 19 (50) | 48 (20-72) | MUD (10), related (23), mismatched (5) | PB (35) + BM (2) + CB (1) | AML (15), MM (5), CML (5), ALL (4), lymphoma (4), CLL (2), MDS (2), PNH (1) | MAC, RIC, NMA | NR | 360 d | Total γδ (CD69+, IFNγ+ ELISPOT) | NR | NR | NR | NR | NR | 21 (55) | No difference on CMV-specific response mediated by γδ T cells (CD69+IFN-γ+) assessed by ELISPOT |
| Knight et al (2010)51 | 40 | 23 (57) | 37 (7-63) | SIB (23), MUD (15), mismatched (2) | BM (17) + PB (23) | ALL (7), AML (10), CML (3), MM (4), AA (4), NHL (6), HL (1), MDS (3), FasL deficiency (1), β-thalassemia (1) | MAC, RIC | NR | 24 mo | Total γδ, Vδ1, Vδ2, Vδ3 | NR | NR | NR | NR | NR | 6 (15) | Associated with Vδ2 population expansion between 3 and 12 mo after HSCT. Higher absolute numbers of Vδ2- population in CMV+/+ patient-donor pairs |
| Watanabe et al (2011)52 | 30 | 15 (50) | ≃44.15 (19-64) | Related, MUD | BM + PB + UCB | ALL (16), AML (9), MDS (4), AA (1) | MAC (21), RIC (9) | CSA, MTX, CST, FK | 1750 d | Total γδ, δ2 | >2, 100 d | NR | γδ T cells were significantly lowered in patients with aGVHD | NR | NR | NR | NR |
| Prinz et al (2013)31 | 1 | 1 (100) | 48 | HLA identical brother | NR | CLL (1) | NR | NR | 1 y | Total γδ, Vδ1, Vγ9 | NR | NR | NR | NR | NR | 1 (100) | CMV reactivation is associated with the expansion of Vδ1 |
| Farnault et al (2013)32 | 1 | 0 (0) | 14 | MUD | CB | ALL (1) | MAC | CSA. CST | 12 mo | Total γδ, Vδ1, Vδ2 | NR | NR | NR | NR | NR | 1 (100) | EBV infection resulted in significant Expansion of Vδ1+ cells |
| Lugthart et al (2014)33 | 131 | 88 (67) | ≃11 (0-19) | Related, MUD | BM (107) + PB (24) | Malignant (83), nonmalignant (48) | MAC (100%) | NR | 363 d (302-478) | Total γδ | >2, 100 d | 18 (14) | NR | NR | NR | 46 (35) | γδ T cell levels were twofold higher in patients with an early CMV reactivation |
| Airoldi et al (2015)34 | 27 | 15 (55) | 6 (0-17) | Related | αβ/CD19-depleted PB | ALL (9), AML (6), SCID (4), SDS (1), others (7) | MAC, RIC, NMA | None | Up to 7 mo | Total γδ, Vδ1, Vδ2 | NR | NR | NR | NR | NR | 15 (55) | Associated with the expansion of high-cytotoxic Vδ1 population between 1 and 3 mo after HSCT |
| Gao et al (2016)35 | 48 | NR | NR | NR | NR | NR | NR | NR | NR | Total γδ, Vδ1, Vδ2, FoxP3, gene expression | NR | 24 (50) | High total γδ, Vδ2, and FoxP3+ γδ/Vδ1/Vδ2 T cells in non-aGVHD patients | NR | NR | NR | NR |
| Hu et al (2017)36 | 62 | 41 (66) | 30 (15-48) | MUD (14), related (21), haplo (17), mismatched (10) | NR | ALL (30), AML (19), CML (5), MDS (6), lymphoma (2) | MAC, RIC | NR | 41.7 mo | Total γδ, FoxP3 | lcGvHD and ecGvHD | 41 (66) | Increased γδ Treg in non-cGvHD group | NR | NR | NR | NR |
| Laberko et al (2017)37 | 182 | 124 (68) | 6 (0-23) | MUD (124), Related (58) | αβ/CD19-depleted PB | ALL (46), AML (45), JML (9), NHL (9), MDS (5), nonmalignant (68) | MAC, RIC, NMA | FK, MTX, CSA, Abatacep, MMF, bortezomib | 27 mo | Total γδ | >2, 100 d | 73 (40) | NR | 67 (37) | NR | 93 (51) | CMV reactivation leads to higher absolute numbers of γδ T cells |
| Ravens et al (2017)12 | 33 | 19 (58) | 49 (18-69) | MUD (25), related (5), mismatched (3) | PB (32) + BM (1) | ALL (4), AML (16), CML (6), HL (1), MM (2), MDS (2), NHL (2) | MAC (10) + RIC (23) | NR | 180 d | TRG and TRD NGS, FACS anti-TCR γδ, Vδ2, Vγ9 | NR | NR | NR | NR | NR | 12 (36) | Proliferation of distinct γδ T-cell clones after reactivation of CMV |
| de Witte et al (2018)38 | 54 | 37 (38) | 50 (2-72) | MUD/SIB | PB (28), CB (26) | AML/MDS (29), other malignant (24), nonmalignant (1) | NR | CSA, MTX, CST, FK, sirolimus | 68 d (54-106) | Total γδ, Vδ1, Vδ2 | 2-4, <3 mo | 24 (44) | NR | 11 (20) | NR | 27 (50) | CMV reactivation is associated with Vδ1 expansion between 2-3 mo after HSCT |
| Winstead et al (2018)39 | 17 | 7 (41) | 2.4 (0.4-33.9) | MUD | BM (3) + CB (14) | Nonmalignant | RIC | MMF, FK | 180 d | TRG and TRD Spectratype (complexity score) | >2, 100 d | 4 (24) | Decreased TCR diversity in aGVHD patients | NR | NR | NR | NR |
| Kawanishi et al (1997)40 * | 273 | 161 (59) | 15.4 (1-52) | SIB (62), MUD (157), related (54) | TCD BM | ALL (95), AML (54), CML (49), MDS (15), AA (25), lymphoproliferative syndromes (25), other (10) | MAC | CSA | 2.2 y (5 mo-4.9 y) | Total γδ | >2, 100 d | 75 (27) | No association between γδ T-cells number and aGvHD | 71 (26) | No association between γδ T-cell number and relapse | NR | NR |
| Xuan et al (2011)42 * | 20 | 11 (55) | NR | SIB | PB | NR | NR | NR | NR | TRGV and TRDV spectratype (complexity score) | 1-4 | 8 (40) | The invariable clonality of TRDV1 gene repertoire is associated with low incidence of GVHD in recipients | NR | NR | NR | NR |
| Sairafi et al (2016)43 * | 14 | 8 (57) | 49 (30-64) | SIB (100%) | PB (100%) | AML (4), ALL (2), CLL (1), MDS (5), solid tumor (2) | MAC (100%) | CsA + MTX (85) other (15) | 3 mo | Total γδ | 2-4 <3 mo | 7 (50) | No-aGvHD group presented higher γδ T-cell percentage | NR | NR | NR | NR |
| Nilsson et al (2017)44 * | 21 | NR | 48 (1-68) | MUD (81%), SIB (19%) | PB (76%) + BM (24%) | Acute leukemia (14), MDS (4), lymphoma (1), myeloma (1), other (1) | NR | NR | 1 y | Total γδ | 1-3, <3 mo | 5 (24) | NR | 6 (28) | NR | 9 (43) | No association between intragraft γδ T-cell percentage and infection |
| Arruda et al (2019)45 * | 20 | 7 (35) | 59.5 (20-71) | MUD (85%), SIB (15%) | PB (100%) | AML (20) | MAC (25%), RIC (75%) | CsA + MTX (100) | 32.7 mo | Total γδ, Vγ9, δV1, Vδ2, γ-chain NGS | 1-4, 100 d | 12 (60) | No association between TRG distribution nor percentage of γδ, γ9, δ1, or δ2 T-cells and aGVHD incidence Public sequences and V-J pairing changes were associated with clinical improvement | 8 (40) | The intragraft percentage of γδ, γ9, δ1, or δ2 T cells were not associated with relapse | NR | CMV+ donors presented a more restricted TRG repertoire and private sequences |
ALL, acute lymphoid leukemia; AML, acute myeloid leukemia; ATG, antithymocyte globulin; BM, bone marrow; CAMPATH, anti-CD52 (alemtuzumab); cond., conditioning; CDR3, complementarity-determining region 3; CB, cord blood; CLL, chronic lymphoid leukemia; GIT, gastrointestinal tract; cGVHD, chronic GVHD; CsA, cyclosporin; CST, corticosteroids; ecGVHD, extensive cGVHD; FK, tacrolimus; haplo, haploidentical; HL, Hodgkin lymphoma; IHC, immunohistochemistry; IF, immunofluorescence; JMML, juvenile myelomonocytic leukemia; lcGVHD, limited cGVHD; MAC, myeloablative conditioning; MRD, minimal residual disease; MDS, myelodysplastic syndrome; MMF, mycophenolate; MTX, methotrexate; MUD, matched unrelated donor; MPAL, mixed phenotype acute leukemia; MDS-RCC, myelodysplastic syndrome-refractory cytopenia of childhood; MPD, methylprednisolone; MM, multiple myeloma; NHL, non-Hodgkin lymphoma; NR, nonreported; OKT3, muromonab-CD3; PB, peripheral blood; PTCy, posttransplantation cyclophosphamide; RIC, reduced intensity conditioning; SAA, severe aplastic anemia; SIB, matched sibling; SCID, severe combined immunodeficiency; SDS, Shwachman-Diamond syndrome; TCD, T-cell depleted; TRG, T-cell receptor γ-chain; TRD, T-cell receptor δ-chain.
Studies that only evaluated graft samples.
Summary of patients’ characteristics and γδ T-cell clinical outcomes (quantitative)
| aGVHD | Relapse | Viral infections | ||||||||||||||||
|---|---|---|---|---|---|---|---|---|---|---|---|---|---|---|---|---|---|---|
| Study | N | Male, n (%) | Donor age, median (range), y | Patient age, median (range), y | Donors (%) | Source | Diagnosis (n) | Conditioning (%) | GVHD prophylaxis (%) | Follow-up, median (range) | Timepoint | γδ Phenotype | Subgroups | Grade, d | n (%) | n (%) | Virus | n (%) |
| Lamb et al (1996)54 | 43 | NR | NR | NR | TCD PMRD | BM | ALL + AML (34), CML (9) | MAC (100) | CsA, MPD, ATG | 2.5 y | D+100 | Total γδ T cells | γδ T-cells percentage >10% | 1-4, <100 d | 1 (10) | 1 (10) | NR | NR |
| γδ T-cell percentage <10% | 1-4, <100 d | 12 (36) | 17 (51) | NR | NR | |||||||||||||
| Lamb et al (1999)5 | 100 | 64 (64) | 30 (1-67) | 25 (0-54) | TCD PMRD | BM | ALL + AML (58), CLL + CML (28), other (14) | MAC (100) | CsA, MPD, ATG | 35 mo | D+100 | Total γδ T cells | γδ T-cell percentage >10% | NR | NR | 1 (14) | NR | NR |
| γδ T-cell percentage <10% | NR | NR | 53 (57) | NR | NR | |||||||||||||
| Godder et al (2007)4 | 153 | 95 (62) | 27 (4-67) | 22 (0-59) | TCD PMRD | BM | AML (76), ALL (77) | MAC (100) | CsA, CST, ATG | 1771 d | 140 d | Total γδ T cells | γδ T-cell count > 1.75 × 10⁵ cells/mL | 1-4, <3 mo | 3 (16) | 5 (27) | CMV | 1 (5) |
| γδ T-cell count <1.75 × 10⁵ cells/mL | 1-4, <3 mo | 25 (18) | 48 (35) | CMV | 18 (13) | |||||||||||||
| Perko et al (2015)55 | 102 | 58 (57) | 11.3 (1.6-25.2) | 10.5 (0.6-25.2) | MUD (41), MRD (23), TCD haplo (31), CB (5) | BM + PB + CB | ALL (60), AML (42) | RIC (100) | CsA, MMF, MTX, FK, OKT3, CAMPATH | 2.7 y (0.12-6) | First year | Total γδ T cells | γδ T-cell count >1.5 × 10⁵ cells/mL | 1-4, <3 mo | 3 (27) | 1 (9) | CMV | 2 (18) |
| γδ T-cell count <1.5 × 10⁵ cells/mL | 1-4, <3 mo | 37 (40) | 19 (21) | CMV | 24 (26) | |||||||||||||
| Ho et al (2017)7 | 101 | 46 (46) | Autologous | 60 (28-75) | Autologous | PB | MM (101) | MAC (100) | Autologous | 1500 d | D+100 | Total γδ T cells | γδ T-cell count >top 3 quartiles (25$%-100) | NR | NR | 27 (35) | NR | NR |
| γδ T-cell count <lower quartile (0%-24) | NR | NR | 13 (55) | NR | NR | |||||||||||||
| Park et al (2018)56 | 50 | 25 (50) | NR | 12.1 (0.67-22.5) | TCD haplo | PB | ALL (10), AML (12), MPAL (2), JMML (2), MDS-RCC (5), lymphoma (3), SAA (8), relapsed solid tumor (5), Wiskott-Aldrich symptom (1), Kostmann syndrome (1), hemoglobinopathy (1) | MAC (100) | MMF, calcineurin inhibitors | 27 mo (13-53) | 30 d | Total γδ T cells | γδ T-cell percentage >70% | NR | NR | 1 (25) | CMV | 2 (22) |
| γδ T-cell percentage <21% | NR | NR | 5 (100) | CMV | 7 (87) | |||||||||||||
| Liu et al (2018)8 | 132 | 80 (60) | NR | 33 (18-59) | PMRD | BM + PB | ALL (50), AML (58), MDS (17), other (7) | MAC (100) | CsA, MTX, MMF | 3 mo | 30 d | Vδ2+ | Vδ2 counts >median | NR | NR | NR | EBV | 5 (7) |
| Vδ2 counts <median | NR | NR | NR | EBV | 11 (16) | |||||||||||||
| Bian et al (2018)6 | 40 | 24 (60) | 42 (14-58) | 25 (11-55) | PMRD | BM (20) + PB (20) | AML (15), ALL (21), MDS (3), other (1) | MAC (100) | CsA, MMF, MTX | 180 d | 1 mo | Total γδ, Vγ9+, Vδ1+, Vδ2+ | Vδ1 percentage >median | 2-4, <3 mo | 5 (25) | NR | CMV | 12 (60) |
| Vδ1 percentage <median | 2-4, <3 mo | 6 (30) | NR | CMV | 18 (90) | |||||||||||||
| Pabst et al (2007)17 | 63 | 41 (65) | NR | 48 (18-66) | MUD (100) | PB | AML/MDS (38), ALL (16), lymphoma (9) | MAC (100) | CsA + MTX (100) | 30.1 (0.6-62) mo | Graft | Total γδ T cells | γδ T-cels count >median | 2-4, <3 mo | 21 (66) | NR | NR | NR |
| γδ T-cell count <median | 2-4, <3 mo | 12 (40) | NR | NR | NR | |||||||||||||
| Xuan et al (2018)57 | 30 | 12 (40) | 33 (12-56) | 31 (14-47) | SIB | PB | Acute leukemia (30) | MAC (100) | CsA + MTX | 869 (147-981) d | Graft | CD27+Vδ1Tregs | CD27+Vδ1Tregs percentage >0.33% | 1-2, 100 d | 5 (22) | NR | NR | NR |
| CD27+Vδ1Tregs percentage <0.33% | 1-2, 100 d | 6 (75) | NR | NR | NR | |||||||||||||
| Gaballa et al (2019)53 | 105 | 62 (59) | 30 (23-38.5) | 52 (31.5-61) | SIB (26.7), MUD (62.8), others (10.5) | BM (16), PB (89) | Acute leukemia (54), chronic leukemia (7), MDS (19) lymphoma (6), MM (7), myelofibrosis (3), nonmalignant (9) | MAC (24.8), RIC (75.2) | CsA + MTX (92), PTCy (9), others (4) | 22 (15-30.5) mo | Graft | Total γδ, Vγ9, Vδ1, Vδ2 | Percentage total γδ >median | 1-3, 100 d | 20 (38) | 35 (67) | CMV | 33 (63) |
| Percentage total γδ <median | 1-3, 100 d | 18 (34) | 36 (68) | CMV | 32 (60) | |||||||||||||
CMV, cytomegalovirus; SAA, severe aplastic anemia.
All meta-analyzed studies were single cohorts that followed the patients for a median follow-up of 30 months. Most enrolled adult patients (median age, 32 years), males (median, 60%), with acute leukemias that received matched allogeneic bone marrow stem cells after a myeloablative conditioning (Table 2). GVHD prophylaxis was consistent among the studies and was based on cyclosporine and methotrexate. aGVHD incidence was reported in 7 studies,4,6,17,53-55,57 and the number of relapses was reported in 7 studies.4,5,7,53-56 Viral infections after HSCT were reported in 6 studies; CMV reactivation was reported in 5,4,6,53,55,56 whereas Epstein-Barr virus (EBV) reactivation in 1 study.8 OS was reported in 5 studies,4,7,53,55,56 whereas DFS was reported in 4.4,5,54,55 γδ T-cell content was defined primarily by anti-pan γδ T-cell receptor marker, despite some studies using anti-Vδ28 or anti-Vδ1.6,57 Six studies stratified patients using γδ T-cell percentage,5,6,53,54,56,57 whereas 5 used absolute counts.4,7,8,17,55 Three studies checked the intragraft γδ T-cell content,17,53,57 whereas 8 studies evaluated its immune reconstitution after HSCT and used 100 days posttransplantation as the median sampling timepoint for group definition.4-8,54-56
The risk of bias and confounding assessment depicted that all studies reported well-documented patient’s baseline characteristics, were selected appropriately, and had outcome measures consistently defined across all participants (supplemental Table 1). γδ T-cell stratification was consistently performed based on median values, with the exception of 2 studies that arbitrarily defined the threshold5,54 and 2 other studies that used health donors’ median γδ T-cell distribution as the cutoff.4,55 Potential confounders were taken into account in most of studies, including disease risk category as a competing risk (supplemental Table 1).5,53,54 No study reported blinding medical practitioners to γδ T-cell data.
Patients with high γδ T-cells during immune reconstitution after HSCT were more likely to present less relapse than patients with low γδ T-cell values (RR, 0.58; 95% CI, 0.40-0.84; P = .004; Figure 2). All studies reported a positive association between high γδ T cells and less incidence of relapse (I2 = 0%, P = .54). If the autologous HSCT is removed, there is still statistical significance and low heterogeneity across studies (RR, 0.50; 95% CI, 0.28-0.89; P = .002; I2 = 0%; supplemental Figure 1). Two qualitative studies also described that γδ T-cell clonotypes were associated with less relapse after HSCT (Table 1).45,47 Only 1 study assessed the γδ T-cell graft composition and observed no effect on relapse incidence (RR, 0.99; 95% CI, 0.76-1.29; P = .95).53 The pooled risk effect of both immune reconstitution and graft content further confirmed improved outcome for patients with high γδ T cells (RR, 0.65; 95% CI, 0.42-1.29; P = .05), although there was evidence of subgroup heterogeneity (I2 = 81.2%, P = .02).
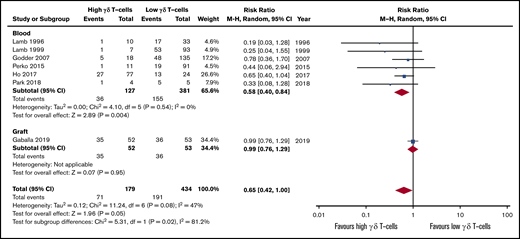
Forest plot of relapse data. Plot shows meta-analysis result of all assessed studies reporting number of relapses. Subgroup analysis according to the sample origin is also shown. Blue squares indicate the relative weight of each study in the meta-analysis and horizontal lines represent the 95% CI for the effect size. Larger squares show studies with higher relative weights. Weights are from random-effects analysis and are based on the size of the study and the number of events. Red diamonds represent the total effect size. M-H, Mantel-Haenszel.
Forest plot of relapse data. Plot shows meta-analysis result of all assessed studies reporting number of relapses. Subgroup analysis according to the sample origin is also shown. Blue squares indicate the relative weight of each study in the meta-analysis and horizontal lines represent the 95% CI for the effect size. Larger squares show studies with higher relative weights. Weights are from random-effects analysis and are based on the size of the study and the number of events. Red diamonds represent the total effect size. M-H, Mantel-Haenszel.
Higher γδ T-cell values after HSCT were also associated with lower incidence of viral infections (RR, 0.59; 95% CI, 0.43-0.82; P = .002; Figure 3). Statistical analysis revealed homogeneity of the data (I2 = 0%, P = .56). The sole study on grafts observed no correlation between γδ T-cell graft content and CMV reactivation (RR, 1.05; 95% CI, 0.78-1.42; P = .74).53 The pooled risk effect also indicates lower incidence of infections in patients with high γδ T cells after HSCT, although this was not significant (RR, 0.68; 95% CI, 0.45-1.02; P = .06). The studies included in the qualitative synthesis highlighted that the Vδ1 subtype mediates the antiviral effect31,32,38,48,51 and that distinct γδ T-cell clones are important in control of viral infection (Table 1).12,45
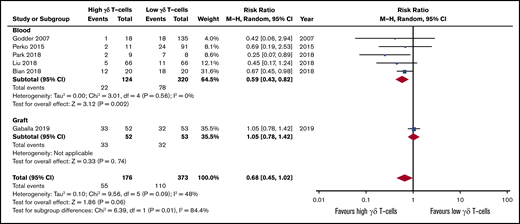
Forest plot of viral infection data. Plot shows meta-analysis result of all assessed studies reporting number of infections. Subgroup analysis according to the sample origin is also shown. Blue squares indicate the relative weight of each study in the meta-analysis and horizontal lines represent the 95% CI for the effect size. Larger squares show studies with higher relative weights. Weights are from random-effects analysis and are based on the size of the study and the number of events. Red diamonds represent the total effect size.
Forest plot of viral infection data. Plot shows meta-analysis result of all assessed studies reporting number of infections. Subgroup analysis according to the sample origin is also shown. Blue squares indicate the relative weight of each study in the meta-analysis and horizontal lines represent the 95% CI for the effect size. Larger squares show studies with higher relative weights. Weights are from random-effects analysis and are based on the size of the study and the number of events. Red diamonds represent the total effect size.
The OS and DFS follow-up period were not consistently reported among the studies, ranging from 2,7 2.5,54 3,5,56 4,53 and 5,55 up to 7 years.4 Only 1 study reported HR between high vs low γδ T-cell groups4 ; for all the others, we estimated the HR following standard guidelines.21 Patients presenting a higher count of γδ T cells after HSCT tended to experience higher OS (HR, 0.28; 95% CI, 0.18-0.44; P < .00001; Figure 4; Table 2) and DFS (HR, 0.29; 95% CI, 0.18-0.48; P < .00001; Figure 5). The heterogeneity was absent for both outcomes (I2 = 0%, P > .05). If the autologous HSCT is removed, there is still statistical significance and low heterogeneity across studies (HR, 0.23; 95% CI, 0.13-0.41; P < .00001; I2 = 0%; supplemental Figure 2). The intragraft γδ T-cell evaluation did not show a significant effect on OS (HR, 1.34; 95% CI, 0.59-3.05; P = .49), but depicted a high heterogeneity across studies (I2 = 62%, P = .02), although the overall effect remained statistically significant (HR, 0.36; 95% CI, 0.18-0.70; P = .003).
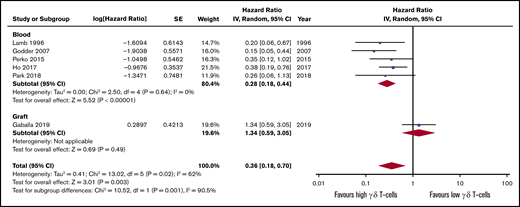
Forest plot of OS data. Plot shows meta-analysis result of all assessed studies reporting OS. Subgroup analysis according to the sample origin is also shown. Blue squares indicate the relative weight of each study in the meta-analysis and horizontal lines represent the 95% CI for the effect size. Larger squares show studies with higher relative weights. Weights are from random-effects analysis and are based on the size of the study and the number of events. Red diamonds represent the total effect size. IV, inverse variance. SE, standard error.
Forest plot of OS data. Plot shows meta-analysis result of all assessed studies reporting OS. Subgroup analysis according to the sample origin is also shown. Blue squares indicate the relative weight of each study in the meta-analysis and horizontal lines represent the 95% CI for the effect size. Larger squares show studies with higher relative weights. Weights are from random-effects analysis and are based on the size of the study and the number of events. Red diamonds represent the total effect size. IV, inverse variance. SE, standard error.
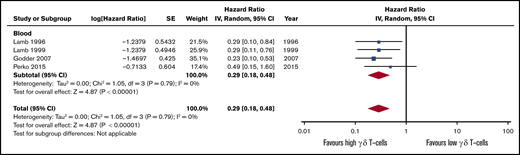
Forest plot of DFS data. Plot shows meta-analysis result of all assessed studies reporting DFS. Blue squares indicate the relative weight of each study in the meta-analysis and horizontal lines represent the 95% CI for the effect size. Larger squares show studies with higher relative weights. Weights are from random-effects analysis and are based on the size of the study and the number of events. Red diamonds represent the total effect size.
Forest plot of DFS data. Plot shows meta-analysis result of all assessed studies reporting DFS. Blue squares indicate the relative weight of each study in the meta-analysis and horizontal lines represent the 95% CI for the effect size. Larger squares show studies with higher relative weights. Weights are from random-effects analysis and are based on the size of the study and the number of events. Red diamonds represent the total effect size.
The effect of high γδ T-cell numbers after HSCT on aGVHD incidence was not significant (RR, 0.72; 95% CI, 0.41-1.27; P = .26; Figure 6), with no evidence of interstudy heterogeneity (I2 = 0%, P = .73). Intragraft γδ T-cell content studies reported discrepant results and presented high heterogeneity (I2 = 82%, P = .004). One study reported a higher incidence of aGVHD in the high γδ T-cell patient subgroup (RR, 1.70; 95% CI, 1.02-2.82),17 whereas more recent studies describe the protective role of these cells (RR, 0.30; 95% CI, 0.13-0.72)57 or that they do not affect aGVHD development (RR, 1.13; 95% CI, 0.68-1.88).53 The pooled risk effect further confirmed that high γδ T-cell content is not associated with aGVHD development (RR, 0.82; 95% CI, 0.50-1.35; P = .44), with high between-subgroup homogeneity (I2 = 0%, P = .66). Studies included on qualitative synthesis also indicated the lack of association between γδ T cells and aGVHD development (Table 1).30,35,36,40,41,43,45,46,48,49,52
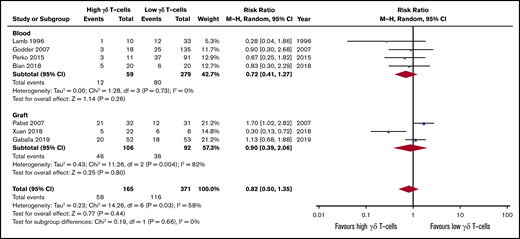
Forest plot of GVHD data. Plot shows meta-analysis result of all assessed studies reporting number of GVHD events. Subgroup analysis according to the sample origin is also shown. Blue squares indicate the relative weight of each study in the meta-analysis and horizontal lines represent the 95% CI for the effect size. Larger squares show studies with higher relative weights. Weights are from random-effects analysis and are based on the size of the study and the number of events. Red diamonds represent the total effect size.
Forest plot of GVHD data. Plot shows meta-analysis result of all assessed studies reporting number of GVHD events. Subgroup analysis according to the sample origin is also shown. Blue squares indicate the relative weight of each study in the meta-analysis and horizontal lines represent the 95% CI for the effect size. Larger squares show studies with higher relative weights. Weights are from random-effects analysis and are based on the size of the study and the number of events. Red diamonds represent the total effect size.
Discussion
Our systematic review and meta-analysis show that higher numbers of γδ T cells in peripheral blood after HSCT is associated with less risk of relapse, fewer infection events, and higher survival, with no risk association with GVHD development. γδ T cells are a unique and conserved population of innate immunity lymphocytes that play key roles in immune surveillance and tissue homeostasis.58 They represent just a small fraction of circulating T cells, but display the ability to expand in response to infections12 and exert antitumor effect.3 In contrast to αβ T cells, γδ T cells are mainly CD4−/CD8− and are not HLA-restricted. Because donor-derived γδ T cells may exert GVL effect without causing GVHD, large-scale methods to enrich, isolate, expand, and manipulate these cells for HSCT application are in progress and will clarify their full function in this setting.3 This meta-analysis is the first to suggest that the use γδ T cells in HSCT might be beneficial.
Observations that T cells are the key mediators of GVHD development led clinicians to ex vivo deplete T cells through CD34+ cell selection or removal of CD3+ T cells.1 These approaches result in loss of certain cell subsets that may play a beneficial role in the recipient. CD34+ selection was associated with slow immune recovery and high infection rate,59 whereas the removal of CD3+ T cells presented high infection and relapse rates.60 In fact, although αβ T cells mediate GVHD development, γδ T cells have lower alloreactivity and contribute to important anti-infectious activity,58 in addition to a possible antileukemia role.2,3 Despite reports of a positive association between γδ T cells and less disease relapse,4,5,54 no strong and unbiased evidence exists that these cells are indeed key players for successful HSCT. Our systematic review and meta-analysis suggest that in TCD PMRD,4,5,54 matched unrelated donor (MUD),55 autologous,7 and TCD haplo-HSCT,56 increased reconstitution of γδ T cells are positively associated with a significantly decreased risk of relapse. These results are sustained by specific γδ T-cell clonotypes from the graft donor45 that can expand after HSCT and exert antileukemic effect,47 supporting the notion that these cells could be broadly used in HSCT through enrichment methods or by post-HSCT infusions. Our results support the initial observations that the prompt reconstitution of γδ T cells after αβ T-/B-cell–depleted HSCT might be associated with the transplantation efficacy.11 More recently, an Italian multicenter study showed that αβ T-/B-cell depletion presented better relapse-free survival than MRD and MUD HSCT, highlighting the role of γδ T cells in protecting the host against leukemia relapse.10 The utilization of γδ T cells to mitigate the risk of relapse and to enhance immune reconstitution after HSCT continues to be under investigation. The successful use of αβ T-cell–depleted cell products as stem cell boosters after HSCT in patients with poor graft function, primary graft failure, and/or infectious complications was recently reported.18
CMV viremia is one of the most life-threatening infections after HSCT, being associated with high nonrelapse mortality in the first months posttransplant. Several works have reported a possible protective role of γδ T cells on infections.37 The first report described that high γδ T cells were not only protective of leukemia relapse but also in the control of CMV.4 Latter studies have shown that the Vδ1 subpopulation expands after CMV reactivation, playing a role in infection control.31,33,34,38,51,52 Recently, it was shown that CMV reactivation leads to clonal proliferation of individual virus-reactive γδ T-cell receptor (TCR) sequences, suggesting an adaptive antiviral γδ T-cell immune response.12 The same was observed in grafts from CMV+ donors in which several CMV-associated γδ T-cell clones had clonally expanded.45 Here we show that, although intragraft γδ T-cell counts were not associated with fewer infections, they play a role in host infection control and increased numbers of these cells after HSCT might be warranted to protect patients from opportunistic infections. Recently, αβ T cell–depleted donor lymphocyte infusions to treat patients with poor immune reconstitution and infections were reported with encouraging results.18 Eleven of 12 patients presented favorable responses with no increased risk of GVHD development, indicating that γδ T-cell–enriched donor lymphocyte infusion products are a viable option to improve HSCT efficacy and safety after transplantation.
The first reports evaluating the role of γδ T cells in GVHD pathogenesis are from the early 1990s.30,41 These studies provided no evidence that γδ T cells could mediate the pathogenesis of gut, liver nor epithelial lesions associated with GVHD,30 that were, in fact, mediated by αβ T cells.41 In the 2000s, several complementary studies used flow cytometry and molecular techniques (TCR spectratype) to corroborate that they are not mediating GVHD pathogenesis,46,48 with some controversies.39,47,49 Recently, long-term observation of 80 children given αβ T-/B-cell–depleted grafts showed no severe (grade 3-4) aGVHD, further indicating that γδ T cells might not be involved in GVHD pathogenesis.9 Thirty percent of the patients presented skin-only grade 1-2 aGVHD, and no extensive chronic GVHD was reported, despite not receiving any GVHD prophylaxis. Additionally, in an Italian multicenter study, 98 children receiving the same HSCT protocol showed significantly less GVHD incidence than MUD- and mismatched unrelated donor–treated patients.10 These studies advocate that the low GVHD incidence is due to αβ T-cell graft depletion together with γδ T-cell enrichment, which quickly reconstitute posttransplantation and gives support to hematopoiesis without triggering GVHD. Pabst et al reported an increased risk of aGVHD development in patient with enriched γδ T cells in the graft,17 whereas other reports showed no relation between γδ T cells and GVHD.40,42,43,53,57 Here, we show that there is no association between γδ T-cell reconstitution and GVHD development.
This systematic review depicts that only a few studies have assessed γδ T cells in graft composition and their effect on clinical outcome. More studies are necessary to better describe the role of these cells. Across the 3 studies reported, there were divergent results regarding aGVHD incidence. Pabst et al reported an increased risk of aGVHD development in patient with enriched γδ T cells in the graft,17 whereas other reports showed no relation between γδ T cells and GVHD.40,42,43,53,57
γδ T cells quickly reconstitute after HSCT9,11,12,34 and, at 1 month after HSCT, can expand and compose around 80% of total T cells.34 These cells are cytotoxic and effectively kill leukemia.5,34 Ravens et al reported a heterogeneous overlap of γδ T-cell sequences between donor and recipients repertoires posttransplantation, indicating that donor-derived γδ T cells are able to contribute to recipient’s pool, together with the de novo generation of thymic-derived cells.12 Long-term maintenance of γδ T cells might be key to achieve the beneficial outcomes of less relapse and infection events here cited, and it is conceivable that grafts enriched in γδ T-cell content will result in higher counts after HSCT. Indeed, sparing γδ T cells from the graft through αβ T-cell depletion resulted in significantly higher reconstitution of these cells when compared with pan T-cell depletion.5 In contrast, total T-cell depletion resulted in impaired γδ T-cell reconstitution and less beneficial effects.5 The survival advantage associated with high circulating numbers of γδ T cells is durable over 7 years following HSCT.4
Our study has limitations. The number of patients is low and the threshold definitions of high and low γδ T cells were divergent across reports and dependent on the timepoint of assessment. If assessed on day 30 after HSCT, patients with increased γδ T-cell numbers were those with >70%.56 But, if assessed at 100 days after HSCT, >10% is considered a high value.5,54 We propose that absolute counts are better and that the threshold of 1.75 × 10⁵ γδ T cells/mL is consistent across studies to define the high γδ T-cell content.4,55 Another limitation is the inclusion of heterogeneous transplantation methods, donors, and patients, which can jeopardize the effect of our findings. Of the 11 studies and 919 patients included in this meta-analysis, 378 (41%) patients were TCD transplants using PMRD, 172 (19%) other PMRD transplants, 251 (27%) MUD or MRD, and 101 (11%) autologous. The beneficial effects of γδ T cells were mainly from the 8 studies (721 patients) examining γδ T-cell reconstitution. Of this, only 70 patients (10%) were MUD/MRD, with the remainder being TCR, PMRD, or autografts. Additionally, of the 3 studies (198 patients) examining graft content, all were MUD/MRD and with essentially no impact of γδ T cells on infection or relapse. This indicates that, although γδ T cells are clearly a population of interest in HSCT, it is quite likely that their effect is context dependent, with more impact in the TCD setting. More studies are warranted to full address the role of these cells in HSCT.
In summary, our findings indicate that γδ T cells may play an important role in HSCT efficacy and safety, participating in both leukemia and infection control and resulting in higher survival of the patients, with no association with GVHD development.
Acknowledgment
The authors thank Olle Ringdén (Department of Laboratory Medicine, Karolinska Institute, Stockholm, Sweden) for the critical review of this manuscript.
Authorship
Contribution: L.C.M.A. searched the published work, produced the figures, collected, analyzed, and interpreted data, and wrote the report; A.G. searched the published work, collected and analyzed data, and wrote the report; M.U. analyzed and interpreted data and wrote the report; and all authors reviewed and revised the manuscript and approved the final version.
Conflict-of-interest disclosure: The authors declare no competing financial interests.
Correspondence: Lucas C. M. Arruda, Department of CLINTEC, Karolinska Institutet, ANA Futura, Alfred Nobel Allé 8, SE-141 52 Stockholm, Sweden; e-mail: lucas.arruda@ki.se.

