

TO THE EDITOR:
We appreciated the recent meta-analysis by Carobbio et al published in the 7 June 2019 issue of Blood Advances entitled “Leukocytosis and thrombosis in essential thrombocythemia and polycythemia vera: a systematic review and meta-analysis."1 The question of leukocytosis and the associated risk of thrombosis is one of vital clinical importance in patients with polycythemia vera (PV) and essential thrombocythemia (ET) because the answers are critical in developing improved risk-stratification tools for guiding management and informing the use of cytoreductive therapy, particularly in patients with persistent leukocytosis who are otherwise low risk by conventional scoring systems. Although we commend the authors’ attempt to systematically answer this question using meta-analytic techniques, we would like to highlight some methodologic limitations of their approach.
The first limitation pertains to the inappropriate combination of risk estimates with hazard estimates in their ET- and PV-only subgroup analyses. Because risk ratios represent the cumulative risk of an event over a defined period of time and hazard ratios represent a measure of instantaneous risk at any moment in the course of a study, they cannot be treated as interchangeable in a meta-analysis. In some circumstances, hazards can be converted such that consistency between hazard and risk estimates can be achieved, but this is not always the case.2
Another (minor) limitation involves the inclusion of a particular study within this meta-analysis, a post hoc analysis of Cytoreductive Therapy in Polycythemia Vera (CYTO-PV) by Barbui et al, which appeared in Blood in 2015.3 In that analysis, exposure was defined as leukocyte count measured at the same time as the event. By using exposure at the same time as the event, any change in the overall trend or distribution of the exposure over time confounds its association with the outcome. This is why exposures must be defined at one consistent time point (or period of time) across all patients in survival analyses.
Finally, although pooled effect estimates (with confidence intervals) are often the only reported results in meta-analyses, a wealth of published statistical research and commentary supports the additional reporting of prediction intervals when random effects models are used, when studies differ in terms of sampled populations and methodologies used, and especially if significant heterogeneity is present.4,-6 In simple terms, a 95% prediction interval reflects the variation in true treatment effects over different settings, thus providing a range in which the effect estimates of 95% of future studies will likely fall. It is thought that this will more accurately summarize the uncertainty of the effect of an intervention or exposure in an individual clinical setting. Because Carobbio et al draw heavily from a mix of prospective and retrospective analyses that involve 2 different myeloproliferative neoplasms and have vastly different cutoff definitions for leukocytosis, a prediction interval is arguably a more appropriate statistical summary of the findings in their random-effects meta-analysis. This is additionally supported by the large degree of heterogeneity present in the PV-only subgroup analysis, although there may also be a question of whether or not the presence of significant publication bias has influenced the heterogeneity estimate of the overall analysis as well.6 We therefore strongly feel that prediction intervals should be reported.
To this end, we calculated the relevant prediction intervals for the overall meta-analysis of patients with ET and PV and a PV-specific subgroup as presented in the original report, according to the method described by IntHout et al.5 For the overall meta-analysis, the 95% prediction interval is 1.23 to 2.05. For the PV-specific subgroup analysis, the prediction interval is 0.92 to 1.95. The respective forest plots from the original publication are reproduced with appropriate prediction intervals in Figures 1 and 2.
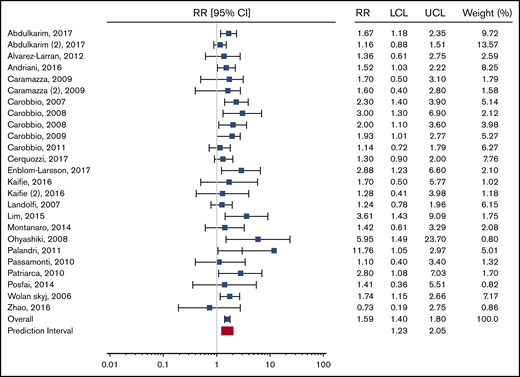
Recreation of Figure 2 from Carobbio et al “Forest plot of the random effects meta-analysis assessing the pooled relative risk (RR) of leukocytosis on the primary outcome (thrombosis)” with the prediction interval added (in red). LCL, lower confidence level; UCL, upper confidence level.
Recreation of Figure 2 from Carobbio et al “Forest plot of the random effects meta-analysis assessing the pooled relative risk (RR) of leukocytosis on the primary outcome (thrombosis)” with the prediction interval added (in red). LCL, lower confidence level; UCL, upper confidence level.
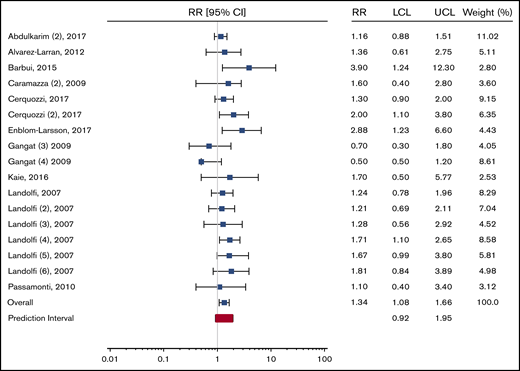
Recreation of PV-only subgroup analysis presented in Figure 3 from Carobbio et al “Forest plot of the subgroup analysis on the primary outcome according to MPN diagnosis” with the prediction interval added (in red).
Recreation of PV-only subgroup analysis presented in Figure 3 from Carobbio et al “Forest plot of the subgroup analysis on the primary outcome according to MPN diagnosis” with the prediction interval added (in red).
Because the prediction interval in the PV-specific subanalysis crosses the null, a clear degree of uncertainty remains regarding the association between leukocytosis and thrombosis in patients with PV. We therefore caution readers against interpreting the results of this meta-analysis as evidence for changing clinical management or consensus criteria for PV patients. Rather than searching for the white blood cell count cutoff that provides the best prognostic accuracy, we feel that the best answer to the ongoing question regarding leukocytosis and its association with thrombosis would come from a prospective clinical trial of leukocyte control in PV patients with persistent leukocytosis.
Contribution: L.R. conceived of the idea for and wrote the letter; J.M. critically revised the letter for important intellectual content and sourcing; and E.L.M. performed prediction interval calculations, produced figures, and critically revised the letter for important intellectual content and sourcing.
Conflict-of-interest disclosure: J.M. receives research funding from Incyte, Novartis, Roche, Promedior, Janssen, PharmaEssentia, and CTI Biopharma; and serves as an advisory board member for Incyte, Roche, Celgene, and PharmaEssentia. The remaining authors declare no competing financial interests.
Correspondence: John Mascarenhas, Division of Hematology/Oncology, Tisch Cancer Institute, Icahn School of Medicine at Mount Sinai, 1 Gustave L. Levy Pl, Box 1079, New York, NY 10029; e-mail: john.mascarenhas@mssm.edu.

