

Key Points
Flow cytometric analysis of p47phox expression in permeabilized neutrophils quickly identifies patients and carriers of p47phox CGD.
Genomic ddPCR identifies patients and carriers of ΔGT NCF1, the most common mutation in p47phox CGD.

Abstract
Mutations in NCF1 (p47phox) cause autosomal recessive chronic granulomatous disease (CGD) with abnormal dihydrorhodamine (DHR) assay and absent p47phox protein. Genetic identification of NCF1 mutations is complicated by adjacent highly conserved (>98%) pseudogenes (NCF1B and NCF1C). NCF1 has GTGT at the start of exon 2, whereas the pseudogenes each delete 1 GT (ΔGT). In p47phox CGD, the most common mutation is ΔGT in NCF1 (c.75_76delGT; p.Tyr26fsX26). Sequence homology between NCF1 and its pseudogenes precludes reliable use of standard Sanger sequencing for NCF1 mutations and for confirming carrier status. We first established by flow cytometry that neutrophils from p47phox CGD patients had negligible p47phox expression, whereas those from p47phox CGD carriers had ∼60% of normal p47phox expression, independent of the specific mutation in NCF1. We developed a droplet digital polymerase chain reaction (ddPCR) with 2 distinct probes, recognizing either the wild-type GTGT sequence or the ΔGT sequence. A second ddPCR established copy number by comparison with the single-copy telomerase reverse transcriptase gene, TERT. We showed that 84% of p47phox CGD patients were homozygous for ΔGT NCF1. The ddPCR assay also enabled determination of carrier status of relatives. Furthermore, only 79.2% of normal volunteers had 2 copies of GTGT per 6 total (NCF1/NCF1B/NCF1C) copies, designated 2/6; 14.7% had 3/6, and 1.6% had 4/6 GTGT copies. In summary, flow cytometry for p47phox expression quickly identifies patients and carriers of p47phox CGD, and genomic ddPCR identifies patients and carriers of ΔGT NCF1, the most common mutation in p47phox CGD.
Introduction
Chronic granulomatous disease1 is caused by defects in any 1 of 5 subunits of the phagocyte nicotinamide adenine dinucleotide phosphate (NADPH) oxidase (phox). In the Western world, defects in p47phox account for 25% of chronic granulomatous disease (CGD) patients, second only to gp91phox as a cause of CGD.2 However, in the Middle East and India,3-5 where consanguineous marriage are more common, defects in p47phox are often a more frequent cause of CGD compared with gp91phox. CGD is characterized by a failure of phagocytes (neutrophils, monocytes, macrophages, and eosinophils) to generate superoxide anion radical ( ) and other related reactive oxygen species (ROS), leading to recurrent infections, inflammation, and increased mortality.6 Phorbol ester induces ROS production in vitro, which can be quantitated by ferricytochrome c reduction, luminol-enhanced chemiluminescence, or ROS-mediated dihydrorhodamine (DHR) oxidation, detected using flow cytometry. In general, neutrophils from CGD patients exhibit very little ROS production. However, neutrophils from patients with p47phox CGD have residual ROS production7 that is associated with a more favorable clinical course.2 On DHR assay, p47phox CGD neutrophils have a broad population of low ROS-producing cells. Although these clinical laboratory findings suggest the diagnosis of p47phox CGD, they are not specific. The definitive diagnosis is based on immunoblotting for p47phox or detection of specific mutations. These approaches cannot reliably identify clinically asymptomatic, autosomal recessive carriers of p47phox CGD, complicating genetic counseling and leaving important questions about etiology and mechanism unanswered.8
Identification of the specific mutations in NCF19 is complicated by highly homologous (>98%) pseudogenes (differences identified in supplemental Table 1) that are thought to have arisen through gene duplication.8 Wild-type NCF1 gene has a GTGT at the start of exon 2, whereas the pseudogenes (NCF1B and NCF1C) have only a single GT (ΔGT). We developed a rapid, flow cytometer-based assay for p47phox expression in permeabilized whole-blood neutrophils to phenotypically identify both p47phox CGD patients and carriers. To address the genetic mechanisms, we developed a novel droplet digital polymerase chain reaction (ddPCR) assay to calculate the relative number of GTGT copies (in genomic DNA, typically 2) compared with ΔGT copies (typically 4) and the copy number variation (CNV) at the NCF1 locus to genotypically identify ΔGT p47phox CGD patients and carriers. These assays provide tools to diagnose autosomal carriers of p47phox CGD
Methods
Protocol numbers for patients and normal subjects
Heparinized bloods from both normal subjects and patients with CGD were drawn after documented informed consent in accordance with the Declaration of Helsinki under the Frederick Research Donor Program Protocol OH99-C-N046 and National Institutes of Health (NIH) protocols 93-I-0119, 07-I-0033, 95-I-0066, and 05-I-0213. To augment the diversity within our DNA cohort, an additional 75 anonymous DNAs from Asian, African American, and Hispanic individuals were obtained from a commercial supplier (BioServe Biotechnologies Ltd, Beltsville, MD)
Isolation of neutrophils and peripheral blood mononuclear cells
Peripheral blood neutrophils and mononuclear cells were harvested from diluted blood by discontinuous gradient centrifugation, as described previously.10 In general, the final preparation of neutrophils was more than 95% pure with about 4% eosinophils, and less than 1% monocytes and lymphocytes, as assessed by differential staining.
NADPH oxidase activity and detection of oxidase components
ROS production was measured using the dihydrorhodamine oxidation and cytochrome c reduction assays, as previously described.11 A longer, 60-minute incubation with cytochrome c was found to differentiate the response in patients with detectable production vs patients with undetectable production.7 Western blot analysis to determine oxidase components was performed as described.11 For quantitative immunoblotting of p47phox, 20 μg neutrophil lysate (Thermo Scientific Pierce BCA Protein Assay using albumin standard) was resolved by electrophoresis and transferred to polyvinylidene difluoride membrane. The membrane was incubated overnight with goat anti-p47phox (#1588) polyclonal antibody (provided by Tom Leto and Harry Malech, National Institute of Allergy and Infectious Diseases, NIH, diluted 1:1000). The membrane was incubated with donkey anti-goat secondary antibody (Abcam, diluted 1:20 000) for 1 hour. Enhanced chemiluminescence substrate (Clarity Western ECL Substrate, Bio-Rad) was added to develop p47phox. Equal regions were drawn around each band, and pixel density/area was analyzed using Image Laboratory software (Bio-Rad). The blot was stripped and probed with mouse anti-actin (Millipore, diluted 1:5000). Actin was quantitated similarly and used to normalize the protein loading.
Flow cytometry analysis of p47phox protein expression
Using modifications of the methods described by Köker et al12 and Wada et al,13 2 aliquots of EDTA whole blood (25 µL) were mixed with Reagent 1 (100 µL) of IntraPrep Permeabilization kit (Beckman Coulter, A07803), vortexed vigorously, and incubated at room temperature for 15 minutes. Cells were washed with phosphate-buffered saline and spun for 5 minutes at 300g. Reagent 2 (100 µL) from IntraPrep kit was added gently without vortexing, and cells were further incubated for 5 minutes at room temperature. Tubes were shaken slowly, and then either rabbit recombinant monoclonal anti-p47phox antibody (10 µL, Abcam [EPR13134]) or rabbit immunoglobulin G1 monoclonal antibody (0.5 µL, Abcam [EPR25A]) were added. Tubes were incubated for 30 minutes at room temperature, washed, and spun at 600g for 5 minutes. The supernatant fluid was decanted and AlexaFluor488-labeled goat anti-mouse immunoglobulin G (1 µL) was added and incubated at room temperature for 30 minutes. Cells were washed twice, pelleting the cells at 600g for 5 minutes. Cells were resuspended in 200 µL phosphate-buffered saline/0.5% bovine serum albumin and analyzed on a BD FACSCanto II flow cytometer (BD Biosciences), gating on neutrophils using light scatter. At least 10 000 cells were analyzed in the neutrophil gate.
Genotyping with ddPCR
For analysis of the number of GTGT and ΔGT copies in NCF1, NCF1B, or NCF1C, a PCR reaction master mix was made as follows: 11 µL 2X master mix for probes, 2.2 µL 20X assay containing PCR primers and 2 distinct probes: a 6-carboxyfluoresein–containing probe that recognizes the GTGT found in NCF1 (blue fluorescence) and a 2′-chloro-7′-phenyl-1,4-dichloro-6-carboxyfluorescein–containing probe that recognizes the ΔGT found in NCF1B and NCF1C (green fluorescence) and 7.8 µL H2O (sequences of the probes used are listed in supplemental Table 2). An aliquot (21 µL) of PCR master mix was added to each reaction well in 96-well plate or strip tubes, and then 1 µL genomic DNA was added to each well/tube. Input genomic DNA was diluted to 5 to 20 ng/µL in either water or TrisEDTA (low EDTA-TE) for optimal detection. Reaction mix (20 µL) was transferred to the sample well of a BioRad DG8 cartridge. Oil (70 µL) was added to the BioRad QX-100 droplet generator to generate the oil-enclosed reaction droplets. Droplets (40 µL) were transferred to an Eppendorf Twin.tec semiskirted 96-well PCR plate, and the plate was sealed. PCR reaction was performed on a BioRad T100 thermal cycler under the following conditions: 95°C for 10 minutes, 94°C for 30 seconds, 60°C for 60 seconds for 40 cycles, ramp rate 2°C/s, followed by 98°C for 10 minutes, and then held at 4°C. The plate was read on a BioRad QX200 droplet reader, and the data were analyzed using BioRad QuantaSoft 1.5 to determine the number of blue GTGT and green ΔGT droplets. Data were expressed as the proportional fraction of GTGT droplets (ie, the number of GTGT droplets divided by sum [GTGT + ΔGT] droplets) or a proportional fraction of the ΔGT droplets (ie, the number of ΔGT droplets divided by sum [GTGT + ΔGT] droplets; Figure 1). This assay simply quantitates GTGT and ΔGT sequences, regardless of whether these sequences are within their respective genes or within “fusion” genes that result from DNA recombination.14,15 Despite the diversity of possible gene products, the ddPCR data are sufficient to segregate the patients, carriers, and kindred in most p47phox CGD families. Advanced technologies such as multiplex ligation-dependent probe amplification are required to delineate the specific NCF1 defect.
![Figure 1. Analysis of NCF1 by ddPCR. Two distinct probes (one that recognizes the GTGT [blue] found in NCF1 and a second that recognizes the ΔGT [green] found in NCF1B and NCF1C) were added to diluted genomic DNA. A 20-µL PCR mixture was dispersed into 20 000 oil-coated nanodrops, and PCR was performed. The droplets were analyzed to determine the number of “Blue” and “Green” nanodrops. The image at the bottom left depicts the bead distribution of the ddPCR reaction. The clear beads represent beads without GTGT or ΔGT sequences, and therefore have no amplified probe or color. The blue beads represent beads containing a GTGT sequence and PCR amplification of the GTGT-specific probe. The green beads represent beads containing a ΔGT sequence and PCR amplification of the ΔGT-specific probe. Although the DNA has been diluted to minimize the number of double-colored droplets, they do occur and are included in the analysis. However, they are detected in independent channels and, therefore, do not affect the results. The text at the bottom right depicts the possible sequences in the example in the top of the panel. Because a total of 6 alleles were expected, normal subjects were predicted to yield 2 GTGT/4 ΔGT, p47phox carriers were predicted to yield 1 GTGT/5 ΔGT, and patients with p47phox CGD were predicted to yield 0 GTGT/6 ΔGT.](https://ash.silverchair-cdn.com/ash/content_public/journal/bloodadvances/3/2/10.1182_bloodadvances.2018023184/2/m_advances023184f1.png?Expires=1767706807&Signature=d-vmtOsS5qHkVGDhWVB3reBeioJPW5z-qiA8ZMlmHOLUIN9rrgQTZ~PHTdClMdPh1128n7IdcOI~iWk1fWYaElJx5LHvMeUpcj39lVOYML5LuHtmGweehuqusnAz54w60aXuvEtwl2uHQlevDw2CI0vKdtZOVKQbjq8QhGuAgCe5jHfVRv-wQezrZoXnB5BUg7jW-cR4EtkQ6sb3kOIKFBkKWJYWZ0WAnYL9tENvHTIlqsBCrBg-C0KS9OrlvEsQVE1JITH5M6~6Da~r8YCTKFFMpIhOFaC60pqDZf3S~9Ye0fSo4aR4Ophm9vtS8nXqYp1iR6uDJSd5TNz3PVmvXQ__&Key-Pair-Id=APKAIE5G5CRDK6RD3PGA)
Analysis of NCF1 by ddPCR. Two distinct probes (one that recognizes the GTGT [blue] found in NCF1 and a second that recognizes the ΔGT [green] found in NCF1B and NCF1C) were added to diluted genomic DNA. A 20-µL PCR mixture was dispersed into 20 000 oil-coated nanodrops, and PCR was performed. The droplets were analyzed to determine the number of “Blue” and “Green” nanodrops. The image at the bottom left depicts the bead distribution of the ddPCR reaction. The clear beads represent beads without GTGT or ΔGT sequences, and therefore have no amplified probe or color. The blue beads represent beads containing a GTGT sequence and PCR amplification of the GTGT-specific probe. The green beads represent beads containing a ΔGT sequence and PCR amplification of the ΔGT-specific probe. Although the DNA has been diluted to minimize the number of double-colored droplets, they do occur and are included in the analysis. However, they are detected in independent channels and, therefore, do not affect the results. The text at the bottom right depicts the possible sequences in the example in the top of the panel. Because a total of 6 alleles were expected, normal subjects were predicted to yield 2 GTGT/4 ΔGT, p47phox carriers were predicted to yield 1 GTGT/5 ΔGT, and patients with p47phox CGD were predicted to yield 0 GTGT/6 ΔGT.
Analysis of NCF1 by ddPCR. Two distinct probes (one that recognizes the GTGT [blue] found in NCF1 and a second that recognizes the ΔGT [green] found in NCF1B and NCF1C) were added to diluted genomic DNA. A 20-µL PCR mixture was dispersed into 20 000 oil-coated nanodrops, and PCR was performed. The droplets were analyzed to determine the number of “Blue” and “Green” nanodrops. The image at the bottom left depicts the bead distribution of the ddPCR reaction. The clear beads represent beads without GTGT or ΔGT sequences, and therefore have no amplified probe or color. The blue beads represent beads containing a GTGT sequence and PCR amplification of the GTGT-specific probe. The green beads represent beads containing a ΔGT sequence and PCR amplification of the ΔGT-specific probe. Although the DNA has been diluted to minimize the number of double-colored droplets, they do occur and are included in the analysis. However, they are detected in independent channels and, therefore, do not affect the results. The text at the bottom right depicts the possible sequences in the example in the top of the panel. Because a total of 6 alleles were expected, normal subjects were predicted to yield 2 GTGT/4 ΔGT, p47phox carriers were predicted to yield 1 GTGT/5 ΔGT, and patients with p47phox CGD were predicted to yield 0 GTGT/6 ΔGT.
A second ddPCR reaction was used to determine the number of NCF1/NCF1B/NCF1C copies relative to the single-copy gene, telomerase reverse transcriptase (TERT). Sequences of the probes used for the invariant region of exon 11 of NCF1 are listed in supplemental Table 2; probes used for the TERT gene were proprietary and obtained from Thermo Fisher Scientific (Waltham, MA). Multiplying the proportional fraction of GTGT droplets by the total number of NCF1/NCF1B/NCF1C copies yields the total number of GTGT-containing copies; similarly, multiplying the proportional fraction of ΔGT droplets by the total number of NCF1/NCF1B/NCF1C copies yields the total number of ΔGT-containing copies. Because a total of 6 copies of NCF1/NCF1B/NCF1C are expected, normal subjects are predicted to have 2 GTGT copies vs 4 ΔGT copies expressed as 2/(2+4) or 2/6; autosomal recessive p47phox carriers are predicted to have 1 GTGT copy and 5 ΔGT copies, or 1/6; and p47phox CGD patients are predicted to have 0 GTGT copies and 6 ΔGT copies, or 0/6.
PacBio sequencing and data analysis
A PacBio cDNA library derived from mRNA isolated from patient EBV-transformed B cells was prepared using the PacBio standard 2 kb template preparation protocol. After sequencing by PacBio RS II, circular consensus sequence reads were generated by the SMRT Analysis software with default parameters. The sequence alignment was performed by Burrows-Wheeler Aligner software; mutations were identified using VarScan 2.
Results
ROS production by p47phox patients and carriers
The laboratory CGD diagnosis is based on abnormal phagocyte ROS production. ROS production in neutrophils from patients with p47phox CGD is slightly increased compared with most other subtypes of CGD, but still markedly lower than normal.2 The residual oxidase activities of patients with p47phox CGD, measured by -dependent ferricytochrome c reduction, are concentrated in the upper half of the NIH CGD cohort (Figure 2A). In an earlier study CGD patients’ residual neutrophil oxidase activity correlated with prognosis. Patients were grouped into 4 quartiles based on residual oxidase activity (quartile 1: least residual activity; quartile 4: most residual activity) and clinical prognosis correlated with the quartile score. Most p47phox CGD patients fit in either quartile 3 or quartile 4.2 The higher residual ROS production in p47phox CGD was also evident by DHR (Figure 2B) and is often used to guide diagnosis.
![Figure 2. ROS production in patients and carriers of gp91phox and p47phox CGD. (A) Scatter plots represent the residual oxidase activity of phorbol 12-myristate 13-acetate (PMA)–stimulated (100 ng/mL) neutrophils isolated from individual patients and carriers of gp91phox and p47phox CGD determined using ferricytochrome c reduction. The region in gray is the normal range (129.9-346.3 nmoles/106 cell/60 minutes) based on data from neutrophils isolated from 922 healthy volunteers (mean ± 2 standard deviation [SD]). As previously reported, neutrophils from p47phox CGD patients have increased ROS production compared with most gp91phox CGD patients.2 Neutrophils from all carriers of p47phox CGD exhibit ROS production that falls within the normal range. (B) Histograms represent the residual oxidase activity of neutrophils from patients and carriers of gp91phox and p47phox CGD, determined using dihydrorhodamine oxidation by flow cytometry. Neutrophil populations were gated using forward and right-angle light scattering. Open histograms represent ROS production of neutrophils treated with buffer under basal conditions; the solid gray histograms represent ROS production of neutrophils in response to PMA (400 ng/mL). The vertical dotted line represents the peak of buffer-treated neutrophils, and the vertical dashed line represents the peak of PMA-treated neutrophils.](https://ash.silverchair-cdn.com/ash/content_public/journal/bloodadvances/3/2/10.1182_bloodadvances.2018023184/2/m_advances023184f2.png?Expires=1767706807&Signature=npoJPo6-lqqERLq38hwbMze641Q4SvZEI2q98rvoDn22TRR8HQLco8a1L6Kx3A8yLjXvzEzm8Ac-ENPl-sA-tlqNhkpl6~MdETab3kf4jrNEKS8as7dYzShZVNbSBlTZDtSJwGwKC2lW-sX6pmzqMRM5Xt1wvLiMd2HnTRs8-e-FAK9cTTU2D8tFKtdB0hknzjjm-2v6fgtURTc2LxRyHmfG73iHgVALcKKP2qBff8jItOo6Z4ZxPPShaY4PocLEh3v8rHnY8L0Jc5PSJ7ZsnmLJbVzsP-Fs~BDWTXo-48cgFrRJOgz0Clmepy9Ka-pD91jXC7zEKkttfe68YXF~Og__&Key-Pair-Id=APKAIE5G5CRDK6RD3PGA)
ROS production in patients and carriers of gp91phoxand p47phoxCGD. (A) Scatter plots represent the residual oxidase activity of phorbol 12-myristate 13-acetate (PMA)–stimulated (100 ng/mL) neutrophils isolated from individual patients and carriers of gp91phox and p47phox CGD determined using ferricytochrome c reduction. The region in gray is the normal range (129.9-346.3 nmoles/106 cell/60 minutes) based on data from neutrophils isolated from 922 healthy volunteers (mean ± 2 standard deviation [SD]). As previously reported, neutrophils from p47phox CGD patients have increased ROS production compared with most gp91phox CGD patients.2 Neutrophils from all carriers of p47phox CGD exhibit ROS production that falls within the normal range. (B) Histograms represent the residual oxidase activity of neutrophils from patients and carriers of gp91phox and p47phox CGD, determined using dihydrorhodamine oxidation by flow cytometry. Neutrophil populations were gated using forward and right-angle light scattering. Open histograms represent ROS production of neutrophils treated with buffer under basal conditions; the solid gray histograms represent ROS production of neutrophils in response to PMA (400 ng/mL). The vertical dotted line represents the peak of buffer-treated neutrophils, and the vertical dashed line represents the peak of PMA-treated neutrophils.
ROS production in patients and carriers of gp91phoxand p47phoxCGD. (A) Scatter plots represent the residual oxidase activity of phorbol 12-myristate 13-acetate (PMA)–stimulated (100 ng/mL) neutrophils isolated from individual patients and carriers of gp91phox and p47phox CGD determined using ferricytochrome c reduction. The region in gray is the normal range (129.9-346.3 nmoles/106 cell/60 minutes) based on data from neutrophils isolated from 922 healthy volunteers (mean ± 2 standard deviation [SD]). As previously reported, neutrophils from p47phox CGD patients have increased ROS production compared with most gp91phox CGD patients.2 Neutrophils from all carriers of p47phox CGD exhibit ROS production that falls within the normal range. (B) Histograms represent the residual oxidase activity of neutrophils from patients and carriers of gp91phox and p47phox CGD, determined using dihydrorhodamine oxidation by flow cytometry. Neutrophil populations were gated using forward and right-angle light scattering. Open histograms represent ROS production of neutrophils treated with buffer under basal conditions; the solid gray histograms represent ROS production of neutrophils in response to PMA (400 ng/mL). The vertical dotted line represents the peak of buffer-treated neutrophils, and the vertical dashed line represents the peak of PMA-treated neutrophils.
p47phox in human PMNs by immunoblotting and flow cytometry
Because carriers of p47phox CGD are clinically asymptomatic, we developed a flow cytometer-based protocol for intracellular detection of p47phox in polymorphonuclear neutrophils (PMNs) from whole blood (Figure 3A). Flow cytometric analysis of p47phox expression in permeabilized neutrophils from healthy volunteers, p47phox CGD patients, and p47phox CGD carriers resolved into 3 distinct populations, with carriers having ∼60% of the expression observed in healthy volunteers (Figure 3B). Importantly, this assay appeared to be independent of the specific NCF1 mutation, in that the protein expression from carriers of the ΔGT mutation (open circles in Figure 3B-D) was comparable to that observed in carriers of non-ΔGT mutations (solid red circles in Figure 3B-D). To validate the flow cytometric assay, parallel samples from a subset of normal subjects, affected patients, and carriers of p47phox CGD were subjected to both quantitative immunoblot analysis (Figure 3C) and fluorescence-activated cell sorter (FACS) analysis for p47phox detection (Figure 3C) and a correlation of the immunoblot with FACS analysis of the same samples (Figure 3D). Immunoblotting of PMN showed that carriers of p47phox CGD had ∼50% of the expression of p47phox found in normal subjects after normalization to β-actin, whereas patients with p47phox CGD exhibited little, if any, expression of p47phox. Therefore, flow cytometry and immunoblotting for assessing p47phox expression in healthy volunteers, p47phox carriers, and p47phox-affected individuals is concordant between the 2 assays (Figure 3D), with an r2 value of 0.89. Flow cytometric analysis of p47phox expression in neutrophils is a rapid assay in which fixed permeabilized neutrophils can be tested in any clinical laboratory. However, given that there is some overlap of p47phox expression by flow cytometry between healthy volunteers and p47phox CGD carriers, ddPCR and immunoblotting, as shown in Figure 3C, although more labor intensive and time consuming, can provide additional robustness to the final diagnosis.
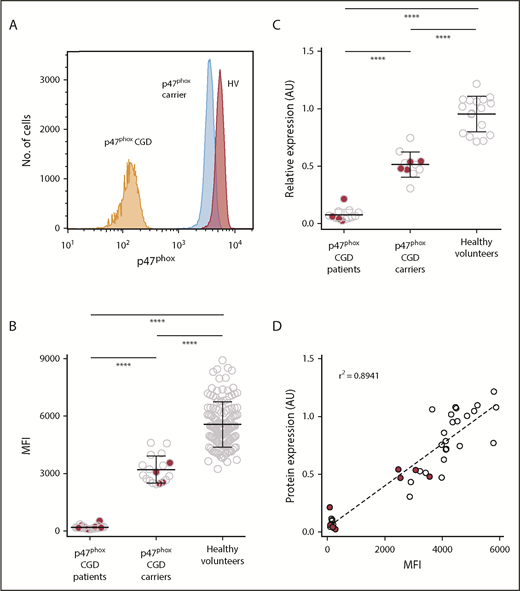
Quantitative analysis of p47phoxexpression by FACS analysis and immunoblotting. To determine p47phox expression, whole blood was permeabilized/fixed and then stained with anti-p47phox antibody. Neutrophils were gated using forward and right-angle light scatter. The level of p47phox expression on neutrophils is presented as the mean fluorescence intensity (MFI). (A) Relative histograms of a p47phox CGD patient, a p47phox CGD carrier, and a healthy volunteer. Summary data of the different populations are presented as scatter plots (B). Solid red circles in panels B, C, and D represent p47phox patients and carriers with non-ΔGT mutations in NCF1. (C) A subset of patients and carriers of p47phox CGD and healthy volunteers were analyzed for p47phox expression by immunoblotting. The data for of p47phox expression are presented as arbitrary units relative to the expression of β-actin. Neutrophil lysates from at least 2 healthy normal volunteers were analyzed on each gel, and the mean ratio of p47phox:β-actin for the normal samples was set to a value of 1.0. (D) The correlation obtained from parallel studies analyzing the expression of p47phox by both flow cytometry and immunoblotting. ****P < .0001 (1-way analysis of variance using Tukey’s multiple comparison).
Quantitative analysis of p47phoxexpression by FACS analysis and immunoblotting. To determine p47phox expression, whole blood was permeabilized/fixed and then stained with anti-p47phox antibody. Neutrophils were gated using forward and right-angle light scatter. The level of p47phox expression on neutrophils is presented as the mean fluorescence intensity (MFI). (A) Relative histograms of a p47phox CGD patient, a p47phox CGD carrier, and a healthy volunteer. Summary data of the different populations are presented as scatter plots (B). Solid red circles in panels B, C, and D represent p47phox patients and carriers with non-ΔGT mutations in NCF1. (C) A subset of patients and carriers of p47phox CGD and healthy volunteers were analyzed for p47phox expression by immunoblotting. The data for of p47phox expression are presented as arbitrary units relative to the expression of β-actin. Neutrophil lysates from at least 2 healthy normal volunteers were analyzed on each gel, and the mean ratio of p47phox:β-actin for the normal samples was set to a value of 1.0. (D) The correlation obtained from parallel studies analyzing the expression of p47phox by both flow cytometry and immunoblotting. ****P < .0001 (1-way analysis of variance using Tukey’s multiple comparison).
ddPCR characterization of NCF1
To circumvent the sequencing challenges of NCF1, we developed a pair of ddPCR assays. One assay contains probes for the intact, wild-type GTGT (found in NCF1) and ΔGT (found in NCF1B and NCF1C) and determines their relative distribution in a genomic DNA sample. Because these probes exclude each other, these data are presented as the proportional ratio of GTGT and ΔGT copies found within the total number of GTGT+ ΔGT copies (presumed to represent the sum NCF1, NCF1B, and NCF1C copies). When performed on genomic DNA from most normal subjects analyzed and shown in rows 1 and 2 of Table 1, the proportional ratio of GTGT/(GTGT + ΔGT) yields values of ∼0.33, which is equivalent to the expected 2 GTGT copies and 4 ΔGT copies.
Representative ddPCR analyses of NCF1 in gDNA from normal subjects and CGD patients and carriers
| Row | Diagnosis (a priori) | No. of GTGT droplets | No. of ΔGT droplets | GTGT/(GTGT + ΔGT) | ΔGT/(GTGT + ΔGT) | No. of NCF1/NCF1B/NCF1C droplets | No. of TERT droplets | Total NCF1/NCF1B/NCF1C copies | No. of GTGT copies | No. of ΔGT copies | GTGT copies/(GTGT + ΔGT) | Predicted genotype |
|---|---|---|---|---|---|---|---|---|---|---|---|---|
| 1 | Normal | 724 | 1416 | 0.34 | 0.66 | 271 | 92 | 5.9 | 2.0 | 3.9 | 2/6 | — |
| 2 | Normal | 212 | 436 | 0.33 | 0.67 | 212 | 74 | 5.7 | 1.9 | 3.9 | 2/6 | — |
| 3 | Normal | 362 | 358 | 0.50 | 0.50 | 201 | 70 | 5.7 | 2.8 | 2.8 | 3/6 | — |
| 4 | Normal | 535 | 267 | 0.67 | 0.33 | 227 | 78 | 5.9 | 3.9 | 2.0 | 4/6 | — |
| 5 | Normal | 555 | 1357 | 0.29 | 0.71 | 502 | 140 | 7.2 | 2.1 | 5.1 | 2/7 | — |
| 6 | p47phox CGD | 0 | 1080 | 0.00 | 1.0 | 5290 | 1793 | 6.0 | 0.0 | 6.0 | 0/6 | Homozygous ΔGT mutation |
| 7 | p47phox CGD | 0 | 2640 | 0.00 | 1.0 | 1921 | 637 | 6.0 | 0.0 | 6.0 | 0/6 | Homozygous ΔGT mutation |
| 8 | p47phox CGD | 852 | 4340 | 0.16 | 0.84 | 862 | 268 | 6.4 | 1.1 | 5.4 | 1/6 | Compound heterozygous for ΔGT and non-ΔGT mutations |
| 9 | p47phox CGD | 843 | 1731 | 0.33 | 0.67 | 127 | 42 | 6.0 | 2.0 | 4.1 | 2/6 | Non-ΔGT mutation(s) |
| 10 | Obligate p47phox carrier | 429 | 2098 | 0.17 | 0.83 | 226 | 79 | 5.7 | 1.0 | 4.8 | 1/6 | Heterozygous ΔGT mutation |
| 11 | Obligate p47phox carrier | 646 | 1144 | 0.36 | 0.64 | 215 | 70 | 6.1 | 2.2 | 3.9 | 2/6 | Het non-ΔGT mutation |
A second ddPCR assay used a probe for an invariant region in exon 11 of NCF1 common to all 3 NCF1 genes/pseudogenes, and a second probe recognizing TERT to determine the number of copies of NCF1 and its pseudogenes, collectively referred to as NCF1/NCF1B/NCF1C. The copy number of the normal subjects in rows 1 and 2 of Table 1 was 6 copies of NCF1/NCF1B/NCF1C/2 copies of TERT. Unexpectedly, ddPCR analysis of some normal subjects found a significant proportion (16.3%) with more than 2 copies of GTGT: 36 (14.6%) of 246 individuals had 3 GTGT copies (Table 1, row 3, and Table 2 [summary data]) and 4 (1.6%) individuals had 4 GTGT copies (Table 1, row 4, and Table 2). Interestingly, ROS in PMNs from normal subjects with either 3/6 or 4/6 GTGT was normal (Figure 4A). In addition, analysis of p47phox expression by quantitative immunoblotting found no increase in p47phox expression in PMN from 2 normal subjects with 3/6 copies of GTGT (Figure 4B). A significant number of normal subjects exhibited differences in CNV: 6 individuals had 7 copies (2.4%; Table 1, row 5, and Table 2), and 4 individuals had 5 copies (1.6%; Table 2). Overall, only 79.2% of normal control individuals exhibited the “expected” 2 copies of GTGT/6 copies of NCF1/NCF1B/NCF1C.
Distribution of GTGT and NCF1 CNV in normal and CGD populations
| GTGT/(GTGT + ΔGT) | 0/4 | 0/5 | 0/6 | 0/7 | 1/5 | 1/6 | 1/7 | 2/4 | 2/5 | 2/6 | 2/7 | 3/6 | 3/7 | 4/6 | Total |
|---|---|---|---|---|---|---|---|---|---|---|---|---|---|---|---|
| All normals, n (%) | 1 (0.4) | 4 (1.6) | 195 (79.2) | 6 (2.4) | 36 (14.7) | 4 (1.6) | 246 | ||||||||
| p47phox CGD, n (%) | 1 (0.7) | 19 (14.1) | 91 (67.4) | 2 (1.5) | 8 (5.9) | 1 (0.8) | 12 (8.9) | 1 (0.7) | 135 | ||||||
| Obligate p47phox carrier, n (%) | 4 (8.7) | 32 (69.6) | 1 (2.2) | 8 (17.4) | 1 (2.2) | 46 | |||||||||
| p47phox kindred, n (%) | 1 (10.0) | 4 (40.0) | 5 (50.0) | 10 | |||||||||||
| Other CGD patients, carriers, and kindred, n (%) | 4 (1.4) | 214 (77.3) | 1 (0.4) | 53 (19.1) | 1 (0.4) | 4 (1.4) | 277 |
![Figure 4. ROS production and p47phox expression in normal subjects with Increased GTGT copy number. (A) Neutrophils from healthy volunteers with increased GTGT copy number (9 with 3/6 and 1 with 4/6) exhibit normal, PMA-stimulated, neutrophil production (shaded area, 238.1 ± 108.2 [mean ± 2 SD], n = 922), detected using ferricytochrome c reduction. (B-C) Neutrophils from healthy volunteers were analyzed for p47phox expression. (B) Scatter plots represent neutrophil p47phox expression normalized to cellular actin of 2 healthy volunteers with increased copy number of GTGT (3/6, outlined in red in panel C) comparable to that observed in neutrophils from healthy volunteers with 2/6 GTGT (outlined in green).](https://ash.silverchair-cdn.com/ash/content_public/journal/bloodadvances/3/2/10.1182_bloodadvances.2018023184/2/m_advances023184f4.png?Expires=1767706807&Signature=jIkYReMpSxG7y1Vr-lwbqVgp5Tp3gx172LXGpLD097fQIJwpVX3KthJpwZmp2gAvHkQTv3cLFns8Qa4LKN1Rn~K5-1fdEkAPsf3rp3h9tP7rn4DoIErfAt4spPbJOshGZk5TbAxhr3nZ1goOLjVw9DO8P9SKb75o8RL30v1ZhbZ3GP2pYIJapK5zjFM7y0iusY4i~1MSkvzo-ekBvAqSKT06zeSkzxA~T6XjkymC8g10DQgJ6YHZibKuJaV~79L9i6bs94yENUY5~GChlBxT9zH3pI9VLxApUOxr5mWkuemf7Q7bbyHyp-dum011ygAhNCjKE75qUkwlzoIbCVPLiQ__&Key-Pair-Id=APKAIE5G5CRDK6RD3PGA)
ROS production and p47phoxexpression in normal subjects with Increased GTGT copy number. (A) Neutrophils from healthy volunteers with increased GTGT copy number (9 with 3/6 and 1 with 4/6) exhibit normal, PMA-stimulated, neutrophil production (shaded area, 238.1 ± 108.2 [mean ± 2 SD], n = 922), detected using ferricytochrome c reduction. (B-C) Neutrophils from healthy volunteers were analyzed for p47phox expression. (B) Scatter plots represent neutrophil p47phox expression normalized to cellular actin of 2 healthy volunteers with increased copy number of GTGT (3/6, outlined in red in panel C) comparable to that observed in neutrophils from healthy volunteers with 2/6 GTGT (outlined in green).
ROS production and p47phoxexpression in normal subjects with Increased GTGT copy number. (A) Neutrophils from healthy volunteers with increased GTGT copy number (9 with 3/6 and 1 with 4/6) exhibit normal, PMA-stimulated, neutrophil production (shaded area, 238.1 ± 108.2 [mean ± 2 SD], n = 922), detected using ferricytochrome c reduction. (B-C) Neutrophils from healthy volunteers were analyzed for p47phox expression. (B) Scatter plots represent neutrophil p47phox expression normalized to cellular actin of 2 healthy volunteers with increased copy number of GTGT (3/6, outlined in red in panel C) comparable to that observed in neutrophils from healthy volunteers with 2/6 GTGT (outlined in green).
Brunson et al16 reported a significant number of Mexicans with reduced copies of NCF1C. Although not specifically addressed in our study, the CNV within the Hispanic population studied was comparable to that observed in the Caucasian population (Figure 5).
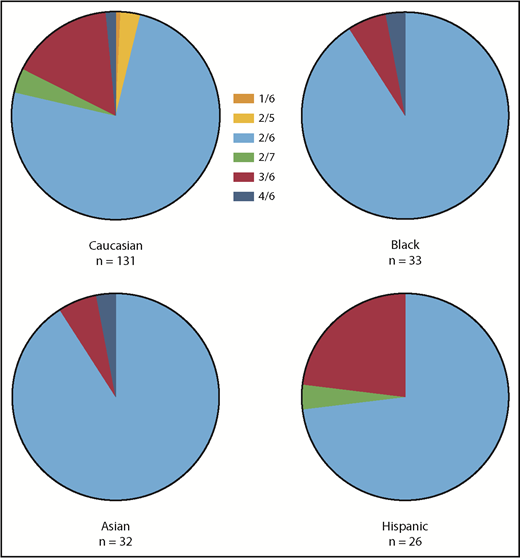
Figure 6 shows scatter plots of the number of GTGT copies and the number of ΔGT copies, respectively, observed in genomic DNA from normal subjects, from obligate p47phox carriers (parents of p47phox CGD patients and offspring of p47phox CGD patients), from patients with p47phox CGD, and from siblings of patients with p47phox CGD, as well as other CGD patients, parents, and kindred within the NIH cohort. In the normal population, the number of GTGT copies segregated into 3 distinct clusters (2.0 ± 0.1 [n = 205], 3.0 ± 0.1 [n = 36], and 3.9 ± 0.1 [n = 4]), whereas the number of ΔGT copies segregated into 4 distinct clusters (1.9 ± 0.1 [n = 4], 3.0 ± 0.1 [n = 40], 4.0 ± 0.1 [n = 195], and 4.8 ± 0.2 [n = 7]). The normal population exhibited GTGT ratios of 2/5, 2/6, 2/7, 3/6, and 4/6. In addition, among the normal cohort studied (n = 246), 1 individual was identified as a carrier of p47phox CGD, near the expected frequency of 1 in 500 based on the Hardy-Weinberg equation. In addition, the genotype frequency of CNV in the normal cohort described in this report paralleled that reported by Olsson et al.17
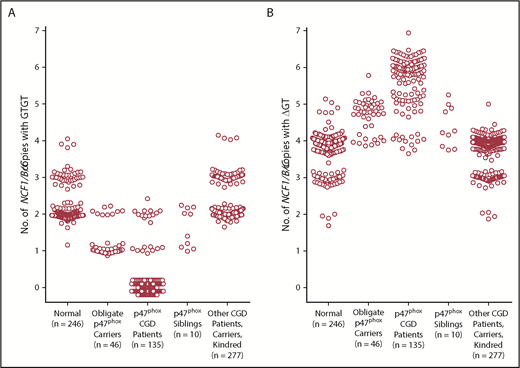
GTGT copies and ΔGT copies in normal subjects, p47phoxCGD patients, carriers, and kindred; gp91phoxCGD patients, carriers, and kindred; and other patients with CGD. Data from all individuals tested by ddPCR and analyzed as described in Table 2 are presented as scatter plots based on the diagnosis. (A) Number of GTGT copies. (B) Number of ΔGT copies.
GTGT copies and ΔGT copies in normal subjects, p47phoxCGD patients, carriers, and kindred; gp91phoxCGD patients, carriers, and kindred; and other patients with CGD. Data from all individuals tested by ddPCR and analyzed as described in Table 2 are presented as scatter plots based on the diagnosis. (A) Number of GTGT copies. (B) Number of ΔGT copies.
Most, but not all, of the p47phox CGD patients studied were diagnosed based on abnormal PMA-induced DHR oxidation and p47phox immunoblotting. Subsequent analysis of genomic DNA by ddPCR found that 83.7% (113 patients from 88 families) of p47phox CGD patients within the NIH cohort were homozygous for the ΔGT mutation (0 copies GTGT; Table 1, rows 6 and 7, and Table 2); an obligate carrier of a p47phox CGD patient exhibited 1 copy of GTGT (Table 1, row 10). Of the remaining patients, 6.7% (9 patients from 8 families) were compound heterozygotes (1 NCF1 carrying ΔGT and the other carrying GTGT with a mutation distinct from ΔGT; Table 1, row 8, and Table 2). Finally, 9.6%, (13 patients from 10 families) of p47phox CGD patients exhibited 2 copies of GTGT; they are presumed to carry 2 non-ΔGT mutations (Table 1, row 9, and Table 2); obligate carriers of these p47phox CGD patients exhibited 2 copies of GTGT with a presumed non-ΔGT mutation on 1 allele (Table 1, row 11, and Table 2). It should be noted that ddPCR analysis alone would have been sufficient to diagnose the patients with p47phox CGD who were homozygous for the ΔGT mutation (0/6); neither a DHR nor a p47phox immunoblot would have been necessary for the diagnosis. However, ddPCR would have been inadequate to identify those patients who were compound heterozygotes and those who were homozygous for non-ΔGT mutations; a DHR and p47phox expression by protein detection would have been necessary for diagnosis of p47phox-deficient CGD. For a patient with an abnormal DHR, ddPCR could provide a genetic diagnosis of mutations at the GTGT/ΔGT site; in combination with a p47phox immunoblot or flow cytometry, it could be used to identify the more than 14% of p47phox CGD patients with non-ΔGT mutations.
The pedigrees of families within the NIH cohort are presented in Figure 7. The obligate carrier parents of p47phox CGD patients homozygous for the ΔGT mutation were found to carry only 1 copy of GTGT (Figure 7, families A-E). Among the siblings of p47phox CGD patients with homozygous ΔGT mutations, ddPCR identified individuals with 2 copies of GTGT (unaffected siblings) and those with 1 copy of GTGT (p47phox carriers with a wild-type allele and a ΔGT allele (eg, Figure 7, families D and E). In families A-E, the CNV was invariant between the parents and children within families. Of the 90 p47phox CGD families with 0 copies of GTGT, patients in 74 families were 0/6 (82.2%), patients in 12 families were 0/5 (13.3%), patients in 2 families were 0/7 (2.2%), and a patient from 1 family (1.1%) was 0/4. In families F-H, the CNV did not vary among the p47phox CGD siblings within families; all were 0/5 (and none were 0/4 or 0/6).
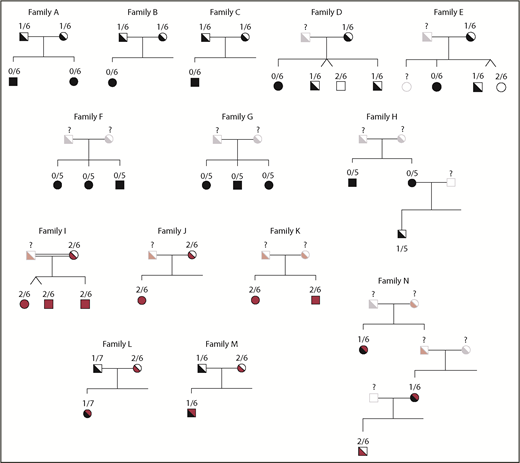
GTGT/ΔGT CNV in families of patients with p47phoxCGD. In the pedigrees presented, the GTGT/ΔGT genotype is above the individual tested. Symbols in black represent patients and carriers with the ΔGT mutation; symbols in red represent patients and carriers with non-ΔGT mutations; symbols in black and red represent compound heterozygotes with a ΔGT mutation and a non-ΔGT mutation; open symbols represent individuals tested that have a normal phenotype and genotype; faded symbols represent individuals that have not been tested but their phenotype is presumed. Consanguineous marriages are indicated by double lines between pedigree symbols.
GTGT/ΔGT CNV in families of patients with p47phoxCGD. In the pedigrees presented, the GTGT/ΔGT genotype is above the individual tested. Symbols in black represent patients and carriers with the ΔGT mutation; symbols in red represent patients and carriers with non-ΔGT mutations; symbols in black and red represent compound heterozygotes with a ΔGT mutation and a non-ΔGT mutation; open symbols represent individuals tested that have a normal phenotype and genotype; faded symbols represent individuals that have not been tested but their phenotype is presumed. Consanguineous marriages are indicated by double lines between pedigree symbols.
Families I, J, and K, the parents and the patients, had a 2/6 genotype (Figure 7). Because these patients were diagnosed with p47phox CGD based on an abnormal DHR and p47phox immunoblot, these families are presumed to have mutations in NCF1 distinct from the ΔGT mutations. In family I, next-generation sequencing of NCF1 cDNA (PacBio) identified a homozygous 15 base deletion within exon 8 of NCF1 (supplemental Figure 1), whereas the GTGT at the start of exon 2 remained intact.
In families L, M, and N, patients identified with p47phox CGD were analyzed by ddPCR and were found to have 1/6 or 1/7, suggesting that they are compound heterozygotes, carrying 1 GTGT allele with a mutation in cis, and the other allele ΔGT. In family M, ddPCR analysis of 1 obligate p47phox parent found 1/6, indicating a carrier of the ΔGT mutation, whereas the other parent was 2/6 and presumably has another mutation in p47phox. In family N, offspring of the p47phox patient in the second generation presumably carries the non-ΔGT mutation.
To validate the specificity of the ddPCR among CGD patients, DNA samples from the NIH CGD cohort including patients with X-linked CGD (n = 107), their X-linked carrier mothers (n = 113), other unaffected family members, and patients, carriers, and kindred with other forms of autosomal recessive CGD were analyzed (Table 2; Figure 6). None of the individuals in this cohort (n = 277) had reduced GTGT copies. Moreover, 54 (19.5%) individuals exhibited 3 copies of GTGT and 4 (1.4%) individuals exhibited 4 copies of GTGT, similar to the findings in our normal population.
Discussion
In general, identification of the specific gene defects leading to loss of p22phox, p67phox, gp91phox, and p40phox can be easily obtained by traditional Sanger sequencing. However, identification of the specific NCF1 genetic defects in patients with p47phox CGD is complicated by the highly homologous (>98%) pseudogenes. The diagnosis is currently often made using a gene-scan protocol in which the regions of NCF1 and its pseudogenes containing the GTGT or ΔGT are amplified by PCR, and the resultant PCR products separated by electrophoresis; the NCF1 PCR product is 2 nucleotide base pairs longer (GTGT) than the PCR products of NCF1B and NCF1C (ΔGT).18 The ratio of the peak heights of these products is used as a basis for diagnosis; normal volunteers are expected to exhibit a ratio of 2 GTGT:4 ΔGT, carriers are expected to exhibit a ratio of 1 GTGT:5 ΔG, and CGD patients are expected to exhibit only 1 ΔGT peak. This method assumes little variation in the GTGT:ΔG ratio and little variation in the numbers of NCF1 and pseudogene copies. However, we and others have found considerable variation in the normal population, suggesting that this technique may not be as reliable as thought.17
The diagnosis of p47phox CGD is generally based on clinical history followed by demonstration of an abnormal DHR and lack of mutation in any other NADPH oxidase component. Immunoblot of p47phox in neutrophil lysate may take several days to complete and requires relatively large volumes of fresh blood. In contrast, our FACS assay for p47phox in permeabilized PMNs is faster, is quantitative, requires less blood, and parallels those obtained by quantitative immunoblotting. This assay expands the diagnostic repertoire for carriage of p47phox CGD, as carriers have only ∼50% to 60% of normal expression of p47phox protein in both assays. Interestingly, carriers with the ΔGT mutation and carriers with non-ΔGT mutations both demonstrate decreased levels of p47phox protein. Because carriers of p47phox CGD are phenotypically normal, this finding has added clinical relevance in genetic therapies, as it lowers the bar of protein needed to attain phenotypic correction.
We have developed a ddPCR assay that can identify those patients with the ΔGT mutation from patients with other mutations in NCF1. An individual with 0 copies of GTGT can be directly diagnosed with p47phox CGD, which is the case in 84% of patients. However, among these 113 patients, the CNV of NCF1 and its pseudogenes range from 4 to 7, with most individuals having either 5 (17%) or 6 (81%) total copies. Individuals with 1 copy of GTGT can either be carriers of p47phox CGD or p47phox CGD patients who are compound heterozygous for other mutations in NCF1. Further testing (DHR, p47phox FACs, and/or immunoblot) is required to differentiate the carriers of p47phox CGD from the patients with p47phox CGD. For 1/6 carriers, 1 copy of NCF1 carries the common ΔGT mutation, whereas the other copy carries GTGT. If a p47phox CGD patient exhibited 2/6, he/she presumably has distinct mutations elsewhere in NCF1.
Both normal subjects and p47phox patients have CNV in NCF1 and its pseudogenes. Moreover, a significant proportion (16.3%) of normal subjects (n = 245 subjects) have more than 2 copies of NCF1 containing the GTGT, 36 normal subjects have 3 copies, and 4 normal subjects have 4 copies. Despite increased numbers of wild-type alleles, neither p47phox protein expression nor ROS production is elevated. Most NCF1 CNV is found within the Caucasian and Hispanic populations.
Recently, De Boer et al15 reported Ashkenazi Jews in whom both parents carried 3/6 (3 GTGT of 6 NCF1/NCF1BNCF1C), including a wild-type NCF1 on 1 chromosome; on the other chromosome, each parent carried an NCF1 with a known CGD-causing mutation (c.579G>A, p.Trp193Ter)19 and a GTGT-containing NCF1 gene at the position of a pseudogene. Genetic studies on the fetus determined that it had inherited the mutated chromosome from both parents. Presumably, the fetus would carry 4 GTGT/6 NCF1/NCF1BNCF1C, inheriting a known dysfunctional mutation in NCF1, but also inheriting a GTGT-containing NCF1 gene with unknown functionality at the position of a pseudogene. Although predicted to have p47phox CGD, the infant exhibited normal ROS production, suggesting that the third GTGT-containing copy was a functional NCF1 gene at the position of a pseudogene and produced functional p47phox. Merling et al.20 used a cell line from a p47phox patient with a non-ΔGT mutation in NCF1 to genetically edit the ΔGT mutation in the pseudogenes, thereby restoring ROS production from the corrected pseudogene. This confirms that repair of the ΔGT is sufficient to transform a p47phox pseudogene into a functional gene.
Our data add complexity of the NCF1 locus. There can be both increased and decreased CNV among the wild-type gene and the pseudogenes. There also appears to be correction of pseudogenes by GTGT incorporation, although whether a result of duplication or recombination events between the wild-type gene and pseudogenes remains to be determined. The use of “signature” sets of nucleotides to define NCF1 and its pseudogenes, such as many of those listed in supplemental Table 1, may prove unreliable, as Roos et al.19 have reported that many of the single nucleotide polymorphisms found in NCF1 are found in NCF1B and NCF1C and are thought to have arisen through recombination events between the wild-type gene and the pseudogenes. In addition, another mechanism for gene rearrangement that should be considered is template-driven DNA repair of double-strand DNA breaks. Breaks in DNA within the NCF1 gene could lead to misalignment of NCF1 with homologous regions of either NCF1B or NCF1C, leading to incorporation of NCF1B (or NCF1C) sequence (including the ΔGT mutation) into NCF1. Because this may occur randomly, a break in NCF1 could be repaired using a pseudogene, incorporating the ΔGT into NCF1. Alternatively, a break in NCF1B or NCF1C could be repaired using NCF1, incorporating the GTGT sequence from NCF1 into the pseudogene, “correcting” the ΔGT mutation in a pseudogene; this mechanism would occur with preservation of the total copy number of NCF1, NCF1B, and NCF1C. Although unequal recombination (unequal crossing over) is still the most likely event for the heterogeneity observed in the CNV of NCF1 and the pseudogenes, this gene repair hypothesis provides a plausible explanation for the differences in GTGT and ΔGT copy number variation found in the normal population.
In summary, flow cytometry and ddPCR expand the diagnostic repertoire for patients and carriers of p47phox CGD. Our flow cytometer-based assay for p47phox expression allows rapid quantitative diagnosis of p47phox expression. Our ddPCR assays allow quantitative estimates of the relative number of GTGT and ΔGT copies. In geographic regions (eg, the Middle East and India) in which the frequency of autosomal recessive CGD, especially p47phox CGD, is increased, these assays could have a significant effect on the identification of the phenotype and genotype of patients and, equally important, suspected carriers of p47phox CGD. Finally, these tools clarify our understanding of the inheritance of p47phox CGD, and simultaneously show that the NCF1 locus is more fluid than previously appreciated.
The full-text version of this article contains a data supplement.
Acknowledgments
This research was supported in part by the Intramural Research Program of the National Institutes of Health, National Institute of Allergy and Infectious Diseases, and in part with federal funds from the National Cancer Institute, National Institutes of Health, under contract HHSN261200800001E.
The content of this publication does not necessarily reflect the views or policies of the Department of Health and Human Services, nor does mention of trade names, commercial products, or organizations imply endorsement by the US Government.
Authorship
Contribution: D.B.K., A.P.H., and X.W. designed the research; S.K., C.S.Z., S.S.D.R., H.L.M., and S.M.H. cared for patients and arranged for sample collections; D.S., K.L., D.F., P.G., D.W.H., D.A.L.P., and L.M. performed experiments; D.B.K. analyzed the results and made the figures; and D.B.K, A.P.H., H.L.M., S.M.H., X.W., and J.I.G. did ongoing data review, wrote, and edited the manuscript.
Conflict-of-interest disclosure: The authors declare no competing financial interests.
Correspondence: John I. Gallin, Chief Clinical Pathophysiology Section, Laboratory of Clinical Immunology and Microbiology, National Institute of Allergy and Infectious Diseases, National Institutes of Health, 1 Center Dr, Room 201, Bethesda, MD 20892; e-mail: jig@nih.gov.

