

Key Points
Early responders with MM (TBR ≤3 months) are more likely to have higher lactate dehydrogenase levels and experience inferior outcomes.
The kinetic pattern of response is a simple and powerful predictor for survival of patients with MM even in the era of novel agents.

Abstract
Rapid remission by induction therapy has long been recognized as an important predictor for long-time survival in acute leukemia. However, the impact of response kinetics on multiple myeloma (MM) seems to be different and remains unexplored. The relationship between response kinetics and outcome were assessed in 626 patients with newly diagnosed MM who were included in a prospective, nonrandomized clinical trial (BDH 2008/02). Patients were assigned to either immunomodulatory drug- or proteasome inhibitor–based therapy. The response depth, time to best response (TBR) and duration of best response (DBR) were collected. Depth of response was associated with superior outcomes, consistent with findings from other studies. However, the early responders (defined as TBR ≤3 months) showed significantly worse survival compared with late responders. We found that patients with rapid complete remission experienced inferior survivals comparable to those attaining a gradual partial remission. Moreover, 4 distinct response kinetics patterns were identified. Patients with gradual and sustained remission (“U-valley” pattern) experienced superior outcomes, whereas poor outcomes were observed in rapid and transient responders (“roller coaster” pattern) (median overall survival, 126 vs 30 months). The effects of response patterns on survival were confirmed in patients at different stages of disease and cytogenetic risk, including transplant-eligible patients and those attaining different extents of response depth. Collectively, our data indicated that slow and gradual response is a favorable prognostic factor in MM. In addition to response depth, the kinetic pattern of response is a simple and powerful predictor for survival even in the era of novel agents.
Introduction
With the introduction of novel agents including proteasome inhibitors (PIs) and immunomodulatory drugs (IMiDs), the overall survival (OS) of patients with multiple myeloma (MM) has been remarkably improved during the past 15 years.1 These improvements have raised interest in the association between quality of response and prolongation of survival, and a growing body of evidence indicates that achieving deep response after initial treatment confers remarkable benefits for MM patients.2 Moreover, depth of response, including achievement of minimal residual disease (MRD), is now an end point in many new drug development trials.3 Importantly, the concept of response-directed risk stratification treatment has been fully established in acute leukemia (AL)4,5 and has been gradually adapted with the advent of novel agents in MM. For example, in MM the goal of therapy has been to achieve a rapid decrease of M-protein within 4 cycles of initial treatment in either transplant-eligible or transplant-ineligible patients for more durable disease control.6,7 However, the effects of response kinetics on outcome for MM remain largely unexplored.
Response kinetics in AL to inform therapy, early blast clearance, and rapid achievement of complete remission (CR) after the first course of induction therapy is a favorable predictor for survival.8 To date, however, there is no uniform association between rapidity of response and survival outcomes in MM. Several studies have demonstrated that a rapid decrease of M-protein in the first 1 or 2 cycles of therapy is predictive of longer survival. But most of these studies were performed before the introduction of novel agents.9,10 Recent studies have compared early responders with late responders from a cohort of patients with relapsed/refractory MM in the TOURMALINE-MM1 trial11 or in patients with first-line transplantation.12 It is possible that a rapid reduction of tumor burden indicates a population that is sensitive to therapy; however, such rapid response may be the result of targeting highly proliferative plasma cells (PCs) and rapidly selecting for resistant clones and poor outcomes. Similar conclusions were dawn by a recent retrospective study from the Mayo Clinic. Patients with high-risk cytogenetics as well as those with International Staging System (ISS) stage III disease were more likely to achieve a rapid response.13 Therefore, in contrast to AL, a rapid response may not necessarily translate into superior survival in MM.
Only few studies have focused on the response kinetics after initial therapy for MM in the era of novel agents and on using the International Myeloma Working Group (IWMG) Uniform Response Criteria. In this study, we evaluated the response depth, time to best response (TBR), and duration of best response (DBR) in newly diagnosed MM patients. In both transplant-eligible and transplant-ineligible patients, we identified different response kinetics patterns after PI- or IMiD-based induction therapy, which are associated with distinct patient outcomes.
Patients and methods
We reviewed the database containing patients with newly diagnosed MM enrolled into a prospective, nonrandomized clinical trial approved by our institution (BDH 2008/02). Details on study design and treatment regimens have been reported previously.14 Briefly, patients were assigned to either PI- or IMiD-based therapy (supplemental Table 1). After 4 cycles of induction therapy, patients underwent autologous stem cell transplantation (ASCT) or subsequent chemotherapy. Unless patients could not tolerate the therapy, they were then treated with bortezomib, thalidomide, or lenalidomide maintenance for 1 year. To ensure a homogeneous population for analysis, we excluded patients with no measurable serum or urine M-protein and those with <24 months follow-up after achieving best response (unless they reached an end point of death or progression). The serum or urine M-protein was measured on the first day of each cycle of induction and once every 3 months after induction. Bone marrow assessment was performed at the end of cycles 2 and 4, after ASCT, or at the time of CR to therapy. Response assessment was carried out per IWMG Criteria. Responses of patients diagnosed before 2006 were reevaluated using the IWMG criteria.15 Informed consent was obtained in accordance with the local ethical committees according to the Declaration of Helsinki.
All the patients were classified into different risk groups using ISS criteria. Enrichment for CD138+ PCs and fluorescence in situ hybridization were performed as previously reported.16 The baseline routine panel included evaluation for 13q14 deletion, 17p deletion, 1q21 gain/amplification, t(11;14), t(4;14), t(14;16), and t(14;20). The threshold levels were defined as 20% for deletion or amplification and 10% for translocation. The presence of del(17p), t(4;14), t(14;16), or t(14;20) was defined as high-risk cytogenetic abnormalities.17 Patients without such abnormalities were classified as standard risk. MRD was investigated by multiparameter flow cytometry using 2 combinations of 8-color monoclonal antibodies: FITC/PE/PerCP-Cy5.5/PE-Cy7/APC/APC-H7/V450/V500: (1) CD81, CD19, CD56, CD27, CD200, CD20, CD38, and CD45; and (2) cLamda, CD138, CD28, CD117, cKappa, CD19, CD38, and CD45. Flow MRD negativity was defined as <50 clonal PCs after measuring ≥500 000 nucleated cells at a sensitivity level of 10−4 to 10−5.
In our study, best response was defined as the maximal response during first-line induction therapy and first-line transplantation. TBR was defined by time required to achieve best response. To address possible bias in survival of late responders with no events who survived for at least 3 months and the bias that deep remission was enriched in late responders, we calculated modified progression-free survival (mPFS) and modified overall survival (mOS) from time of first detectable best response. Moreover, subgroup analyses per response depth were performed. DBR was defined as time from the first documentation of best response to relapse or death. A 24-month landmark analysis was performed, and postrelapse survivals were compared to reduce the time bias for the 2 groups. The remission pattern and response kinetics to first-line therapy were evaluated with the combination of TBR and DBR.
χ2 and Fisher’s exact tests for categorical variables were used to evaluate the statistical significance among different groups, and Kruskal-Wallis test was used for continuous variables. Survival curves were plotted by the Kaplan-Meier method and compared by using the 2-sided log-rank test. A multivariable Cox proportional hazards model was developed to assess the variables with significant impact of OS on the univariable analysis, including age, TBR, DBR, best response, ISS stage, and cytogenetic abnormalities. Considering the important impact of treatment regimens on response, we included treatment regimens in the multivariable model. Statistical analyses were performed using SPSS version 20.0 (IBM, Chicago, IL) and R package version 3.5.1. P < .05 was considered as statistically significant.
Results
A cohort consisting of 626 newly diagnosed patients were enrolled between January 2004 and December 2016. A total of 440 progression events and 273 deaths were reported. The median PFS was 30.5 months (95% confidence interval [CI], 27.4-33.6 months), and the median OS was 68.1 months (95% CI, 57.2-79.0 months). Table 1 summarizes patient demographics and disease characteristics.
Baseline characteristics of 626 patients with newly diagnosed MM
| Characteristic | n/N (%) | Median (range) |
|---|---|---|
| Age at diagnosis, y | 57 (26-83) | |
| Male | 382/626 (61) | |
| ISS stage | ||
| I | 122/626 (19) | |
| II | 236/626 (38) | |
| III | 268/626 (43) | |
| Cytogenetics abnormalities by iFISH | ||
| High risk* | 172/557 (31) | |
| Standard risk† | 385/557 (69) | |
| M-component | ||
| IgG | 307/626 (49) | |
| IgA | 151/626 (24) | |
| Light chain | 119/626 (19) | |
| Other | 49/626 (8) | |
| First-line therapy | ||
| IMiDs‡ | 236/626 (38) | |
| PIs‡ | 401/626 (64) | |
| First-line transplantation§ | 182/626 (29) | |
| Best response to first-line therapy | ||
| CR | 265/626 (42) | |
| VGPR | 161/626 (26) | |
| PR | 133/626 (21) | |
| TBR, mo | 3.1 (0.7-19.0) | |
| DBR, mo | 21.2 (1.5-130.0) |
iFISH, interphase fluorescent in situ hybridization.
High-risk cytogenetic abnormalities (CAs) were defined as the presence of 20% or more del(17p) or 10% or more t(4;14), t(14;16), or t(14;20) in screened plasma cells.
Standard-risk CAs defined by the absence of high-risk CAs.
A total of 11 patients who received IMiDs combined with PIs were counted twice.
First-line transplantation was defined as transplantation within 12 months of first-line therapy.
TBR: rapid CR responders have shorter survival
Best response to first-line therapy was available for 559 patients, including 265 (42%) with CR, 161 (26%) with very good partial remission (VGPR) , and 133 (21%) with partial remission (PR). The remaining 67 patients achieved a response of less than PR. Flow MRD assessments were available for 223 of 265 patients who achieved CR. Patients who achieved flow MRD negativity (142 [60.9%] of 223) experienced significantly superior PFS (median, 86.3 months) vs patients achieving MRD-positive CR, VGPR, PR, or less than PR (median, 31.5, 24.0, 20.4, and 12.2 months, respectively), suggesting an association between response depth and outcomes (Figure 1A,F).
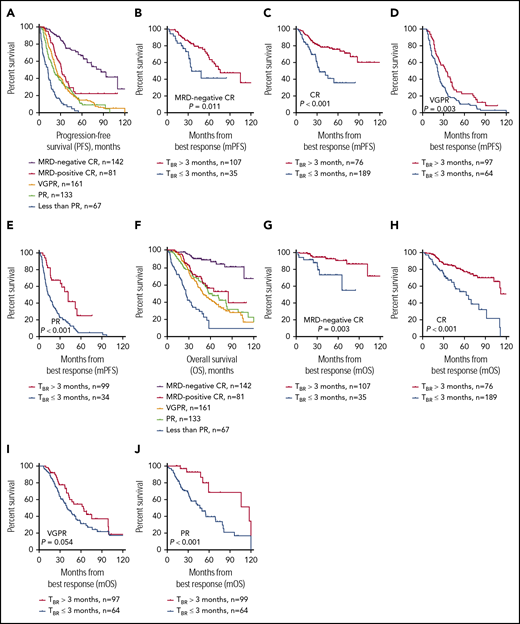
Subgroup analyses per response depth. PFS (A) and OS (F) for patients stratified by response assessment. Kaplan-Meier estimates of modified PFS (B-E) and modified OS (G-J) by TBR for patients with different response status.
Subgroup analyses per response depth. PFS (A) and OS (F) for patients stratified by response assessment. Kaplan-Meier estimates of modified PFS (B-E) and modified OS (G-J) by TBR for patients with different response status.
The median TBR was 3.1 months (range, 0.7-19.0 months). Although most patients achieved best responses early within the first 4 months of therapy (cycles 1-6), a substantial proportion of patients (112 [20%]) exhibited delayed response after 6 months. Those patients who achieved best response within 1 month had the shortest survival with mPFS of 13.9 months and mOS of 33.5 months. Median survival improved with increasing TBR with a positive correlation between TBR and survival from time of first detectable best response (Figure 2). Patients were divided into 4 groups according to TBR. The outcome of patients who required >6 months to reach best response was similar to the outcome of those with TBR between 3 and 6 months (mOS, 118 vs 102 months; P = .170), which was significantly longer than survival of patients with TBR ≤3 months (mOS, 47 months; P < .001) (supplemental Figure 1). Therefore, the cutoff for TBR was determined as 3 months. A total of 272 patients (49%) who required no more than 3 months to achieve best response were classified as early responders, and the remaining patients were designated as late responders.
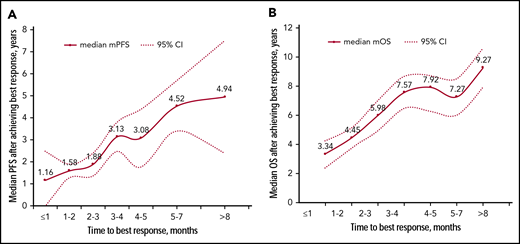
The correlation between TBR and survival. Median mPFS (A) and mOS (B) for patients stratified by TBR. Of the 560 patients achieving response of PR or better, 28 required ≤1 month, 117 required 1 to 2 months, 128 required 2 to 3 months, 73 required 3 to 4 months, 63 required 4 to 5 months, 74 required 5 to 7 months, and 77 required more than 7 months.
The correlation between TBR and survival. Median mPFS (A) and mOS (B) for patients stratified by TBR. Of the 560 patients achieving response of PR or better, 28 required ≤1 month, 117 required 1 to 2 months, 128 required 2 to 3 months, 73 required 3 to 4 months, 63 required 4 to 5 months, 74 required 5 to 7 months, and 77 required more than 7 months.
The median TBR of patients reaching CR was 4.5 months compared with 2.7 months for those reaching VGPR and 2.2 months for those reaching PR. To address the question of whether the negative effects of rapid response merely reflected the difference of response depth, we separated patients according to the response depth. Importantly, the prognostic significance of TBR was identified in each response group, as well as in those with flow MRD negativity (Figure 1). Kaplan-Meier curves were calculated for the whole cohort, and the longest mOS was found in patients who achieved CR after 3 months. However, there was no difference in median mPFS and mOS between patients with a rapid CR and those with a late VGPR or PR (mPFS: 33.4 vs 36.2 months, P = .382; mOS: 62.6 vs 64.2 months, P = .169) (supplemental Figure 2).
Next, the cohort was divided into patients achieving CR before transplantation and those achieving CR only after transplantation. PFS was worse for patients attaining CR before transplantation compared with those achieving a response of less than CR and deepening the response to CR after transplantation (P = .027; supplemental Figure 3). However, the prognostic significance of the time of CR in transplant-eligible patients has not yet translated into a significant stratification in OS. Further follow-up is required to clarify this issue.
Impact of TBR across disease stage, cytogenetics, and treatment regimens
There were no significant differences at baseline in terms of age, renal function, hemoglobin, baseline level of M-protein or extramedullary disease between early responders and late responders (supplemental Table 2). The high-risk cytogenetic abnormalities were more frequently seen in early responders, although the difference was not statistically significant. The only significant variable was serum lactate dehydrogenase (LDH) level, with a mean of 209 U/L for early responders vs 178 U/L for late responders (P = .002). Likewise, the proportion of patients with elevated LDH was higher in early vs late responders (21% vs 11%; P = .001)
We next investigated whether TBR remained an independent predictor of outcome when other prognostic markers were taken into account. The favorable impact on survival for late responders was seen in most subgroups (Figure 3). However, TBR had no significant impact on the outcome of patients with light-chain or immunoglobulin D MM: these patients achieved a more rapid response than other patients (median TBR, 2.7 vs 3.2 months; P = .037) but it was not associated with shorter survival. A multivariable analysis consisting of TBR and the established survival risk factors (including age, response depth, clinical stage, cytogenetics, and treatment regimens; Table 2) revealed that TBR remained significant as an independent factor of outcome (hazard ratio [HR] for mPFS, 1.9 [95% CI, 1.5-2.7] and HR for mOS, 2.8 [95% CI, 2.0-4.1]).
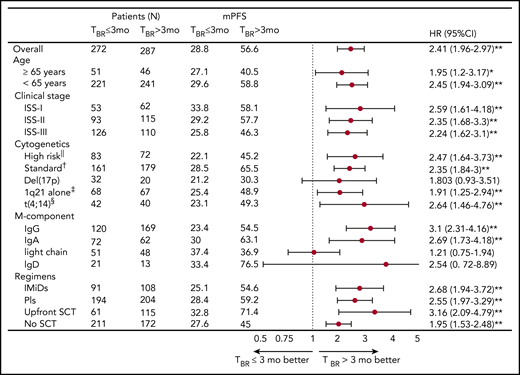
Forest plots of HRs for mPFS according to TBR for patients with a response of PR or better after first-line therapy. ||High-risk subgroups were defined by the presence of del(17p), t(4;14), t(14;16), or t(14;20). †Standard-risk subgroups were defined by the absence of high-risk cytogenetics. ‡1q21 subgroups included patients with 1q21 and absence of high-risk cytogenetics. §t(4;14) subgroups included patients with t(4;14) alone. SCT, stem cell transplantation. *P < .05; **P < .01.
Forest plots of HRs for mPFS according to TBR for patients with a response of PR or better after first-line therapy. ||High-risk subgroups were defined by the presence of del(17p), t(4;14), t(14;16), or t(14;20). †Standard-risk subgroups were defined by the absence of high-risk cytogenetics. ‡1q21 subgroups included patients with 1q21 and absence of high-risk cytogenetics. §t(4;14) subgroups included patients with t(4;14) alone. SCT, stem cell transplantation. *P < .05; **P < .01.
Multivariate analysis (Cox model) of mPFS and mOS for patients with a response of PR or better after first-line therapy (n = 559)
| Variables | mPFS | mOS | ||||
|---|---|---|---|---|---|---|
| HR | 95% CI | P | HR | 95% CI | P | |
| TBR ≤3 vs >3 mo | 1.92 | 1.49-2.47 | <.001 | 2.84 | 1.99-4.05 | <.001 |
| Age ≥65 vs <65 y | 0.97 | 0.72-1.32 | .853 | 2.66 | 2.24-2.42 | .008 |
| Response | ||||||
| CR vs VGPR | 0.88 | 0.66-1.16 | .365 | 1.24 | 0.86-1.79 | .251 |
| CR vs PR | 0.43 | 0.31-0.59 | <.001 | 0.75 | 0.49-1.15 | .181 |
| ISS clinical stage | ||||||
| I vs II | 0.81 | 0.63-1.05 | .108 | 0.75 | 0.55-1.03 | .074 |
| I vs III | 0.71 | 0.52-0.98 | .036 | 0.37 | 0.23-0.59 | <.001 |
| High-risk vs standard-risk cytogenetics | 1.28 | 1.00-1.62 | .048 | 1.57 | 1.15-2.14 | .005 |
| Treatment regimens | ||||||
| IMiD containing, yes vs no | 1.27 | 0.88-1.84 | .207 | 1.27 | 0.84-1.92 | .257 |
| PI containing, yes vs no | 1.34 | 0.96-1.88 | .087 | 0.92 | 0.58-1.45 | .708 |
| Transplantation, yes vs no | 0.81 | 0.60-1.08 | .154 | 1.04 | 0.70-1.55 | .843 |
Prognostic value of DBR
At the time of last follow-up, loss of best response was experienced by 449 patients (72%). The median DBR was 26 months (95% CI, 22-29 months). We categorized patients into 2 groups as follows: early relapse (DBR ≤24 months; 57%) and late relapse (DBR >24 months; 43%). The median OS for those patients was 33 and 112 months, respectively (P < .001; supplemental Figure 4A). Among the 440 patients who relapsed during follow-up, postrelapse survival was shorter in the early relapse group (15 months) compared with the late relapse group (33 months) (P = .004; supplemental Figure 4C).
The baseline characteristics of patients with DBR ≤24 months were compared with those of patients with DBR >24 months (supplemental Table 3). The median TBR was also similar between the 2 groups (2.8 vs 3.8 months; P = .241). However, more patients with elevated LDH, ISS stage III, and a response of PR or less were identified in the early relapse group. There were also more patients with high-risk cytogenetic abnormalities in the group with DBR ≤24 months, but this difference was not statistically significant (34% vs 26%; P = .059). Given the strong prognostic value of response end points and the relationship between DBR and response depth, a 24-month landmark analysis was carried out for patients with different depths of response. The impact of DBR on outcome was different among patients achieving different response depth (P < .001 for CR and VGPR; P = .065 for PR). In multivariable analysis, the TBR (HR, 2.6; 95% CI, 2.0-3.9; P < .001) and DBR (HR, 4.5; 95% CI, 3.2-6.3; P < .001) retained predictive value for OS. Age ≥65 years, high-risk cytogenetics, and ISS stage III also demonstrated independent significance for shorter survival (supplemental Table 4).
Pattern of response: combined TBR and DBR
According to the cutoff levels for TBR and DBR discussed before, patients were categorized into 4 patterns according to response kinetics: late response and late relapse (n = 157; 25%), early response and late relapse (n = 101; 16%), late response and early relapse (n = 130; 21%), and early response and early relapse (n = 172; 25%). The serum or urine M-protein level was monitored at each cycle of initial therapy and at least once every 3 months during the first 3-year follow-up in 135 patients with different response patterns. Serial M-proteins for these patients are shown in supplemental Figure 5. The curve for patients with late response and late relapse showed a “U-valley” pattern, reaching a plateau slowly with M-protein increasing modestly with relapse (supplemental Figure 5A). Distinct remission kinetics emerged in patients with early response and early relapse in a “roller coaster” pattern (supplemental Figure 5D). In this group, most patients had a steep reduction in M-protein level within 2 cycles of initial therapy, but those were more likely to get an early and rapid recurrence. In addition, more high-risk cytogenetics were identified in patients with the roller coaster response pattern than in other patients (37% vs 28%; P < .001).
Response kinetics–based stratification resulted in remarkable differences in outcome (Figure 4A). The patients with the U-valley pattern (defined as pattern A) showed significantly prolonged survival with a median PFS of 74 months and median OS of 126 months, followed by patients with early response and late relapse (pattern B) and late response and early relapse (pattern C), with median OS of 81 and 44 months, respectively (Figure 4A). The patients with roller coaster pattern (pattern D) experienced a significantly inferior outcome, which was similar to that for the refractory patients who never reached a response of at least PR in initial therapy (median OS, 31 vs 26 months; P = .167). The postrelapse survival was also distinctive among different patterns (P < .001; Figure 4B).
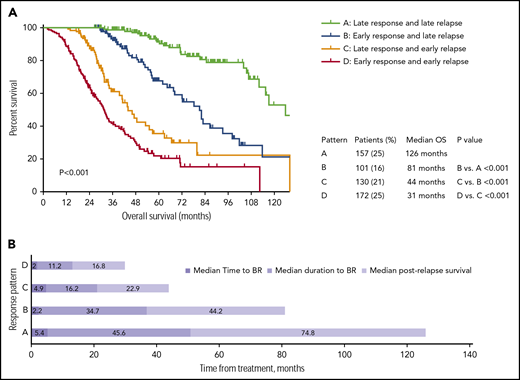
Survival curve of patients with different response pattern. (A) OS of patients with different response patterns. (B) Median TBR, median DBR, and the estimated median survival after relapse among patients grouped by response pattern.
Survival curve of patients with different response pattern. (A) OS of patients with different response patterns. (B) Median TBR, median DBR, and the estimated median survival after relapse among patients grouped by response pattern.
Pattern A was most frequently detected in patients attaining CR (41% vs 26% for VGPR and 14% for PR). Conversely, more patients with the pattern D were seen in the subgroup of PR (43% vs 31% for VGPR and 14% for CR) (Figure 5A). The different outcomes of patients with different response kinetics patterns was also observed among patients in each response category. The kinetics pattern model of remission successfully re-stratified patients with CR, VGPR, and PR (Figure 5B-D). The novel response pattern improved the prognostic impact on OS compared with the traditional stratification by response depth (HR, 2.2 [95% CI, 2.0-2.5] vs HR, 1.6 [95% CI, 1.4-1.8]; P < .001). The response pattern confirmed its prognostic role in patients younger or older than age 65 years, with or without high-risk cytogenetics, receiving PI- or IMiD-containing regimens, as well as in patients who did or did not receive transplantation (supplemental Figure 6).
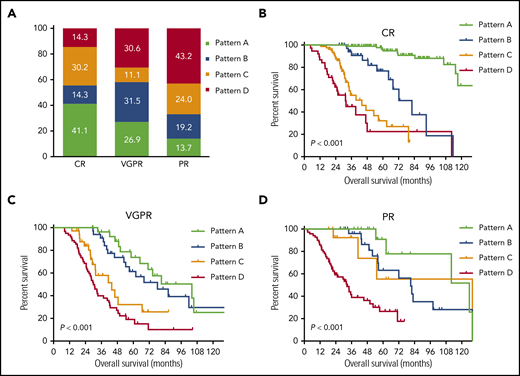
Response pattern and depth of response. The distribution of response pattern (A) and impact of survival (B-D) for patients with different response end points.
Response pattern and depth of response. The distribution of response pattern (A) and impact of survival (B-D) for patients with different response end points.
Discussion
In the era of novel drugs, the proportion of patients attaining CR has been increased to 30% to 50% and even higher for transplant-eligible patients.18,19 However, a deep response has not always translated into an increased OS in these patients. Nearly one-fifth of the patients attaining CR from initial therapy relapsed within 12 months, with short survival of <3 years.6,20 The rapid evolution of resistant clones that are refractory to subsequent regimens results in very poor survival, which is even shorter in patients who never reach a quality response. Conversely, another group of patients who achieve minimal responses which are durable often have prolonged survival. Additional therapy to deeper responses is unlikely to confer additional survival benefit and has attendant toxic effects. Therefore, response depth alone is not a qualified surrogate end point of survival, and increased understanding of mechanisms underlying the response depth is needed.
The natural history and manifestations of MM are quite different from those for AL. MM is a highly heterogeneous disease: some patients experience an aggressive disease like AL, whereas most patients have a more indolent clinical course. In treating this incurable malignant disease, it is essential to try to control the disease rather than eliminate it. The response kinetics to initial therapy may more accurately predict outcome. Rapid reduction of tumor burden and deep response within the first 4 cycles of initial therapy are recommended by some clinicians.21,22 However, in the era of novel agents, there is controversy regarding the notion that the rapidity of response speed is a predictive marker for survival. van Rhee et al23 reported that steeper reductions of serum free light chain before cycle 2 and before transplantation were independent adverse factors for survival. More recently, 2 studies11,24 demonstrated improved survival for patients achieving the best response later than 4 months compared with early responders, consistent with our findings. However, data are limited for newly diagnosed patients. Another recent retrospective study from the Mayo Clinic by Tandon et al13 evaluated 840 newly diagnosed MM patients and observed that there was no significant difference in PFS for patients who achieved VGPR or better vs less than VGPR after completing 4 cycles (31 vs 29 months) of treatment. Unlike that study, our study found that patients who achieved early VGPR as best response within 3 months had inferior outcomes, but those who achieved a rapid PR or VGPR but gradually achieved CR had quite favorable outcomes. Time to PR or VGPR did not affect long-term survival; however, time to best response with first-line treatment had a significant impact on survival.
In our cohort, a positive correlation between TBR and survival was observed, which was diametrically opposite to that observed in AL. The early responders, defined as TBR ≤3 months, showed significantly worse survival. The patients with rapid CR experienced inferior survivals comparable to those attaining a gradual VGPR or PR as best response. Thus, rapid CR responders did not necessarily have improved survival. Notably, this poor outcome occurred regardless of response depth, ISS stage, cytogenetic abnormalities, and induction regimens. Of note, TBR was independently associated with mPFS and mOS in the multivariable analysis.
Many studies have investigated the value of response depth attained before transplantation. Several reports suggested that transplantation for patients who had achieved CR would result in better outcomes.25 However, in these patients, the impact of timing of CR on survival is still unknown. In our study, the adverse effects of early response were also significant in transplant-eligible patients. Patients who achieved VGPR after induction therapy which improved to CR after transplantation experienced longer PFS compared with those who achieved an earlier CR before transplantation. Vij et al26 indicated that additional pretransplant salvage chemotherapy to improve pretransplant response status was not associated with survival benefit. Moreover, posttransplant responses have greater prognostic significance than pretransplant responses.12,27 From a limited number of retrospective studies, it has been reported that deep response may not be necessary before transplantation. Here we report that gradually improving response from VGPR to CR after transplantation was a favorable predictor and that the risk-to-benefit ratio must be compared when high-intensity regimens are adopted for deeper response before transplantation, especially for frail patients.
The baseline characteristics were compared between early and late responders. No significant differences of baseline serum M-protein level, proportion of bone marrow PCs, ISS stage, and cytogenetic risk were observed. Interestingly, the baseline LDH level of early responders was much higher than that of late responders. The elevated LDH indicative for a proliferative clone are related to an older prognostic marker called the plasma cell labeling index.28 Boccadoro et al29 separated the early responders (those who responded within 3 months) into 2 subgroups on the basis of a low (<2%) or high (≥2%) plasma cell labeling index, with the latter group having a worse prognosis. Therefore, we hypothesized that the rapid response was associated with high proliferative activity of PCs, leading to increased sensitivity to chemotherapy. Consequently, rapid responders experienced more progressive disease. More studies are required to confirm this hypothesis.
In addition to rapidity of response, duration of response is also an essential part of response kinetics. The correlation of response duration and survival has been previously confirmed in the transplant setting: previous studies have demonstrated that early relapse after ASCT reliably predicts a poor outcome, even in the era of novel agents.20,30,31 To date, there is limited evidence that the long duration of CR in transplant-ineligible patients has implications for survival.32 Sustained CR is potentially a better surrogate for survival than attaining CR status, and the survival of patients losing CR early may portend worse outcome than never achieving CR.33 However, there is a scarcity of data on DBR for patients achieving a response less than CR. Of note, in our study, the benefit of longer DBR persisted in both transplant-eligible and transplant-ineligible patients who had different extents of response. More remarkably, 36% of patients attaining PR as the best response maintained sustained plateau (DBR >24 months), and 12 patients (18%) who achieved only minor remission also retained stable disease for long durations. These patients had a superior survival regardless of their response depth, with a median OS of 68 months.
Four response kinetics patterns were identified on the basis of the combination of TBR and DBR. The patients with the U-valley pattern (pattern A, late response and late relapse) accounted for a quarter of the cohort and experienced superior outcomes with a median OS of 126 months, even though they had advanced clinical stage and high-risk cytogenetics. Interestingly, in subgroup analyses, we did not observe any difference in survival for patients with the U-valley pattern stratified by ISS stage or cytogenetic risk, suggesting that even patients with ISS stage III or with high-risk cytogenetics may have favorable outcomes in the context of gradual and sustained response kinetics.
Our study also identified a group of patients with particularly poor outcomes with the roller coaster response pattern (pattern D), with a median OS of 30 months. In this group, rapid reduction in tumor burden may be reflective of the high proliferative activity of PCs. Moreover, they were more prone to clonal evolution and subsequent treatment resistance. The shortest postrelapse survival was identified in this group compared with the patients with other response patterns. Previously, a chemotherapy-sensitive disease characterized by rapid relapse and alkylating agent resistance has been described in t(4;14) MM.34 In our study, the proportion of t(4;14) detected in patients with the roller coaster response pattern was higher than that for patients with other patterns (25% vs 17%; P = .051). In addition, more occurrences of 17p deletion were observed in patients with the roller coaster response pattern than in patients with other patterns (14% vs 9%; P = .041). This impact of response pattern on survival was confirmed in patients attaining different depths of response, as well as in transplant-eligible or transplant-ineligible patients.
The retrospective design of this study is a limitation of our conclusions, which need confirmation in prospective trials. However, this is one of the largest series reported on response kinetics patterns in the era of novel agents, and the findings were supported by above-mentioned previous studies. In this study, we investigated the association between response kinetics and outcomes in patients with newly diagnosed MM: the negative impact of rapid and transitory response (TBR ≤3 months and DBR ≤24 months) on survival were maintained in multivariable analysis even after adjustment of response depth, clinical stage, cytogenetics, or first-line transplantation. Our data indicate that a slow and gradual response to PI- and IMiD-based therapy is a good prognostic factor for survival, arguing against premature change to more intensive regimens, especially for elderly or unfit patients. However, we cannot expand our results to other treatment arms that use drugs such as daratumumab because testing this hypothesis would require additional studies. Better understanding of the mechanisms underlying the quality and kinetics of response is urgently needed. Besides response depth, the response kinetics pattern is expected to be a powerful predictor for survival.
The full-text version of this article contains a data supplement.
Acknowledgments
The present study was supported by The Fundamental Research Funds for Excellent Talents of Chinese Academy of Medical Sciences (2018), National Natural Science Foundation of China (81920108006, 81670202, 81630007, and 81570181), Basic Research Service Fee of the Non-profit Central Research Institute Fund of Chinese Academy of Medical Sciences and CAMS Innovation Fund for Medical Sciences (CIFMS 2017-I2M-1-015; 2017-I2M-1-005; 2016-I2M-3-013).
Authorship
Contribution: Y.Y. and G.A. performed FISH, analyzed data, interpreted results, and drafted the manuscript; X.M., H.F., J.L., and C.D. collected data and performed patient follow-up; Z.L., S.Y., Y.X., R.L., W.L., S.D., W.S., Q.W., D.Z., and J.W. acquired data and managed patients; T.C., F.Z., Y.-T.T., C.Y., and X.D. suggested revisions; and L.Q., G.A., and K.C.A. designed the research, revised the manuscript critically, and approved the final version.
Conflict-of-interest disclosure: The authors declare no competing financial interests.
Correspondence: Gang An, Institute of Hematology and Blood Diseases Hospital, Chinese Academy of Medical Sciences, 288 Nanjing Rd, Heping District, Tianjin 300020, China; e-mail: angang@ihcams.ac.cn; Lugui Qiu, Institute of Hematology and Blood Diseases Hospital, Chinese Academy of Medical Sciences, 288 Nanjing Rd, Heping District, Tianjin 300020, China; e-mail: qiulg@ihcams.ac.cn; and Kenneth C. Anderson, Dana-Farber Cancer Institute, Harvard University, 450 Brookline Ave, Boston, MA 02215, e-mail: kenneth_anderson@dfci.harvard.edu.

