

Key Points
Cardiac morphology improves significantly as early as 3 months after HSCT for SCD; these changes are maintained up to 1 year.
Diastolic dysfunction is associated with mortality, and this study shows improvements in diastolic measures and other functional parameters.

Abstract
Cardiac complications have been well-described in sickle cell disease; however, it has been rare to see improvements in cardiac abnormalities following any interventions. Previous work has shown no significant structural changes after treatment with hydroxyurea. The cardiac effects of red blood cell exchange transfusion (RBCx) and hematopoietic stem cell transplantation (HSCT) have not been well described. We studied 56 patients undergoing HSCT (41 HLA-matched, 15 haploidentical), of whom 32 had RBCx within 3 months before HSCT. Echocardiograms and laboratory parameters were obtained at baseline, and at 3, 6, and 12 months following HSCT. Although hemolytic parameters and anemia improved following RBCx, there was a small increase in left ventricular volume index. Following successful HSCT, however, there were significant improvements in cardiac size, function, and diastolic filling parameters at 3 months followed by continued smaller improvements up to 1 year. There was a significant improvement in N-terminal pro B-type natriuretic peptide levels and a trend toward improvement in 6-minute walk time 1 year after HSCT. The magnitude of cardiac improvement seen following HSCT was comparable to that observed following correction of a volume overload state as seen in pregnancy or after repair of chronic valvular regurgitation. Further studies in sickle cell disease patients will help delineate which cardiac complications and what level of severity should be considered indications for HSCT.
Introduction
Sickle cell disease (SCD) results from a single-nucleotide mutation of the β-globin gene, which leads to abnormal hemoglobin molecules. The mutant hemoglobin (hemoglobin S [HbS]) polymerizes within red blood cells (RBCs) under low oxygen tension. Patients develop occlusion of blood vessels within the microcirculation leading to tissue ischemia and reperfusion injury that manifests as pain crises, hemolytic anemia, and end-organ damage. The anemia results in a compensatory increase in cardiac output to maintain adequate systemic oxygen delivery, resulting in increased left ventricular (LV) volumes and mass.1 Diastolic dysfunction is common and is associated with adverse outcomes.2 Both precapillary and postcapillary pulmonary hypertension is also seen and identifies patients at highest risk of death.3,-5 Cardiovascular complications play a large role in the morbidity associated with SCD and, in autopsy studies, cardiopulmonary complications account for ∼45% of deaths.6
The clinical manifestations of cardiovascular disease are heterogenous among SCD patients and may be dependent on various factors including age, genetics, HbF level, degree of anemia, and effect of treatments. These factors, along with plasma viscosity, RBC membrane properties, and surface area/volume ratio, also affect the rheology of blood and consequently the frequency of vaso-occlusive crises.7,8 Although SCD patients have lower blood viscosity at baseline than normal controls,9 it increases with aging10 and is thought to be deleterious for the cardiovascular system.11,12
Currently, hydroxyurea (HU) is the only widely available treatment for SCD and, among other mechanisms, works by inducing fetal hemoglobin production, which mitigates polymerization of HbS and RBC sickling. Elevated levels of fetal hemoglobin are associated with improvements in sickle RBC rheology, and therefore, the clinical manifestation of disease.13 Regular RBC exchange transfusion (RBCx) is another potential therapy for both acute and chronic complications of SCD. Although observational data suggest some benefit following exchange transfusion,14 there are few data on its immediate cardiac effects.
There has been substantial progress in recent years in using hematopoietic stem cell transplantation (HSCT) as a curative option for SCD.15,,-18 Nonmyeloablative HLA-matched sibling transplants have demonstrated engraftment rates >85%15,18 ; however, <20% of patients have a suitable family donor that is fully matched. Haploidentical donors are more accessible,19 and, even though lower engraftment rates have been seen,19,-21 these regimens are currently being optimized.22 Successful HSCT has been associated with improvements in tricuspid regurgitation velocity15 and resolution of pulmonary hypertension23 for patients with SCD. The correction of anemia and possible improvement in microvascular flow abnormalities would be expected to lead to structural cardiac improvements; however, these changes have not been evaluated in detail.
Because some patients undergo RBCx before transplant to decrease the percentage of HbS, cardiac changes may occur following this procedure as well. In addition, preparative regimens for HSCT that include cyclophosphamide and irradiation may negatively affect cardiac function. Prior work in 11 SCD children undergoing HSCT suggested that, despite correction of anemia, cardiac parameters initially worsened at 3 months, and then were comparable to baseline at 1 year following peripheral HSCT.24 Accordingly, the aim of this study was to assess the degree of cardiac structural abnormalities before and after exchange transfusion before HSCT and at baseline and up to 1 year following HSCT in a larger group of SCD adults.
Methods
Patient population
Patients with SCD who underwent nonmyeloablative HLA-matched sibling (www.clinicaltrials.gov #NCT00061568 or #NCT02105766) or haploidentical (#NCT00977691) HSCT between September 2004 and March 2015 and survived until at least 1 year posttransplant were included. Patients requiring a second transplant within the first year and patients with chronic kidney disease on hemodialysis were excluded. Patients undergoing HLA-matched sibling HSCT were conditioned with 300 cGy total body irradiation (TBI) and alemtuzumab, whereas haploidentical patients received 400 cGy TBI, alemtuzumab, and posttransplant cyclophosphamide doses ranging from 0 to 100 mg/kg.20 Patients undergoing HSCT had transthoracic echocardiograms (echos) performed at baseline and 3, 6, and 12 months following HSCT. Laboratory parameters including hemoglobin, total bilirubin, and serum creatinine were measured at similar timepoints.
Exchange transfusions
A subset of SCD patients underwent RBCx transfusion within 90 days before transplant. Exchange transfusion was given as necessary to bring patients’ HbS to <0% before HSCT to decrease the risk for SCD-related complications peritransplant. Conventional RBCx procedures were performed using COBE Spectra or Spectra Optia, as previously described.25,26 The volume of RBCs transfused was based on a calculation to obtain the fraction of cells remaining that would result in a postprocedure HbS of <30%.
Echocardiographic imaging
Echos were performed with the use of commercially available systems. Cardiac measurements were performed according to American Society of Echocardiography guidelines.27 Stroke volume was calculated as the product of LV outflow tract cross-sectional area and velocity time integral, and cardiac output was calculated as the product of stroke volume and heart rate. The LV ejection fraction was assessed using the biplane Simpson’s formula.27 Although ejection fraction is well-accepted as a predictor of cardiac outcomes in the general population, it is not as sensitive as newer measures of myocardial deformation for the detection of subclinical LV dysfunction.28,29 Therefore, further evaluation of global myocardial function was performed with speckle tracking echocardiography to measure myocardial strain, an indicator of the positive or negative deformation of the myocardium. By convention, negative strain indicates shortening of the myocardium and absolute measurements of strain are used to compare serial evaluation (ie, a strain of −21 is better contractility than a strain of −19). Global longitudinal strain (GLS) is a summation of strain from multiple views and is emerging as a useful measure of myocardial toxicity in patients undergoing cancer therapies. In a study of healthy young adults of different races,30 the upper normal limit of strain was −20.4 and strain was noted to be lower in blacks than whites and lower in men compared with women. Although the absolute GLS measurement can vary slightly based on study or vendor, a reduction in GLS of 10% to 15% during treatment has emerged as a useful parameter to predict early cardiotoxicity.29 GLS was measured offline using a specialized strain software (EchoInsight; ε Imaging, Inc., Ann Arbor, MI) and was averaged from standard apical views of the left ventricle.
Statistical analyses
A Wilcoxon signed-rank test was used to compare cardiac and laboratory measurements in patients before and after exchange transfusion (Table 1). A P value threshold of .005 was used for declaring significance to reduce the chance of false-positive findings. This was chosen in preference to a Bonferroni correction of 0.05/21 that was considered too conservative because it neglects recognition of considerable correlation among some of the echo and laboratory outcomes.
Cardiac and laboratory parameters before and following exchange transfusion in 32 SCD patients
| Parameter | Pretransfusion | Posttransfusion | Wilcoxon P |
|---|---|---|---|
| BSA, m2 | 1.8 ± 0.3 | 1.8 ± 0.3 | .09 |
| SBP, mm Hg | 120 ± 14 | 119 ± 13 | .67 |
| DBP, mm Hg | 65 ± 13 | 61 ± 9 | .25 |
| Heart rate, beats/min | 78 ± 12 | 74 ± 11 | .03 |
| TR, cm/s | 2.5 ± 0.4 | 2.6 ± 0.3 | .99 |
| RVSP, mm Hg | 31.0 ± 8.2 | 31.7 ± 6.7 | .90 |
| LVEDD, mm | 49.4 ± 5.2 | 50.2 ± 5.8 | .23 |
| LVESD, mm | 32.7 ± 4.8 | 32.3 ± 4.4 | .42 |
| LVEDV/BSA, mL/m2 | 69.4 ± 17.7 | 76.4 ± 18.9 | .002 |
| LV mass index, g/m2 | 91.2 ± 20.1 | 94.0 ± 21.9 | .40 |
| LA volume index, mL/m2 | 42.5 ± 15.5 | 42.4 ± 11.7 | .52 |
| EF, % | 62 ± 6.4 | 64 ± 4.9 | .14 |
| CO, L/min | 6.6 ± 2.0 | 6.2 ± 2.0 | .36 |
| E/A ratio | 1.8 ± 0.8 | 1.8 ± 0.6 | .97 |
| Sep E/e′, cm/s | 10.8 ± 2.3 | 10.9 ± 2.4 | .34 |
| Lat E/e′, cm/s | 17.3 ± 3.7 | 16.0 ± 3.9 | .04 |
| Hemoglobin, g/dL | 9.2 ± 1.5 | 9.9 ± 0.7 | .02 |
| Total bilirubin, mg/dL | 2.5 ± 2.1 | 1.4 ± 0.9 | <.0001 |
| Serum creatinine, mg/dL | 0.8 ± 0.5 | 0.7 ± 0.4 | .04 |
| Reticulocyte count, % | 9.3 ± 5.4 | 3.6 ± 2.5 | <.0001 |
| LDH, U/L | 353 ± 108 | 322 ± 112 | .09 |
CO, cardiac output; DBP, diastolic blood pressure; EF, ejection fraction; LDH, lactic acid dehydrogenase; LVEDD, left ventricular end-diastolic diameter; LVEDV, left ventricular end-diastolic volume; LVESD, left ventricular end-systolic diameter; RVSP, right ventricular systolic pressure; SBP, systolic blood pressure.
Friedman’s rank procedure, a generalization of the Wilcoxon signed-rank test for repeated measures over multiple times,31 was used to evaluate changes after baseline for the variables shown in Table 2. For a given variable, comparisons between specific periods (eg, baseline and 3 months follow-up periods) were made using the Wilcoxon-Nemenyi-McDonald-Thompson multiple comparisons procedure.31 This procedure corrects for the fact that we make 5 comparisons for each variable (ie, baseline to 3 months, baseline to 6 months, baseline to 12 months, 3 months to 6 months, and 6 months to 12 months). The P values for these 5 comparisons are reported relative to various thresholds in Table 2 and are treated as significant when <.005; P values between .05 and .005 are considered suggestive of difference.
Cardiac and laboratory parameters before and following HSCT in 44 patients with successful transplants
| Parameter | Baseline | 3 mo | 6 mo | 1 y |
|---|---|---|---|---|
| BSA, m2 | 1.87 ± 0.21 | 1.87 ± 0.23 | 1.89 ± 0.22^ | 1.92 ± 0.23*** |
| SBP, mm Hg | 120 ± 14 | 123 ± 12 | 122 ± 15 | 121 ± 16 |
| DBP, mm Hg | 64 ± 12 | 71 ± 10*** | 72 ± 10*** | 71 ± 12* |
| Heart rate, beats/min | 75 ± 14 | 74 ± 13 | 78 ± 15 | 76 ± 15 |
| TR, cm/s | 2.6 ± 0.34 | 2.5 ± 0.20 | 2.5 ± 0.27 | 2.4 ± 0.29* |
| RVSP, mm Hg | 33 ± 7.2 | 30 ± 4.4 | 31 ± 5.8 | 29 ± 5.5 |
| LVEDD, mm | 51 ± 4.9 | 49 ± 4.6* | 48 ± 4.8*** | 48 ± 4.9*** |
| LVESD, mm | 33 ± 4.2 | 34 ± 5.3 | 33 ± 6.5 | 33 ± 4.0 |
| LVEDV/BSA, mL/m2 | 83 ± 22 | 69 ± 21*** | 68 ± 20*** | 65 ± 18*** |
| LV mass index, g/m2 | 101 ± 27 | 90 ± 25 | 86 ± 25*** | 89 ± 22** |
| LA volume index, mL/m2 | 46 ± 14 | 36 ± 18* | 38 ± 15*** | 36 ± 12*** |
| EF, % | 65 ± 4.9 | 57 ± 5.1*** | 58 ± 6.1*** | 60 ± 5.2*** |
| CO, L/min | 6.1 ± 1.9 | 5.1 ± 1.2 | 5.7 ± 1.6 | 5.6 ± 1.9 |
| E/A ratio | 1.7 ± 0.6 | 1.5 ± 0.5 | 1.4 ± 0.5* | 1.5 ± 0.5 |
| Sep E/e′, cm/s | 10.8 ± 2.6 | 9.3 ± 2.3*** | 8.7 ± 2.0*** | 9.1 ± 2.0*** |
| Lat E/e′, cm/s | 16 ± 3.9 | 15 ± 4.6 | 14 ± 4.2 | 14 ± 3.2* |
| Hemoglobin, g/dL | 9.5 ± 0.9 | 11.3 ± 2.0*** | 11.7 ± 2.1*** | 12.3 ± 1.9*** |
| Total bilirubin, mg/dL | 2.1 ± 3.1 | 0.4 ± 0.3*** | 0.6 ± 0.3*** | 0.5 ± 0.3*** |
| Serum creatinine, mg/dL | 1.0 ± 1.5 | 1.4 ± 2.3*** | 1.5 ± 3.1*** | 1.4 ± 2.8*** |
| Reticulocyte count, % | 3.5 ± 2.8 | 2.1 ± 1.5*** | 2.2 ± 1.3 | 2.0 ± 1.2 |
| LDH, U/L | 338 ± 122 | 248 ± 80*** | 253 ± 127*** | 208 ± 61***,^^ |
| 6-min walk, m | 509 ± 81 | 501 ± 98 | 525 ± 113 | 544 ± 83** |
P ≤ .05, **P ≤ .01, ***P ≤ .005 for follow-up studies compared with baseline echo.
P ≤ .05 and ^^P ≤ .01 for 3- vs 6-month studies and 6 vs 12 months.
Multivariable regression was used to examine how changes in a functional measurement (eg, LV end-diastolic volume index or 6-minute walk distance) are related to a fixed set of covariates: age at baseline, sex, and changes in hemoglobin, log transformed bilirubin, log transformed creatinine, and systolic blood pressure. The decision to use a log transformation was based on whether the log transformation brought the transformed distribution closer to normality.
The Wilcoxon signed-rank test was used to compare baseline global longitudinal strain with posttransplant strain measurements at 3 months and 1 year.
Results
Patient population
Of 63 consecutive SCD patients going HSCT, 1 died within the first year after transplant and 3 required a second transplant within the first year. Of the remaining 59 patients, 3 with chronic kidney disease on hemodialysis (1 pretransplant, 2 started within 1 month of transplant) were excluded because of confounding effects on cardiac parameters secondary to volume changes. Therefore, the study population consisted of 56 total patients (48 HbSS, 3 HbSC, 4 HbS β0, 1 HbS β+). Forty-one underwent HLA-matched HSCT and 15 had haploidentical HSCT. Mean age at the time of HSCT was 32 ± 10 years, and 25 (45%) were female. There were 19 patients on cardiovascular medications pre-HSCT; 11 patients on angiotensin-converting enzyme inhibitors or angiotensin receptor blockers, 5 patients on beta-blockers, 7 patients on diuretics, 5 patients on calcium channel blockers, 4 patients on sildenafil or ambrisentan, and 2 patients on aspirin. Some of these medications were prescribed for renal protection. Post-HSCT, there were 30 patients on cardiovascular medications; 17 patients on angiotensin-converting enzyme inhibitors or angiotensin-converting enzymes, 5 on beta-blockers, 9 on diuretics, 6 on calcium channel blockers, 3 on aspirin, 1 on bosentan, and 6 on other vasodilators.
Cardiac changes following exchange transfusion
Thirty-two patients underwent an exchange transfusion within 3 months of transplant. Only 3 of these patients had been on chronic transfusion therapy every 3 to 4 weeks. Pretransfusion echos were performed an average of 25 days before transfusion (range, 174 days) and posttransfusion echos were performed an average of 9 days following transfusion (range, 1-41 days). Hemoglobin levels (Table 1) increased from 9.2 ± 1.5 g/dL to 9.9 ± 0.7 g/dL (P = .02). Total bilirubin and reticulocyte count decreased significantly (from 2.5 ± 2.1 mg/dL to 1.4 ± 0.9 mg/dL, P < .0001; and from 9.3% to 3.6%, P < .0001, respectively) consistent with an improvement in the hemolysis and anemia.
Cardiac diameters did not change with transfusion; however, LV end-diastolic volume index increased significantly (from 69.4 ± 17.7 to 76.4 ± 18.9, P = .002) likely because of the acute volume load. Measurements of LV mass, left atrial (LA) volume, LV ejection fraction, and cardiac output remained unchanged following transfusion. Multivariate regression analysis showed no association between the covariates age, sex, and pre- to postexchange changes in hemoglobin, log total bilirubin, log creatinine, and systolic blood pressure and the dependent variable of pre- to postexchange change in LV end-diastolic volume index.
Physiologic changes following successful HSCT
Following HSCT, 79% of patients (44/56; 26 males) had successful engraftment with donor-type hemoglobin and reversal of the SCD phenotype. Ninety percent (37/41) were successful in the HLA-matched cohort and 47% (7/15) were successful among the haploidentical patients. Body surface area (BSA) was noted to increase over time (Table 2), consistent with expected weight gain over 1 year following transplant. Diastolic blood pressure and serum creatinine both increased as well, likely resulting from sirolimus treatment, weight gain, and potentially increased muscle mass, although heart rate remained unchanged. At 3 months following successful HSCT, hemoglobin levels increased significantly from 9.5 ± 0.9 g/dL to 11.3 ± 2.0 g/dL (P < .005). Hemoglobin continued to increase to 12.3 ± 0.9 g/dL at 1 year following HSCT (P = .033 for 3- to 12-month change), although it did not meet our stringent definition of significance (P < .005). As expected, other laboratory values, including total bilirubin, reticulocyte count, and lactate dehydrogenase were improved in all successful patients 3 months after HSCT (Table 2). N-terminal pro B-type natriuretic peptide (NT-proBNP) levels were available at baseline and 1 year and also decreased significantly (P < .005; supplemental Figure 1A). Because the focus of this analysis was cardiac structural changes, we included all genotypes, however, the exclusion of HbSC and HbS β+ patients resulted in very similar findings (supplemental Table). Comparison between patients undergoing HLA-matched HSCT vs haploidentical patients showed no significant difference in hemoglobin change or LV size based on type of transplant (supplemental Figure 2); however, the small number of haploidentical patients reduced the power of this comparison.
Structural cardiac changes following successful HSCT
Cardiac measurements improved dramatically 3 months after HSCT (Table 2). LV end-diastolic volume index (LVEDV/BSA) decreased significantly (83 ± 21 to 69 ± 21, P < .005, Figure 1) over this period. There was a significant correlation between LVEDV/BSA and hemoglobin (Spearman r = −0.55, P = .0002, Figure 2). The line shown in Figure 2 has a slope of −2.76, which indicates that each 1 unit increase in hemoglobin is associated with almost a 3-unit decline in LVEDV/BSA. We performed multivariable regression to see what variables were associated with the baseline to 3-month change in LVEDV/BSA. The explanatory variables were age, sex, and changes in hemoglobin, total bilirubin (log transformed), creatinine (log transformed), and systolic blood pressure. Only the change in hemoglobin appeared potentially associated with the change in LVEDV/BSA (P = .009). However, in this regression setting, the hemoglobin change did not reach our stringent threshold for significance (P ≤ .005).

LVEDV/BSA decreased significantly across all follow-up time points when each was independently compared with baseline (3 months, P ≤ .005; 6 months, P ≤ .005; 1 year, P ≤ .005). However, the degree of change between the 3- to 6-month and 6- to 12-month follow-up time points was not found to be significant.
LVEDV/BSA decreased significantly across all follow-up time points when each was independently compared with baseline (3 months, P ≤ .005; 6 months, P ≤ .005; 1 year, P ≤ .005). However, the degree of change between the 3- to 6-month and 6- to 12-month follow-up time points was not found to be significant.

There was a significant negative correlation between LVEDV/BSA and hemoglobin (Spearman r = −0.55, P = .0002) from baseline to the 3 months’ follow-up.
There was a significant negative correlation between LVEDV/BSA and hemoglobin (Spearman r = −0.55, P = .0002) from baseline to the 3 months’ follow-up.
The ejection fraction decreased significantly (65% ± 4.9% to 57% ± 5.1%, P < .005), but remained in the normal range. Diastolic filling parameters also improved at 3 months, consistent with a decrease in the LV size, and LA volume index improved significantly as well. Cardiac parameters continued to improve slightly over time, but the degree of change between the 3 to 6 month and 6- to 12-month follow-up timepoints was not significant (Table 2). The improvement seen in NT-proBNP levels correlated significantly with changes in LV size (LVEDV/BSA; r = 0.51, P = .001), LV mass index (r = 0.38, P = .02), and LA size index (r = 0.39, P = .02).
LV strain measurements were performed at baseline, 3 months, and 1 year. The mean GLS at baseline in patients with successful HSCT was borderline normal/mildly decreased at −18.8 ± 2.9. At 3 months, the GLS worsened (−16.9 ± 2.3, P < .005 for comparison with baseline) and remained abnormal at 12 months (−16.3 ± 2.4, P = .42 for comparison with 3 months, P < .005 for comparison with baseline). Because the conditioning regimens included TBI for both HLA-matched sibling and haploidentical transplants, but only the haploidentical patients received cyclophosphamide, we compared strain measurements in these subgroups of successful transplants and observed similar patterns. For the subset of 37 HLA-matched transplants, mean values shifted from −18.8 ± 3.0 to −16.9 ± 2.4 at 3 months (P < .005 for comparison with baseline) to −16.3 ± 2.5 at 12 months (P = .50 for comparison with 3 months, P < .005 for comparison with baseline). For the smaller subset of 7 haploidentical transplants, the mean values shifted from −18.7 ± 2.9 to −16.6 ± 2.4 at 3 months (P = .38 for comparison with baseline) to −16.2 ± 2.4 at 12 months (P = .05 for comparison with 3 months, P = .47 for comparison with baseline). Although the pattern of differences in this smaller subset of 7 was similar, the P values do not reach significance primarily because of the smaller sample size.
Effect of successful HSCT on estimated pulmonary pressures
Following successful HSCT, the estimated tricuspid regurgitation (TR) velocity did not change significantly at any timepoint. There were 24 patients (55% of the successful transplants) that had a TR velocity ≥2.5 m/s at baseline. At 1 year, there was a significant decrease in TR velocity in this subgroup of patients from a median of 2.7 m/s at baseline to 2.3 m/s at 1 year, P < .005 (Figure 3). Some of this reduction may represent regression to the mean that can arise when focusing on those individuals with abnormally high baseline values.
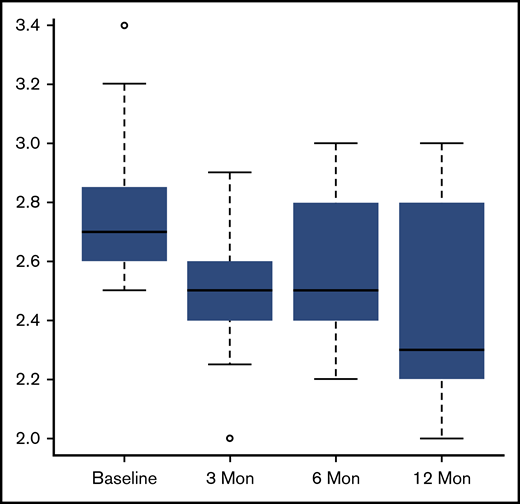
In patients with a TR velocity ≥2.5 m/s at baseline, there was a significant decrease in TR velocity at only the 1-year follow-up time point (1 year, P ≤ .005).
In patients with a TR velocity ≥2.5 m/s at baseline, there was a significant decrease in TR velocity at only the 1-year follow-up time point (1 year, P ≤ .005).
Effect of successful HSCT on QTc interval
Electrocardiograms were available in 44 patients at baseline and 28 patients at the 1-year timepoint. Because a prolonged QTc interval is associated with a higher risk of sudden death,32,33 we evaluated changes after HSCT and its association with echo variables. The baseline QTc interval was 453 ms in women and 432 ms in men and had a modest correlation with hemoglobin level (r = −0.34, P = .03), but did not correlate with baseline LVEDV/BSA, LV mass, or LV mass index. The QTc interval did not change significantly after successful transplant and had no correlation with the change in LVEDV/BSA.
Effect of successful HSCT on 6-minute walk time and correlation with cardiac parameters
Six-minute walk time was available in 26 patients at baseline before HSCT and ranged from 284 to 696 m (average, 509 ± 81 m). At 3 and 6 months following HSCT, there was no significant change; however, there was a suggestion of improvement (544 ± 83, P ≤ .01) at 1 year. Multivariate regression did not show that any of our covariates were significantly associated with this change, although the sample size is perhaps too small to reveal true effects.
Comparison with unsuccessful HSCT
Of 56 patients undergoing HSCT, 12 were unsuccessful, of whom 4 were HLA-matched and 8 were haploidentical. In contrast to the successful HSCT patients, hemoglobin did not change significantly at any timepoint from baseline to 1 year (Table 3; Figure 4). There was a trend toward improvement in LA and LV size, although this did not meet our stringent threshold for significance (P ≤ .005). Markers of hemolysis and reticulocyte count also trended toward an increase. Individual log NT-proBNP levels did not improve significantly in this group (P = .85; supplemental Figure 1B) and 6-minute walk distance did not change (Table 3). Statistical comparisons between the successful and unsuccessful HSCT patients were limited by the small sample size of the unsuccessful group. A multivariate model across several representative variables (LVEDD, LVEDV/BSA, LV mass index, LA volume index, septal E/e′, Log NT-proBNP, 6-minute walk distance) suggests that the magnitude of the percentage change for the successful group was greater (by ∼8.5%, P = .04) than the percentage change in the unsuccessful group (Appendix A).
Cardiac and laboratory parameters before and following HSCT in 12 patients with unsuccessful transplants
| Parameter | Baseline | 1 y | P |
|---|---|---|---|
| BSA, m2 | 1.74 ± 0.21 | 1.75 ± 0.22 | .12 |
| SBP, mm Hg | 116 ± 12 | 115 ± 12 | .75 |
| DBP, mm Hg | 60 ± 9 | 67 ± 14 | .13 |
| Heart rate, beats/min | 75 ± 14 | 83 ± 13 | .06 |
| TR, cm/s | 2.6 ± 0.7 | 2.6 ± 0.8 | .88 |
| RVSP, mm Hg | 35 ± 20 | 38 ± 20 | .89 |
| LVEDD, mm | 49 ± 8.6 | 46 ± 5.0 | .15 |
| LVESD, mm | 31.6 ± 5.1 | 32.5 ± 5.3 | .04* |
| LVEDV/BSA, mL/m2 | 73 ± 22 | 63 ± 19 | .006** |
| LV mass index, g/m2 | 93 ± 28 | 88 ± 36 | .57 |
| LA volume index, mL/m2 | 43 ± 12 | 37 ± 16 | .06 |
| EF, % | 62 ± 5.7 | 60 ± 7.7 | .13 |
| CO, L/min | 5.7 ± 1.2 | 5.1 ± 1.0 | .07 |
| E/A ratio | 2.0 ± 0.8 | 1.6 ± 0.6 | .04* |
| Sep E/e′, cm/s | 11.2 ± 2.2 | 11.6 ± 3.2 | .89 |
| Lat E/e′, cm/s | 16 ± 5.0 | 17 ± 3.7 | .89 |
| Hemoglobin, g/dL | 9.4 ± 1.7 | 9.5 ± 1.9 | .92 |
| Total bilirubin, mg/dL | 1.4 ± 0.9 | 2.2 ± 1.7 | .11 |
| Serum creatinine, mg/dL | 1.2 ± 2.1 | 1.4 ± 2.2 | .21 |
| Reticulocyte count, % | 4.1 ± 4.2 | 7.5 ± 2.9 | .009** |
| LDH, U/L | 339 ± 157 | 346 ± 121 | .50 |
| 6-min walk, m | 469 ± 108 | 456 ± 123 | .22 |
P ≤ 0.05 and **P ≤ 0.01 for 1 year compared with baseline echo.
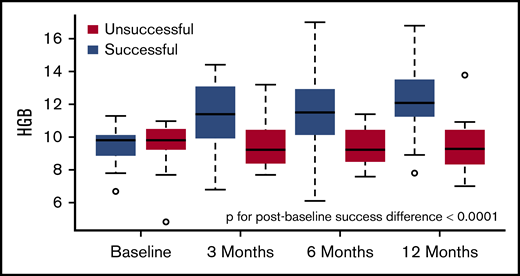
Hemoglobin levels improved significantly in successful HSCT patients at 3 months with continued smaller improvements at 6 and 12 months. In unsuccessful HSCT patients, there were no significant changes in hemoglobin levels.
Hemoglobin levels improved significantly in successful HSCT patients at 3 months with continued smaller improvements at 6 and 12 months. In unsuccessful HSCT patients, there were no significant changes in hemoglobin levels.
Discussion
HSCT is the only curative option for patients with SCD. Current indications for HSCT include SCD-associated comorbidities such as recurrent vaso-occlusive crises, central nervous system events, sickle nephropathy, or lung disease. Because these patients usually have multiple comorbidities and conditioning regimens can have varying degrees of toxicity, the overall effect of HSCT on end-organ function is an important consideration. Our study confirmed that despite the use of low-dose TBI and intravenous cyclophosphamide in most of the haploidentical patients, clinically significant cardiac parameters did not worsen following HSCT in our patients with severe SCD.
In this study, RBCx had little or no immediate acute effect on cardiac parameters. Although there was a small but significant increase in the hemoglobin level, this was accompanied by a small increase in LV size. This may have been due to wide variation in the amount of time spent during the procedure (depending on the patient’s size, tolerance, and quality of vascular access), which likely affected the total volume of fluid received. In addition, patients may have ended the procedure with a positive fluid balance after RBCx either because the replacement fluid had a higher hematocrit level than what was removed or because additional anticoagulation fluids and/or saline were administered during RBCx. Because echos were performed an average of 25 days before and 9 days after RBCx, other interim hemodynamic changes may also have affected these results.
In contrast, we saw dramatic changes in LA size and LV size, systolic function, and diastolic function as early as 3 months after successful HSCT. These morphologic changes were associated with increased hemoglobin and improvements in serum markers of hemolysis. Structural cardiac improvements continued up to 1 year following HSCT, and there was a suggestion of improvement in patients’ functional capacity as measured by the 6-minute walk test.
Cardiovascular changes in SCD have been well characterized and are responsible for much of the morbidity and mortality in this disease.6 Hemolysis and its resulting anemia leads to a chronic increase in cardiac output, increased cardiac chamber wall stress, and 4-chamber dilation. Superimposed on this are episodes of acute vaso-occlusion and tissue ischemia that lead to increased pulmonary pressures, diastolic dysfunction, microvascular ischemia, and fibrosis.34,35 A number of cardiac changes, including increased pulmonary pressures,5 diastolic dysfunction,2 and prolonged QT,32,33 have been shown to be independent predictors of mortality.
The effects of various treatments on sickle cell cardiac morphology have not been well described. HU is known to increase the concentration of fetal hemoglobin and may also have beneficial effects through the reduction of leukocytes and decrease in expression of adhesion molecules.36 Most studies have shown no changes in ventricular size, mass, or function with HU treatment, although mild improvements in diastolic function have occasionally been noted.37,,-40 Despite a lack of structural changes, however, resting myocardial perfusion has been noted to be higher in HU-treated patients than in untreated patients.37
Observational data suggest that exchange transfusions are an effective therapy for acute and chronic complications of SCD, and 1 case report suggests improvement in hyperhemolysis syndrome and cardiac function following RBCx.41 Cardiac evaluations of patients undergoing chronic transfusion therapy suggest no change in systolic and diastolic function except for a decrease in cardiac index following transfusion, consistent with an increase in oxygen-carrying capacity14,42
Covi and colleagues evaluated cardiac parameters in 23 children (mean age, 11 ± 4 years) undergoing HSCT (11 with SCD, 12 with aplastic anemia) and did not see significant changes in standard measures of biventricular function.24 They used speckle tracking echo to show that LV global longitudinal strain, a more sensitive measure of contractility, was abnormal at baseline, decreased following transplant and then resumed baseline levels by 1 year. Our study, in contrast, included a larger number of adult SCD patients with significant baseline structural abnormalities. Despite this, the mean GLS at baseline was near-normal as seen in prior reports.43,44 Following HSCT, there was dramatic improvement in the cardiac structural changes; however, there was a mild GLS decrease at 3 months, possibly from the TBI and/or cyclophosphamide. Although structural changes continued a trend toward improvement at the 1-year timepoint, the GLS values remained low, suggesting that the subclinical dysfunction in adults may require more time for complete recovery.
On average, our patients had a 22% decrease in left atrial and LV volume index 1 year after successful HSCT. This degree of reverse LV remodeling is consistent with that seen following correction of other volume overload conditions. For example, in an echocardiographic study of healthy pregnant women, LV size decreased 11% from the third trimester to 1 year postpartum.45 In patients with valvular heart disease, a recent meta-analysis of transcatheter repair in severe functional mitral regurgitation showed an average 12% decrease in LV volume after intervention.46 In patients with severe aortic regurgitation undergoing treatment with either transcatheter aortic valve implantation47 or aortic valve surgery, LV volume decreased an average of 30% to 35%.48,49 Therefore, the cardiac structural improvements seen in our patients post-HSCT are within the clinically significant range.
Our data showing a good correlation between change in LV size and change in hemoglobin suggest that increased hemoglobin itself through new drugs and treatments other than HSCT may also have a benefit on cardiac parameters. Yet, an increase in hemoglobin is likely to be responsible for only a portion of the improvement in cardiac parameters. Changes in cardiac morphology may also have been due to other factors such as improvements in microvascular blood flow, a decrease in inflammation, and a decrease in hemolysis. The patients with unsuccessful transplants also had some improvement in their cardiac parameters. Because these patients were followed very closely at our institution for the first 3 months and then locally, they may have received other interventions that indirectly affected cardiac morphology even though their hemoglobin levels did not improve.
Our study is limited by only 79% of the total patient population having a successful outcome following HSCT. The regimens between HLA-matched sibling and haploidentical transplants varied slightly, although the heart would see the same benefit of normal RBCs and we did not detect a clinically significant negative cardiac impact of the conditioning regimen or transplant procedure. Because total hemoglobin levels improve, hemolysis disappears, blood flow increases, and, potentially, inflammation improves simultaneously after transplant, the specific mechanism by which cardiac morphology improves after transplant is not known.
Another limitation of our study is the lack of a more detailed assessment of the myocardium and myocardial iron content with cardiac magnetic resonance. Cardiac magnetic resonance measurements of extracellular volume (ECV) have been used to quantitate diffuse fibrosis.50 Niss and colleagues studied 25 SCD patients and found markedly elevated ECV levels comparable to those seen in areas of focal myocardial infarction.35 They saw higher ECV levels in patients with diastolic dysfunction and there was an inverse correlation between ECV and hemoglobin levels. In our patients with a successful HSCT, almost one-third continued to have a dilated left ventricle, although most had improved from baseline levels. The presence and etiology of residual myocardial damage following successful HSCT is the subject of ongoing research.
In conclusion, our study reveals that cardiac parameters did not change acutely following RBCx. However, LV volume index, LA volume index, and markers of diastolic dysfunction improve significantly as early as 3 months post-HSCT, corresponding with an increased hemoglobin in successfully transplanted patients. Because diastolic dysfunction has been associated with early mortality, successful HSCT may lead to an improvement in the quality and quantity of life for patients with SCD. Further studies will be needed to evaluate changes in the myocardium following HSCT and to help determine which cardiac complications should be considered as indications for transplant.
The full-text version of this article contains a data supplement.
Acknowledgment
This research was supported by the Intramural Research Program of the National Heart, Lung, and Blood Institute, National Institutes of Health, Department of Health and Human Services.
Authorship
Contribution: Each author contributed significantly to this manuscript in 1 or more of the following areas: conception and design of the study, analysis, and interpretation of data; drafting and revision of the letter; and final approval.
Conflict-of-interest disclosure: The authors declare no competing financial interests.
Correspondence: Vandana Sachdev, Cardiology Branch, Division of Intramural Research, National Heart, Lung, and Blood Institute, National Institutes of Health, 10 Center Dr, CRC 5-1436, Bethesda, MD 20892-1650; e-mail: sachdevv@nhlbi.nih.gov.

