

TO THE EDITOR:
We read the article by Carpenter et al1 with interest because it provides crucial information on the trends in pediatric pulmonary embolism (PPE) in the United States. Similarly, we conducted an analysis of the Pediatric Health Information System (PHIS) database (initiated prior to the aforementioned publication), with an aim to identify features associated with mortality and recurrent PPE. PHIS is an administrative database that contains clinical and resource utilization data for inpatients from 45 not-for-profit tertiary-care hospitals throughout the United States. Participating hospitals provide discharge data, including patient demographic data, diagnoses, and procedure codes.2
Carpenter et al1 analyzed children up to 18 years of age in the PHIS database from 2001 to 2014, whereas we analyzed the PHIS database between 2004 and 2017 and used the International Classification of Diseases, Ninth Revision (ICD-9) (415.11, 415.12, 415.13, 415.19) and ICD-10 (I26.01, I26.02, I26.09, I26.90, I26.92, I26.99) diagnostic codes (PHIS began using ICD-10 codes in 2015). Additionally, we included patients <21 years of age based on the National Institute of Child Health and Human Development pediatric age definition.3 Although Carpenter et al1 evaluated pulmonary embolism (PE) rate and compared it with venous thromboembolism (VTE) discharges and all hospital discharges, for other variables (eg, sex, mortality, CCC risk factors for recurrence) they primarily compared PE patients with VTE patients. We analyzed the PPE cohort and compared demographics of this cohort with all hospital admissions. Additionally, we evaluated risk factors for recurrent PE (subsequent admission with an ICD code for PE) and mortality within 2 years of the index PE event, using univariate analysis and multivariate analysis with a Cox proportionate hazards model. Consequently, we identified additional risk factors and characterizations for PPE that we believe are informative and worth reporting.
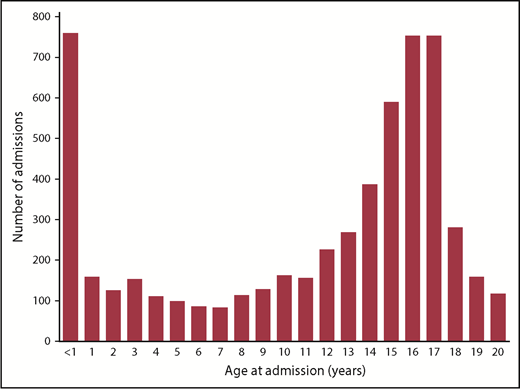
Our PE cohort consisted of 5654 unique patients who had inpatient PPE admissions between 2004 and 2017. The median number of PE patients per center is 8 per year (range, 1-29). We observed a similar increase in the rate of PE (from 5.12 per 10 000 admissions to 9.22 per 10 000 admissions) during the study period. The Carpenter et al1 study did not identify a bimodal age distribution for PE, but evaluation of our cohort by age revealed the distribution of PPE patients to be clearly bimodal (Figure 1), suggesting that, like for VTE, infants and adolescents are most at risk.
In their study, Carpenter et al1 reported that the proportion of males with PE was higher than females (54% vs 46%) except within the 13- to 18-year-old age group. This proportion is identical to the total number of males vs females admitted to PHIS hospitals in our study (males: 3 924 860/7 267 444 [54%] and females: 3 341 644/7 267 444 [46%]; 940 hospitalizations had a missing value for sex), as well as to what has been reported in other PHIS studies.4 In our study, the numbers of males and females with PE were equal (2848 vs 2806, respectively); however, when we analyzed sex in the entire inpatient cohort, the rate of PE was higher in females (0.084%) compared with males (0.073%) (P < .0001).
Carpenter et al1 reported the mortality in PPE to be 8.3%. In our cohort, the 2-year mortality was similar at 8.6% (489/5654). Of the 489 deaths, 473 died during their first PE (index) hospitalization. When mortality was further analyzed by age, we identified significant differences, with the highest mortality in the youngest patients: 26% in 0 to <1 year, 9.5% in 1 to <6 years, 8.8% in 6 to <12 years, 4.4% in 12 to <18 years, and 6.5% in 18 to <21 years (P < .0001). These differences were also observed in the Cox proportionate hazards model (Table 1). The very high mortality in patients <1 year of age is likely related to the fact that 80% (608/759) had underlying cardiac disease (as identified by ICD-9 and ICD-10 codes for cardiovascular [CV] complex chronic condition [CCC], as previously defined).5 There was no difference in mortality based on sex or race. Patients with CV, oncologic, or any CCC had higher rates of mortality. This was particularly striking when we compared mortality in patients with any CCC with those with no CCC, for whom the hazard ratio was 6.2 (3.5-11.1). Patients who died had a longer length of stay (median, 27 days vs 12 days), although, in the Cox regression model, at any given time, an increase in length of stay had decreased risk of mortality.
Factors associated with readmission for PE and mortality
| Clinical factor | Total PE admissions, N = 5654, n (%) | Recurrent PE models | 2-y mortality models | ||||||
|---|---|---|---|---|---|---|---|---|---|
| Univariate analysis, n = 510, n (%) | P | Cox hazard ratio (95% CL) | P | Univariate analysis, n = 489, n (%) | P | Cox hazard ratio (95% CL)* | P | ||
| Age at admission, y | |||||||||
| 0 to <1 | 759 (13.4) | 26 (3.4) | <.0001 | Reference | 198 (26.1) | <.0001 | Reference | ||
| 1 to <6 | 642 (11.4) | 39 (6.0) | 1.34 (0.80-2.24) | .26 | 61 (9.5) | 0.52 (0.38-0.70) | .001 | ||
| 6 to <12 | 731 (12.9) | 60 (8.2) | 1.48 (0.90-2.42) | .12 | 64 (8.8) | 0.68 (0.50-0.93) | .015 | ||
| 12 to <18 | 2967 (52.5) | 309 (10.4) | 1.82 (1.16-2.83) | .009 | 130 (4.4) | 0.47 (0.36-0.61) | .001 | ||
| 18 to <21 | 555 (9.8) | 76 (13.7) | 2.23 (1.38-3.68) | .001 | 36 (6.5) | 0.56 (0.38-0.83) | .004 | ||
| Sex | .50 | ||||||||
| Male | 2848 (50.4) | 254 (8.9) | .79 | 0.93 (0.78-1.15) | .44 | 272 (9.6) | .015 | 1.07 (0.89-1.28) | |
| Female | 2806 (49.6) | 256 (9.1) | Reference | 217 (7.7) | Reference | ||||
| Race | |||||||||
| White | 3526 (62.3) | 300 (8.5) | .019 | Reference | .376 | 277 (7.9) | <.0001 | Reference | |
| African American | 1089 (19.3) | 124 (11.4) | 0.90 (0.73-1.13) | .448 | 72 (6.6) | 0.92 (0.70-1.20) | .513 | ||
| Asian† | 128 (2.3) | 8 (6.3) | 1.10 (0.86-1.42) | 8 (6.3) | 1.39 (1.11-1.73) | .004 | |||
| Other/missing† | 911 (16.1) | 78 (8.6) | 132 (14.5) | ||||||
| CCC | |||||||||
| CV | 2013 (35.6) | 132 (6.6) | <.0001 | 0.87 (0.68-1.10) | .26 | 356 (17.7) | <.0001 | 1.87 (1.47-2.38) | <.0001 |
| Oncologic | 710 (12.6) | 136 (19.1) | <.0001 | 1.76 (1.42-2.26) | <.0001 | 85 (12.0) | .0008 | 1.772 (1.36-2.30) | <.0001 |
| Any CCC | 3674 (65.0) | 376 (10.2) | <.0001 | 1.25 (0.97-1.6) | .08 | 474 (12.5) | <.0001 | 6.20 (3.53-11.08) | <.0001 |
| Alteplase | 1634 (28.9) | 142 (8.7) | .5810 | 1.16 (0.94-1.44) | .18 | 238 (14.57) | <.0001 | 1.17 (0.96-1.44) | .12 |
| Length of stay for index PE, median (IQR), d | 28 (12-57) | 10 (5-21) | <.0001 | 0.96 (0.96-0.97) | <.0001 | 27 (10-61) | <.0001 | 0.90 (0.89-0.91) | <.0001 |
IQR, interquartile range.
Cox proportionate hazard model removed 170 patients with missing race information.
Asian and other races are grouped together to compare with white patients in Cox regression.
We also analyzed the presence of risk factors according to various age groups. We observed that CV CCC and gastrointestinal, neurologic/neuromuscular, congenital/genetic, renal, and respiratory CCC were most frequently found in the 0 to <1–year age group. In contrast, hematologic/immunologic and malignant CCC were most prevalent in the 18 to <21–year age group. A total of 92% of the 0 to <1–year age group had ≥1 CCC compared with 52% of the 12 to <18–year age group.
Males had a higher risk (P < .05) for CV, gastrointestinal, malignancy, neurologic/neuromuscular, and congenital/genetic CCC compared with females within the PE cohort. On the other hand, obesity was a greater risk for females across all PE patients >1 year (P < .001).
Carpenter et al1 reported that the use of recombinant tissue plasminogen activator (tPA) had stayed constant over the duration of the study, with no variation in use over the years. We stratified tPA use according to age cohorts and found that patients <1 year old had higher use than the older cohorts: 43% vs 37% in 1 to <6 years, 33% in 6 to <12 years, and 24% each in 12 to <18 years and 18 to <21 years.
In our cohort, 510 of the 5654 patients had ≥1 subsequent admission during which PE was also diagnosed, suggesting that the rate of recurrence was 9.0% (Table 1). Although we did not identify race as a risk factor for index PE (compared with all PHIS admissions), univariate analysis identified a higher recurrence rate in African American children (as previously reported by Carpenter et al1 ); however, this was no longer significant in the multivariate analysis. We also found that there was an age-based incremental difference in the rate of recurrence, with children >12 years at higher risk compared with younger children. This difference remained significant in a multivariate analysis adjusted for other covariates. Univariate analysis also identified any CCC or an oncologic CCC as a risk factor, whereas the presence of a CV CCC was associated with a lower risk for recurrence. In the multivariate regression, only an oncologic CCC remained significantly associated with a higher risk for recurrence.
Key novel observations of our study include the age- and sex-based differences in the epidemiology of PPE, higher mortality in infants, and a higher risk for recurrent PE in children >12 years of age. A recent study reported that there seem to be 2 distinct subtypes of PPE6 : classic thromboembolic PE and a second type that seems to be unique to the infant age group (in situ pulmonary artery thrombosis) and was deemed to be due to underlying local/anatomical causes in the pulmonary artery, with the latter being a distinct entity. Thus, given that 80% of the infants with PE had a CV CCC, the higher mortality in infants may be due to the association of an underlying CV cause of PE (or rather in situ pulmonary artery thrombosis). This is consistent with a recent analysis of a cohort of PPE patients that showed that 70% of infants <1 year of age had an underlying cardiac disease and were more likely to have massive or submassive PE (compared with nonmassive PE7 ). The second possibility for the higher mortality in infants is a lower CV capacity to tolerate the PE. Although this may be supported by our observation of higher use of tPA in the infant age group, these tPA data need to be interpreted with caution because we were unable to differentiate between patients who received tPA for thrombolysis and those who may have received it for obstructed catheters or chest tubes.
Recent studies have reported a higher incidence of VTE in females, primarily in the adolescent age group, presumably due to a higher usage of hormonal supplementation8 ; however, a recent study from Canada demonstrated that VTE incidence was higher in females across all age groups in children.9 Similarly, we found that, compared with all PHIS admissions, females have higher PE rates across all age groups, a finding that has not been described previously, suggesting that factors other than hormonal supplementation may be a risk factor for PPE. An additional reason for the larger proportion of females in our study compared with the Carpenter et al1 study may be related to the inclusion of patients up to 21 years of age.
Our study has several limitations. We used ICD-9 (similar to those used by Carpenter et al1 ) and ICD-10 codes for identification of cases. These include codes for septic PE, as well as the ICD-9 codes used by Carpenter et al1 for cancer and PE. In clinical practice, it is often not possible to differentiate septic emboli or tumor thrombus from true thromboembolic PE, because sepsis and cancer are independent risk factors for PE. This is a limitation of the PHIS database. Furthermore, we evaluated the presence of risk factors (CCC) in the entire PE cohort. To demonstrate that these were true risk factors, we would need to perform a case-control study and analyze the prevalence of CCC in non-PE patients. We did not analyze the data in this manner.
Our analysis provides key information in the trends of PPE that can be used in conjunction with the publication by Carpenter et al1 for conducting further research in this field. These data also suggest that, despite a 200% increase in the incidence,1 at individual centers, PPE is a rare disease, and multicenter collaboration with innovative approaches to clinical trial design are needed for conducting prospective clinical trials.
Contribution: M.R. conceptualized the study, analyzed the data, and wrote the manuscript; Y.-s.V.H. analyzed raw data from the PHIS database and reviewed the manuscript; and L.R. analyzed the data and reviewed and edited the manuscript.
Conflict-of-interest disclosures: M.R. has received honoraria for serving on the advisory boards for Novo Nordisk, Hema Biologics, Spark Therapeutics, and Takeda and is a coinvestigator on grants received from Pfizer and BMS. L.R. has served on advisory boards for Bayer, Roche, and CSL Behring. Y.-s.V.H. declares no competing financial interests.
Correspondence: Madhvi Rajpurkar, Children’s Hospital of Michigan, 3901 Beaubien St, Detroit, MI 48201; e-mail: mrajpurk@med.wayne.edu.

