

Key Points
IRF4 identifies Ag-specific CD8+ T cells.
IRF4 intensity correlates with TCR signal strength and reflects the affinity of Ag-specific CD8+ T cells.

Abstract
Assessment of the quality and the breadth of antigen (Ag)-specific memory T cells in human samples is of paramount importance to elucidate the pathogenesis and to develop new treatments in various diseases. T-cell receptor (TCR) signal strength, primarily controlled by TCR affinity, affects many fundamental aspects of T-cell biology; however, no current assays for detection of Ag-specific CD8+ T cells can assess their TCR signal strength in human samples. Here, we provide evidence that interferon regulatory factor 4 (IRF4), a transcription factor rapidly upregulated in correlation with TCR signal strength, permits the assessment of the TCR signal strength of Ag-specific CD8+ T cells in human peripheral blood mononuclear cells (PBMCs). Coexpression of IRF4 and CD137 sensitively detected peptide-specific CD8+ T cells with extremely low background in PBMCs stimulated for 18 hours with MHC class I peptides. Our assay revealed that human memory CD8+ T cells with high-affinity TCRs have an intrinsic ability to highly express CD25. Furthermore, HIV-specific CD8+ T cells in chronic HIV+ subjects were found to display primarily low-affinity TCRs with low CD25 expression capacity. Impairment in the functions of HIV-specific CD8+ T cells might be associated with their suboptimal TCR signals, as well as impaired responsiveness to interleukin-2.
Introduction
The adaptive immune system generates immunological memory to prepare for future immunological attacks and challenges with the same antigens (Ags).1-3 Assessment of the quality and the breadth of Ag-specific memory T cells in human samples (eg, peripheral blood and tissues) is of paramount importance in multiple fields, such as for the development of new vaccine designs for infectious diseases and new treatments for allergy, cancer, and autoimmune diseases. Several strategies are available to detect and characterize Ag-specific CD8+ T cells, each with its advantages and limitations. Peptide-MHC (pMHC) class I multimers are widely used to directly detect peptide-specific CD8+ T cells without in vitro stimulation with Ags.4 pMHC class I multimers can be combined with the assessment of surface and intracellular molecules by flow cytometry and mass cytometry and permit the simultaneous analysis of the frequency and quality of Ag-specific CD8+ T cells.5-7 However, this approach requires, in general, knowledge of the exact combination of the epitope and the HLA class I restriction. Another common approach is to culture peripheral blood mononuclear cells (PBMCs) in vitro for a short period with MHC class I peptides and analyze the expression of cytokines (enzyme-linked immunospot and intracellular cytokine staining) or activation markers (CD137 assay8 ) by the CD8+ T cells responding to the peptides. Enzyme-linked immunospot is the most sensitive among these methods, yet it is only able to assess a few parameters, such as cytokines.9-12 Intracellular cytokine staining is dependent on the expression of cytokines by the specific CD8+ T cells and, thus, does not detect T cells with no cytokine expression. CD137 assay has a higher background than other assays because of the presence of preactivated CD137+ cells in blood circulation.
T-cell receptor (TCR) signal strength, which is primarily influenced by the TCR affinity against the pMHC class I complex, affects many fundamental aspects of T-cell biology, including differentiation into different subsets, generation of memory T cells, and T-cell functions.13-15 Nonetheless, no assay for the characterization of Ag-specific CD8+ T cells in humans can assess their TCR signal strength (or TCR affinity). Interferon regulatory factor 4 (IRF4) is a transcription factor that belongs to the IRF family with diverse immune-regulatory roles in innate and adaptive immunity.16-20 Although resting T cells do not express IRF4, IRF4 is rapidly expressed after TCR stimulation. Recent studies in mice show that IRF4 expression is in proportion to the strength of TCR signals,21 and IRF4 mediates TCR signal–dependent metabolic competition to ultimately favor the expansion and proliferation of T-cell clones.22,23 We hypothesized that assessment of IRF4 expression might permit the detection of Ag-specific CD8+ T cells, together with their TCR signal strength, in a short-term culture of human PBMCs with Ags.
Here, we show that IRF4 expression intensity by human Ag–specific memory CD8+ T cells correlated with TCR signal strength, providing another important layer in the characterization of Ag-specific CD8+ T cells in humans. In particular, the combination of IRF4 and CD137 permitted the detection of Ag-specific CD8+ T cells with extremely low background in human PBMCs stimulated for 18 hours with MHC class I peptides. By applying the IRF4-CD137 assay, we found that HIV-specific CD8+ T cells in chronic HIV+ subjects displayed primarily low-affinity TCRs with low CD25 expression capacity. Thus, impairment in the functions of HIV-specific CD8+ T cells might be associated with their suboptimal TCR signals, as well as impaired responsiveness to interleukin-2 (IL-2).
Materials and methods
Human PBMC samples
Buffy coat from healthy donors was obtained from the New York Blood Center, and PBMCs were isolated via gradient centrifugation with Ficoll. Frozen/thawed PBMCs were cultured with complete RPMI 1640 medium (containing l-glutamine, penicillin-streptomycin, 50 μM 2-mercaptoethanol, 1 mM sodium pyruvate, 1% nonessential amino acids, and 25 mM HEPES, pH 7.2-7.5) supplemented with 10% human heat-inactivated AB serum (Sigma) in U-bottom 96-well plates.
Blood samples from chronic HIV+ subjects were obtained at the Department of Infectious Diseases, Icahn School of Medicine at Mount Sinai (Benjamin Chen’s Laboratory). Deidentified blood samples that were discarded at the clinic were used for this study. Isolated PBMCs were kept frozen in liquid nitrogen until use.
Flow cytometry
The following anti-human antibodies were used for the cell staining for flow cytometry: CD4-APC-Cy7 (OKT4; BioLegend), CD8-BV650 (SK1; BioLegend), CD25-APC (M-A251; BioLegend), CD27-PE-Cy7 (O323; BioLegend), CD69-PE-Cy5 (FN50; BioLegend), CD45RA–Alexa Fluor 700 (HI100; BioLegend), CD137-PE-Dazzle594 (4B4-1; BioLegend), CCR7-FITC (G043H7; BioLegend), PD-1-BV421 (EH12.2H7; BioLegend), ICOS-PerCP-Cy5.5 (C398.4A; BioLegend), LIVE/DEAD Fixable Aqua, IL-2–FITC (MQ1-17H12; BioLegend), TNF-α–PE (Mab11; BioLegend), IFN-γ–BV570 (4S.B3; BioLegend), IRF4-APC (4E3; BioLegend), and IRF4-PE (Q9-343; Thermo Fisher). Stained cells were acquired on a BD LSRFortessa using FACSDiva software, and the flow data were analyzed with FlowJo v10.1.
The IRF4-CD137 assay
Thawed PBMCs were rested overnight at 37°C in U-bottom 96 well plates at 1 × 10⁶ cells per well. PBMCs were then cultured with Antigen Peptide Flu M1 – HLA-A*0201 (GILGFVFTL) (1 μg/mL; product code SP-MHCI-0004; JPT Peptide Technologies), PepTivator CEF MHC Class I Plus, human (1 μg/mL; order no. 130-098-426; Miltenyi Biotec), HIV MHC Class I human peptide pool (1 μg/mL; code PX-HIV; ProImmune ProMix HIV Peptide Pool), or Staphylococcal enterotoxin B (SEB; 1 μg/mL) for 18 hours at 37°C. Cultured PBMCs were stained for surface markers (CD4, CD8, CD25, CD27, CD45RA, CD69, PD-1, ICOS, CCR7, and CD137) and intranuclear IRF4 after fixation and permeabilization according to the BD Phosflow protocol. Stained cells were washed with 1× Perm/Wash Buffer and resuspended in 150 μL of phosphate-buffered saline for flow cytometry analysis. In the experiments with M1 peptide GILGFVFTL (pp58-66), PBMCs were incubated with the specific class I tetramer (HLA-A*02:01 with GILGFVFTL, obtained from the National Institutes of Health Tetramer Core Facility at Emory University) at 1:800 dilution for 30 minutes at room temperature before stimulation. For blocking the interactions between TCRs and pMHC complexes, PBMCs were pretreated with mouse anti-human HLA-ABC (10-100 μg/mL human, DX17; BD Pharmingen) for 30 minutes at 37°C.
Stimulation with cytokines alone
PBMCs were stimulated with cytokines for 18 hours at 37°C at the following concentrations: human IL-1β (10 ng/mL; PeproTech), human IL-2 (100 U/mL; R&D Technologies), human IL-4 (10 ng/mL; R&D Technologies), human IL-6 (25 ng/mL; PeproTech), human IL-7 (10 U/mL; R&D Technologies), human IL-12 (1 ng/mL; PeproTech), human IL-23 (25 ng/mL; PeproTech), human interferon-α (IFN-α; 1000 U/mL; gifted), human IFN-γ (10 ng/mL; BioLegend), human transforming growth factor-β (TGF-β: 5 ng/mL; PeproTech), and human Activin A (50 ng/mL; PeproTech).
CD3-CD28 stimulation
CD8+ T cells were negatively selected from frozen/thawed PBMCs with an EasySep Human CD8+ T Cell Isolation Kit (STEMCELL Technologies) (purity > 95%). CD8+ T cells were stimulated for 18 hours in flat-bottom 96-well plates coated with anti-CD3 (0.1-3 μg/mL; OKT3 American Type Culture Collection) and supplemented with soluble anti-CD28 (1 μg/mL; CD28.2; BioLegend).
Blocking PD-1–PD-L1 interactions
PBMCs were incubated with 10 μg/mL PD-L1 (B7-H1) antibody (catalog no. 16-5983-82; Invitrogen) for 30 minutes before stimulation with CEF or HIV peptide pool.
viSNE analysis
Data were transformed on Cytobank, and data analysis was performed using viSNE algorithms on the indicated gated live single cells.
Statistical analysis
Statistical analysis was performed using GraphPad Prism. P < .05 was considered significant.
Results
IRF4 is rapidly upregulated following TCR stimulation
We first analyzed whether human blood CD8+ T cells upregulate IRF4 upon TCR stimulation. PBMCs obtained from healthy adults were stimulated for up to 24 hours with the superantigen SEB, which is capable of activating CD4+ and CD8+ T cells, and analyzed for the expression of intranuclear IRF4 in CD8+ T cells. Although IRF4 expression in resting blood CD8+ T cells was very low, SEB stimulation induced IRF4 expression as early as 6 hours (Figure 1A). IRF4+ cells coexpressed an activation marker CD69, which peaked at 18 hours. The upregulation of IRF4 and CD69 was dependent on cell activation, because PBMC culture by itself did not upregulate these molecules (Figure 1B).

Expression of IRF4 by activated human blood CD8+T cells. Healthy donor PBMCs were stimulated with 1 μg/mL SEB and analyzed for the expression of surface and intracellular molecules at the indicated time points by flow cytometry. (A) IRF4 and CD69 expression by CD8+ T cells after stimulation with SEB. (B) IRF4 and CD69 expression by CD8+ T cells in unstimulated PBMCs (left panel) and PBMCs stimulated with SEB for 18 hours (right panel). (C) IRF4 and CD69 expression (left panel) and CD25 and CD137 expression (right panel) by CD8+ T cells after 18 hours of SEB stimulation. (D) Frequency of IRF4+CD69+, CD137+, and CD25+CD137+ cells in CD8+ T cells from healthy donor PBMCs after 18 hours of SEB stimulation (n = 24). Each point represents an individual donor. (E) IRF4 and CD69 expression in CD8+ TCM cells (CD45RA−CCR7+), TEM cells (CD45RA−CCR7−), naive T cells (CD45RA+CCR7−), and TEMRA cells (CD45RA+CCR7+) in SEB-stimulated PBMCs. (F) Mean fluorescence intensity (MFI) of IRF4 of baseline CD8+ TCM, TEM, naive T, and TEMRA cells (left panel) and after 18 hours of SEB stimulation (right panel) in healthy donor PBMCs (n = 3). Horizontal lines indicate the mean (± standard deviation). Each symbol represents an individual donor. *P < .05, **P < .01, **** P < .0001, 1-way analysis of variance with Tukey’s test. NS, not significant.
Expression of IRF4 by activated human blood CD8+T cells. Healthy donor PBMCs were stimulated with 1 μg/mL SEB and analyzed for the expression of surface and intracellular molecules at the indicated time points by flow cytometry. (A) IRF4 and CD69 expression by CD8+ T cells after stimulation with SEB. (B) IRF4 and CD69 expression by CD8+ T cells in unstimulated PBMCs (left panel) and PBMCs stimulated with SEB for 18 hours (right panel). (C) IRF4 and CD69 expression (left panel) and CD25 and CD137 expression (right panel) by CD8+ T cells after 18 hours of SEB stimulation. (D) Frequency of IRF4+CD69+, CD137+, and CD25+CD137+ cells in CD8+ T cells from healthy donor PBMCs after 18 hours of SEB stimulation (n = 24). Each point represents an individual donor. (E) IRF4 and CD69 expression in CD8+ TCM cells (CD45RA−CCR7+), TEM cells (CD45RA−CCR7−), naive T cells (CD45RA+CCR7−), and TEMRA cells (CD45RA+CCR7+) in SEB-stimulated PBMCs. (F) Mean fluorescence intensity (MFI) of IRF4 of baseline CD8+ TCM, TEM, naive T, and TEMRA cells (left panel) and after 18 hours of SEB stimulation (right panel) in healthy donor PBMCs (n = 3). Horizontal lines indicate the mean (± standard deviation). Each symbol represents an individual donor. *P < .05, **P < .01, **** P < .0001, 1-way analysis of variance with Tukey’s test. NS, not significant.
Stimulation with SEB also induced the expression of CD25 and CD137 on activated CD8+ T cells (Figure 1C), markers commonly used to detect activated CD8+ T cells in PBMC cultures.24,25 CD137 and CD25 expression also peaked at 18 hours (supplemental Figure 1A). Notably, the activated CD8+ T-cell population defined by the coexpression of IRF4 and CD69 (23.4% ± 7.4%, mean ± standard deviation) was significantly greater than that defined by CD137 alone (15.3% ± 5.7%) or by the coexpression of CD137 and CD25 (12.1% ± 5.0%) (n = 24) (Figure 1D). The CD137 and CD25–expressing population largely overlapped with IRF4+CD69+ CD8+ T cells (supplemental Figure 1C). These results show that the combination of IRF4 and CD69 sensitively detects the activated CD8+ T-cell population in PBMC cultures.
Stimulation with cytokines alone is insufficient for IRF4 upregulation
In contrast to other members of the IRF family, the expression of IRF4 in T cells is primarily induced by TCR signals and not by type I or type II IFNs.26 Nonetheless, SEB-stimulated PBMCs produce various cytokines, and it is possible that IRF4 expression was induced in response to the produced cytokines. To examine this possibility, we cultured healthy donor PBMCs for 18 hours with single cytokines, including IL-1β, IL-2, IL-4, IL-6, IL-7, IL-12, IL-23, Activin A, IFN-α, IFN-γ, and TGF-β, and examined the expression of IRF4 and CD69. Whereas CD69 expression was upregulated in response to cytokines, including IL-2, IL-4, IL-12, IFN-α, and IFN-γ, IRF4 expression was not upregulated by any cytokine (supplemental Figure 1D). Thus, whereas CD69 upregulation can be influenced by cytokine signals, IRF4 upregulation is dependent on TCR signals.
IRF4 upregulation is similar among CD8+ T-cell subsets
Human blood CD8+ T cells are composed of distinct subsets defined by the differential expression of CD45RA and CCR7, including naive T cells, central memory T (TCM) cells, effector memory T (TEM) cells, and CD45RA+ effector memory T (TEMRA) cells.27 We wondered whether IRF4 expression intensity differs among CD8+ T-cell subsets at baseline and/or after activation. Whereas IRF4 expression at baseline was marginally, but consistently, higher in TEM cells than in other CD8+ T-cell subsets, IRF4 was strongly upregulated by the 4 subsets upon activation with SEB, with no substantial differences (Figure 1E-F). By contrast, CD69 expression was substantially higher in activated naive cells than in memory subsets (Figure 1E). Collectively, these results show that IRF4 upregulation is universal and equivalent among activated CD8+ T-cell subsets.
The IRF4 assay can detect Ag-specific T cells
To determine the utility of IRF4 to detect Ag-specific CD8+ T cells in PBMC culture, we stimulated PBMCs from HLA-A2+ healthy individuals with HLA-A2–restricted influenza M1 (Flu-M1) peptide GILGFVFTL. HLA-A2-Flu-M1–specific CD8+ T cells were prelabeled with a specific pMHC class I tetramer. The frequency of tetramer+ CD8+ T cells was similar among unstimulated, dimethyl sulfoxide (DMSO; peptide diluent)–treated, and Flu-M1–stimulated PBMCs (Figure 2A), indicating that stimulation with the peptide did not elicit clonal expansion during the culture. We found that tetramer+ CD8+ T cells strongly upregulated IRF4 and CD69 (∼75%) when stimulated with Flu-M1 (Figure 2B, left panels; supplemental Figure 2A). Consistent with the results with SEB stimulation, 18-hour culture yielded the largest CD69+IRF4+ population among the tetramer+ CD8+ T cells (data not shown). Stimulation with Flu-M1 for 18 hours also induced tetramer+ CD8+ T cells to upregulate CD137 and CD25 (Figure 2B, middle panels; supplemental Figure 2A), and the CD137hi populations coexpressed IRF4 (Figure 2B, right panels). Upregulation of IRF4 was limited to tetramer+ CD8+ T cells (supplemental Figure 2B). These results show that peptide-specific CD8+ T cells were detected by the expression of IRF4 accompanied by an upregulation of activation markers, including CD69, CD137, or CD25, in the PBMC culture.

IRF4 expression by tetramer+CD8+T cells. PBMCs from HLA-A2+ healthy donors were prestained with Flu-M1–A2 tetramer and cultured with Flu-M1 GILGFVFTL peptide for 18 hours. (A) Frequency of tetramer+ cells in CD8+ T cells in unstimulated, DMSO-treated, and peptide-stimulated PBMCs. (B) Frequency of IRF4/CD69 (left panels), CD25/CD137 (middle panels), and IRF4/CD137 (right panels) of tetramer+ CD8+ T cells in unstimulated, DMSO-treated, and peptide-stimulated PBMCs. A representative result from 5 individual experiments is shown.
IRF4 expression by tetramer+CD8+T cells. PBMCs from HLA-A2+ healthy donors were prestained with Flu-M1–A2 tetramer and cultured with Flu-M1 GILGFVFTL peptide for 18 hours. (A) Frequency of tetramer+ cells in CD8+ T cells in unstimulated, DMSO-treated, and peptide-stimulated PBMCs. (B) Frequency of IRF4/CD69 (left panels), CD25/CD137 (middle panels), and IRF4/CD137 (right panels) of tetramer+ CD8+ T cells in unstimulated, DMSO-treated, and peptide-stimulated PBMCs. A representative result from 5 individual experiments is shown.
IRF4 intensity reflects TCR signal strength
Previous studies in mice showed that the level of IRF4 expression in activated T cells correlates with TCR affinity and TCR signal strength.17,23 To examine whether TCR signal strength also affects IRF4 expression in human CD8+ T cells, we stimulated CD8+ T cells isolated from healthy donor blood for 18 hours with titrated concentrations (0.1-1 μg/mL) of plate-bound anti-CD3 monoclonal antibody (mAb). Higher anti-CD3 concentration and, thus, stronger TCR signals yielded higher IRF4 expression (Figure 3A). IRF4 expression increased only marginally with increasing anti-CD28 concentrations, suggesting that CD28-derived signals play only a minor role in the expression of IRF4 (supplemental Figure 3A).
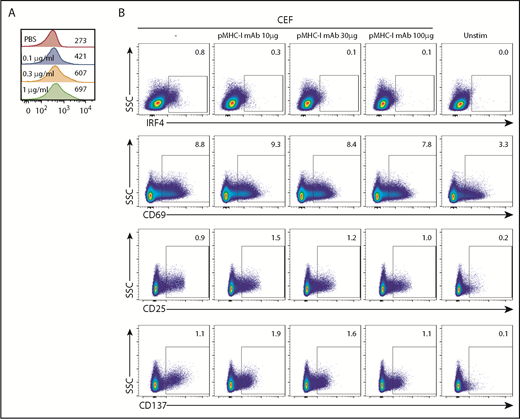
IRF4 expression reflects TCR signal strength. (A) Isolated blood CD8+ T cells were stimulated with increasing concentrations of plate-bound anti-CD3 mAb (0.1-1 μg/mL) for 18 hours. Mean fluorescence intensity of IRF4 in IRF4+CD137+ cells. A representative result from 3 individual experiments is shown. (B) PBMCs were treated for 30 minutes with increasing concentrations of anti-human pan MHC class I mAb (0-100 μg/mL) and then cultured with CEF peptides for 18 hours. Expression of IRF4, CD69, CD25, and CD137 by activated CD8+ T cells was analyzed. A representative result from 6 individual experiments is shown.
IRF4 expression reflects TCR signal strength. (A) Isolated blood CD8+ T cells were stimulated with increasing concentrations of plate-bound anti-CD3 mAb (0.1-1 μg/mL) for 18 hours. Mean fluorescence intensity of IRF4 in IRF4+CD137+ cells. A representative result from 3 individual experiments is shown. (B) PBMCs were treated for 30 minutes with increasing concentrations of anti-human pan MHC class I mAb (0-100 μg/mL) and then cultured with CEF peptides for 18 hours. Expression of IRF4, CD69, CD25, and CD137 by activated CD8+ T cells was analyzed. A representative result from 6 individual experiments is shown.
To further examine the relationship between IRF4 expression and TCR signal strength, we inhibited the interactions between TCR and pMHC complexes by adding titrated amounts of pan-MHC class I blocking mAb (10-100 μg/mL) to the culture. To gain robust, yet Ag-specific, CD8+ T-cell responses in PBMC cultures, we used a CEF peptide pool; this is commonly used as a positive control in Ag-specific CD8+ T-cell assays28 and contains MHC class I peptides derived from Ags expressed by cytomegalovirus, Epstein-Barr virus, and influenza virus. The stimulation with the class I CEF peptides induced upregulation of IRF4, CD137, and CD25 by ∼1% of specific CD8+ T cells (Figure 3B) but no CD4+ T cells (data not shown). IRF4 expression decreased proportionately with increasing amounts of pan-MHC class I mAb (Figure 3B). By contrast, CEF-specific CD8+ T cells remained positive for the expression of CD69, CD25, and CD137, even with the highest concentration of pan-MHC class I mAb. These results show that the expression of IRF4 is more sensitive to TCR signal strength than is the expression of CD69, CD25, and CD137, which seems to require only minimum TCR signals.
IRF4-CD137 detects Ag-specific CD8+ T cells with very low background
Stimulation with the class I CEF peptides yielded a CD8+ T-cell population coexpressing IRF4 and CD69 (Figure 4). However, the border between the IRF4lo and IRF4neg populations among CD69+ cells was vague. More importantly, given that IRF4 expression is dependent on TCR signal strength (Figure 3), Ag-specific, yet low-affinity, T cells might be missed in the IRF4+CD69+ population. Blood CD8+ T cells contained fewer CD137+ cells than CD69+ cells at baseline (Figure 3B), and we found that the combination of IRF4-CD137 was better than the combination of IRF4-CD69 in terms of the contrast between the background and the Ag-specific cells. Importantly, this strategy enabled us to dissociate in vitro–activated Ag-specific cells (CD137+IRF4+) from preactivated nonspecific cells (CD137+IRF4−). We also found that the combination of IRF4 and CD137 was better than the combination of CD137 and CD25 for the detection of Ag-specific CD8+ T cells in terms of the sensitivity, because not all of the Ag-specific CD8+ T cells upregulated CD25, as described later.
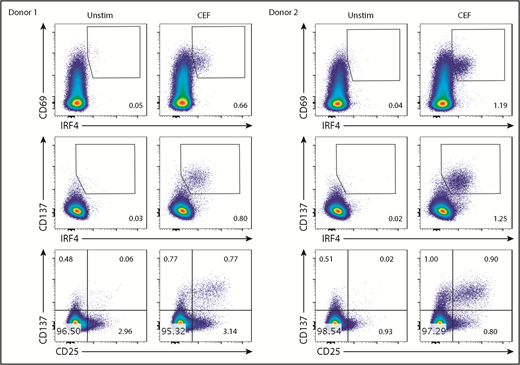
The IRF4-CD137 assay detects Ag-specific CD8+T cells with low background. PBMCs were cultured with CEF peptides for 18 hours and analyzed for the expression of the indicated molecules. Frequency of IRF4+CD69+ (top panels), IRF4+CD137+ (middle panels), and CD25+CD137+ cells (bottom panels) in CD8+ T cells. Two representative results are shown.
The IRF4-CD137 assay detects Ag-specific CD8+T cells with low background. PBMCs were cultured with CEF peptides for 18 hours and analyzed for the expression of the indicated molecules. Frequency of IRF4+CD69+ (top panels), IRF4+CD137+ (middle panels), and CD25+CD137+ cells (bottom panels) in CD8+ T cells. Two representative results are shown.
IRF4 expression intensity correlates with CD25
CEF-specific IRF4hi and IRF4lo CD8+ T cells expressed a similar intensity of CD137 and CD69 (Figure 5A). By contrast, CEF-specific IRF4hi CD8+ T cells expressed substantially higher levels of CD25 than did IRF4int or IRF4lo cells (Figure 5A). Because CD137 and CD25 expression was insensitive to TCR signal strength (Figure 3B), these observations suggest that IRF4hi-specific CD8+ T cells (thus, high-affinity T cells) exhibit an intrinsic ability to express CD25.

IRF4hiCD8+T cells highly express CD25. Healthy donor PBMCs were stimulated with CEF peptides for 18 hours. (A) Mean fluorescence intensity of CD25, CD69, and CD137 in IRF4neg, IRF4lo, IRF4int, and IRF4hi CD137+ populations. (B) A representative viSNE analysis of CEF-specific CD8+ T cells (gated on CD8+CD69+ cells). Each point represents a single cell, and different colors represent the intensity of the expression of the molecule. CEF-specific CD8+ T cells (IRF4+CD137+) are indicated by the oval.
IRF4hiCD8+T cells highly express CD25. Healthy donor PBMCs were stimulated with CEF peptides for 18 hours. (A) Mean fluorescence intensity of CD25, CD69, and CD137 in IRF4neg, IRF4lo, IRF4int, and IRF4hi CD137+ populations. (B) A representative viSNE analysis of CEF-specific CD8+ T cells (gated on CD8+CD69+ cells). Each point represents a single cell, and different colors represent the intensity of the expression of the molecule. CEF-specific CD8+ T cells (IRF4+CD137+) are indicated by the oval.
To gain a more comprehensive view of the CEF-specific CD8+ T-cell population, we analyzed the flow data with viSNE, a tool to map high-dimensional cytometry data onto 2 dimensions, yet conserve the high-dimensional structure of the data.29 Figure 5B shows the analysis of the CD69+CD8+ T-cell population. The IRF4+ population largely overlapped with the CD137+ population but was more discrete because of less background. The IRF4+ population was CCR7neg, and thus was largely TEM cells, yet it was heterogeneous with regard to CD25 expression. This population also showed heterogeneity in CD27, a surface molecule required for the generation and long-term maintenance of T cells.30
HIV-specific CD8+ T cells are IRF4lo in chronic HIV+ subjects
Chronic viral infections induce Ag-specific CD8+ T cells with altered phenotype and functions.31,32 In HIV+ subjects, HIV-specific CD8+ T cells exhibit impaired cytolytic function and cytokine expression (eg, IL-2),33 which is due in part to T-cell exhaustion.34,35 Interestingly, previous studies suggested that high-affinity HIV-specific CD8+ T cells were preferentially deleted by apoptosis during acute infection.36,37 Therefore, we examined whether impaired functions of HIV-specific CD8+ T cells might also be associated with suboptimal TCR signal strength. To address this possibility, we used the IRF4-CD137 assay to compare the phenotype and IRF4 expression of HIV-specific CD8+ T cells with CEF-specific CD8+ T cells in chronic HIV+ subjects. To detect polyclonal HIV-specific CD8+ T cells, we used a pool of well-characterized and dominant MHC class I peptides derived from various HIV proteins.32 We were able to find IRF4+CD137+ Ag-specific CD8+ T-cell population in HIV+ subjects (Figure 6A). Of the 10 HIV+ subjects, 8 responded to the HIV peptide pool, and 9 responded to the CEF peptide pool. Strikingly, we found that HIV-specific CD8+ T cells displayed less IRF4 than CEF-specific CD8+ T cells (Figure 6A-B). In the analysis of 13 blood samples from 10 HIV+ subjects who displayed CEF-specific and HIV-specific CD8+ T cells, we found that IRF4 mean fluorescence intensity (MFI), as well as CD137, was significantly lower in HIV-specific CD8+ T cells than in CEF-specific CD8+ T cells (Figure 6B). In viSNE analysis, HIV-specific IRF4+ CD8+ T cells were more scattered than CEF-specific CD8+ T cells, indicating greater heterogeneity (Figure 6C). Although HIV-specific and CEF-specific CD8+ T cells contained a cluster of IRF4+CD137+CD25+ cells (blue arrows), only HIV-specific CD8+ T cells contained a cluster of IRF4+CD137+CD25lo cells (red arrows) (Figure 6C). Previous studies showed high CD27 expression by HIV-specific CD8+ T cells,35 and we found that CD27 was particularly high within the IRF4+CD137+CD25− cell population (Figure 6D). CD25 MFI, as well as the frequency of CD25+ cells, was significantly lower in HIV-specific CD8+ T cells; these observations are consistent with low IRF4 expression (Figure 6D-E). In contrast, CD27 MFI and the frequency of CD27+ cells were significantly higher in HIV-specific CD8+ T cells (Figure 6D,F). Collectively, these results suggest that HIV-specific CD8+ T cells in chronic HIV+ subjects display relatively low TCR affinity with limited CD25 expression and contain a large fraction of CD27+ memory cells.
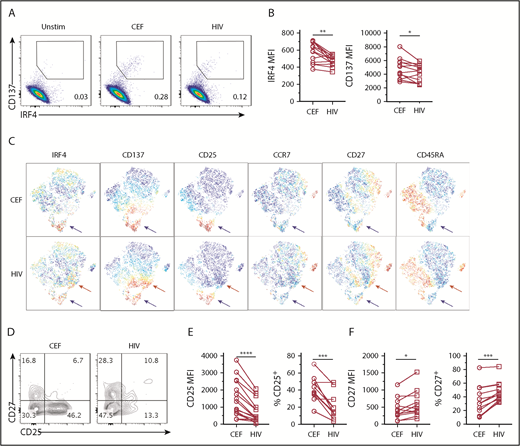
HIV-specific CD8+T cells express low IRF4. PBMCs from HIV+ subjects were stimulated with 1 μg/mL CEF peptides or HIV peptides for 18 hours. (A) Expression of IRF4 and CD137 by CD8+ T cells. (B) MFI of IRF4 and CD137 expression by CD8+ T cells specific for CEF and HIV peptides (n = 13). (C) viSNE analysis showing differential marker expression by CD8+ T cells specific for CEF peptides (upper panels) or HIV peptides (lower panels). A representative result of 13 samples (gated on CD8+CD69+ T cells) is shown. Red arrows indicate a cell population uniquely observed in the HIV-specific CD8+ T cells. Blue arrows indicate a cell population shared between CEF- and HIV-specific CD8+ T cells. (D) CD27 and CD25 expression by IRF4+CD137+ CD8+ T cells in PBMCs stimulated with CEF or HIV peptides. A representative result of 11 samples is shown. (E) MFI of CD25 (left panel) and percentage of CD25+ (right) by IRF4+CD137+ CD8+ T cells in PBMCs stimulated with CEF or HIV peptides (n = 11). (F) MFI of CD27 (left panel) and percentage of CD27+ (right panel) by IRF4+CD137+ CD8+ T cells in PBMCs stimulated with CEF or HIV peptides (n = 11). *P < .05, **P < .01, ***P < .001, ****P < .0001, paired Student t test.
HIV-specific CD8+T cells express low IRF4. PBMCs from HIV+ subjects were stimulated with 1 μg/mL CEF peptides or HIV peptides for 18 hours. (A) Expression of IRF4 and CD137 by CD8+ T cells. (B) MFI of IRF4 and CD137 expression by CD8+ T cells specific for CEF and HIV peptides (n = 13). (C) viSNE analysis showing differential marker expression by CD8+ T cells specific for CEF peptides (upper panels) or HIV peptides (lower panels). A representative result of 13 samples (gated on CD8+CD69+ T cells) is shown. Red arrows indicate a cell population uniquely observed in the HIV-specific CD8+ T cells. Blue arrows indicate a cell population shared between CEF- and HIV-specific CD8+ T cells. (D) CD27 and CD25 expression by IRF4+CD137+ CD8+ T cells in PBMCs stimulated with CEF or HIV peptides. A representative result of 11 samples is shown. (E) MFI of CD25 (left panel) and percentage of CD25+ (right) by IRF4+CD137+ CD8+ T cells in PBMCs stimulated with CEF or HIV peptides (n = 11). (F) MFI of CD27 (left panel) and percentage of CD27+ (right panel) by IRF4+CD137+ CD8+ T cells in PBMCs stimulated with CEF or HIV peptides (n = 11). *P < .05, **P < .01, ***P < .001, ****P < .0001, paired Student t test.
Low IRF4 expression is independent of PD-1
Exhausted HIV-specific CD8+ T cells in HIV+ subjects upregulate PD-1, and the PD-L1–PD-1 axis inhibits T-cell activation, which can be reverted by anti–PD-L1 blocking mAb.35,38 We next examined whether impaired IRF4 expression by HIV-specific CD8+ T cells was due to cell exhaustion. However, there was no difference in PD-1 expression between HIV-specific and CEF-specific CD8+ T cells in our samples (Figure 7A). Furthermore, blocking the PD-L1–PD-1 interaction with PD-L1 blocking mAb did not result in an increase in IRF4 expression (Figure 7B-C) or modify the expression of PD-1, CD25, CD137, or CD27 (supplemental Figure 4B). viSNE analysis did not show any substantial differences between control Ab and anti–PD-L1 treatment (supplemental Figure 4A). Thus, low expression of IRF4 by HIV-specific CD8+ T cells was independent of inhibitory PD-1 signals.

Low IRF4 expression by HIV-specific CD8+T cells was independent of PD-1 signals. (A) PD-1 and CD69 expression by IRF4+CD137+CD8+ T cells in unstimulated, CEF-stimulated, or HIV-stimulated PBMCs. A representative of 7 samples (left panel). PD-1 MFI by CEF- and HIV-specific CD8+ T cells (middle panels). Gated on IRF4+CD137+CD8+ T cells (n = 7). One donor showed high PD-1 by HIV-specific CD8+ T cells (black symbols). (B) PBMCs from HIV+ subjects were treated for 30 minutes with anti–PD-L1 antibody and stimulated with HIV peptides for 18 hours. IRF4/CD137 expression with or without pretreatment with anti–PD-L1. Gated on CD8+ T cells. A representative result from 5 experiments is shown. (C) MFI of IRF4 in HIV-specific CD8+ T cells treated or not with anti–PD-L1. Gated on IRF4+CD137+CD8+ T cells (n = 5). One donor showed high PD-1 by HIV-specific CD8+ T cells (black symbols). NS, not significant (paired Student t test).
Low IRF4 expression by HIV-specific CD8+T cells was independent of PD-1 signals. (A) PD-1 and CD69 expression by IRF4+CD137+CD8+ T cells in unstimulated, CEF-stimulated, or HIV-stimulated PBMCs. A representative of 7 samples (left panel). PD-1 MFI by CEF- and HIV-specific CD8+ T cells (middle panels). Gated on IRF4+CD137+CD8+ T cells (n = 7). One donor showed high PD-1 by HIV-specific CD8+ T cells (black symbols). (B) PBMCs from HIV+ subjects were treated for 30 minutes with anti–PD-L1 antibody and stimulated with HIV peptides for 18 hours. IRF4/CD137 expression with or without pretreatment with anti–PD-L1. Gated on CD8+ T cells. A representative result from 5 experiments is shown. (C) MFI of IRF4 in HIV-specific CD8+ T cells treated or not with anti–PD-L1. Gated on IRF4+CD137+CD8+ T cells (n = 5). One donor showed high PD-1 by HIV-specific CD8+ T cells (black symbols). NS, not significant (paired Student t test).
Discussion
This study describes a novel approach to identify Ag-specific CD8+ T cells in human PBMCs by using IRF4 as a tool to define TCR-activated cells after a short culture with Ags. We showed that the coexpression of IRF4 and CD137 sensitively detects Ag-specific CD8+ T cells with extremely low background. Ex vivo blood CD8+ T cells expressed IRF4 only marginally, but highly upregulated IRF4 upon TCR stimulation, which peaked at 18 hours. Compared with other activation markers (CD69, CD137, and CD25) that are widely used to detect Ag-specific CD8+ T cells in PBMC culture, lower IRF4 expression at baseline offers a clear advantage. Our study revealed that the IRF4-CD137 assay was able to detect Ag-specific CD8+ T cells better than the existing CD137-CD25 assay in terms of sensitivity (frequency captured) and specificity (background). Importantly, the combination of IRF4 and CD137 enabled us to dissociate Ag-specific cells from a background population of preactivated nonspecific CD137+ cells in blood circulation.
We showed the validity of IRF4 for the detection of Ag-specific CD8+ T cells in multiple lines of evidence. First, IRF4 expression was independent of cytokines, because stimulation with cytokines alone did not induce IRF4 upregulation by CD8+ T cells. Second, stimulation with an HLA class I peptide induced IRF4 expression by CD8+ T cells specific for the peptides but not CD4+ T cells. Because blood CD4+ T cells also robustly upregulate IRF4 upon polyclonal activation by SEB (data not shown), lack of IRF4 upregulation by CD4+ T cells upon stimulation with HLA class I peptides further indicates that IRF4 expression was independent of cytokines. Third, upon stimulation with the HLA-A2–restricted Flu-M1 peptide, IRF4 upregulation was limited to tetramer+ CD8+ T cells. Finally, IRF4 expression was abrogated by using the pan-MHC class I mAb to block the interactions between the TCR and the pMHC complex.
An important advantage of IRF4 in the assay is the assessment of the strength of TCR signals in individual cells, which is primarily regulated by TCR affinity against pMHC complexes. IRF4 expression was upregulated by increased amounts of anti-CD3 (Figure 3A), and it was strongly inhibited by pan-MHC class I blocking mAb in a dose-dependent manner in the culture with peptides (Figure 3B). By contrast, the expression of CD137, CD25, and CD69 was far less sensitive to MHC class I blocking. These results suggest that human blood memory CD8+ T cells with high TCR affinity express high levels of IRF4 upon TCR stimulation, an observation consistent with mouse CD8+ T cells.39 The extent of IRF4 upregulation was similar among CD8+ T-cell subsets, including naive, TCM, TEM, and TEMRA cells; therefore, IRF4 can be universally applied to detect Ag-specific CD8+ T cells in any subsets. The TCR signal–IRF4 pathway modulates multiple key aspects of T-cell biology, including differentiation into distinct T-cell subsets,15 effector T-cell functions,14 and memory T-cell differentiation. Thus, TCR signal strength measured by IRF4 expression will serve as a novel and important parameter of Ag-specific T cells in humans.
Another key finding in this study is the positive correlation between CD25 and IRF4 on Ag-specific CD8+ T cells in human blood. Because CD25 expression by Ag-specific CD8+ T cells was far less dependent on the TCR signal strength than IRF4 (Figure 3B), and CD25 expression does not require IRF4,40 our observations highly suggest that human memory CD8+ T cells with high-affinity TCRs exhibit an intrinsic ability to highly express CD25. Therefore, human memory CD8+ T cells with high TCR affinity would be more sensitive to IL-2 signals than would T cells with low TCR affinity. IL-2 signals render CD8+ T cells protection from cell death, and proliferate in the early phases of Ag recognition.41 On the other hand, prolonged activation of the IL-2–CD25 axis promotes the differentiation of CD8+ T cells toward terminal effector cells and cell death42-44 by suppressing the expression of transcription factors Bcl6 and Tcf1, molecules important for long-lived memory cells.42,45 Thus, the fate of high-affinity memory CD8+ T cells (remaining as memory cells or being eliminated after terminal differentiation) would be largely affected by the extent of environmental IL-2.
In line with this notion, we found that HIV-specific CD8+ T cells expressed lower levels of IRF4 and CD25 compared with CEF-specific CD8+ T cells in chronic HIV+ subjects. Low IRF4 expression by HIV-specific CD8+ T cells was not due to the inhibitory PD-L1–PD-1 signals in our samples (Figure 7) and, thus, likely reflects low TCR signals. Our study suggests that impaired HIV-specific CD8+ T-cell function36,46,47 appears to be due, at least in part, to suboptimal TCR signals, as well as impaired responsiveness to IL-2. As discussed earlier, it is possible that high-affinity HIV-specific CD8+ T cells expressed high levels of CD25 and that prolonged IL-2 signals promoted their terminal differentiation and cell death during acute infection.36,37 This might have caused preferential retention of low-affinity HIV-specific CD8+ T cells. Alternatively, chronic HIV infection might induce preferential expansion of low-affinity HIV-specific CD8+ T-cell clones, which tend to differentiate into less mature effector cells with limited cytotoxicity. This hypothesis is supported by the observation that HIV-specific CD8+ T cells contained a high frequency of CD27+ cells, which show high proliferative and low apoptosis profiles.48
Collectively, the IRF4-CD137 assay is a sensitive and robust assay to determine the TCR signal strength of Ag-specific CD8+ T cells in human blood samples. The IRF4-CD137 assay is highly applicable to clinical and basic studies in humans and would provide important insights into vaccine designs, tumor immunology, and infectious diseases.
The full-text version of this article contains a data supplement.
Acknowledgments
The authors thank the members at the Flow Cytometry Core at Icahn School of Medicine at Mount Sinai, Benjamin Chen’s laboratory, Judith Aberg and Anna Paoline Marie for the HIV+ patient PBMC samples, Susan Zolla-Pazner’s laboratory and Alisa Fox for use of the BD LSRFortessa, and Thomas Moran for the anti-CD3 antibody.
The work was supported by the National Institutes of Health, National Institute of Allergy and Infectious Diseases grant U19-AI082715 and the seed fund provided by the Department of Microbiology, Icahn School of Medicine at Mount Sinai (H.U.).
Authorship
Contribution: H.U. conceived the study; H.W. and A.W. isolated the PBMCs from buffy coats; H.W. and H.U. designed the experiments and wrote the manuscript; and H.W. performed all of the experiments and analyzed data.
Conflict-of-interest disclosure: The authors declare no competing financial interests.
Correspondence: Hideki Ueno, Department of Microbiology, Global Health and Emerging Pathogens Institute, Icahn School of Medicine at Mount Sinai, 1468 Madison Ave, Box 1124, Annenberg Building, Room 15-14A, New York, NY 10029; e-mail: hideki.ueno@mssm.edu.

