

Key Points
Cutaneous GVHD lesions are stable, suggesting they are maintained locally.
Donor CD8 cells make cognate interactions with CD11c+ cells in the skin, including those that do not express Langerin.

Abstract
Graft-versus-host disease (GVHD) is a major cause of morbidity and mortality in allogeneic hematopoietic stem cell transplantation (alloSCT). By static microscopy, cutaneous GVHD lesions contain a mix of T cells and myeloid cells. We used 2-photon intravital microscopy to investigate the dynamics of CD4+ and CD8+ T cells and donor dendritic cells (DCs) in cutaneous GVHD lesions in an MHC-matched, multiple minor histocompatibility antigen-mismatched (miHA) model. The majority of CD4 and CD8 cells were stationary, and few cells entered and stopped or were stopped and left the imaged volumes. CD8 cells made TCR:MHCI-dependent interactions with CD11c+ cells, as measured by the durations that CD8 cells contacted MHCI+ vs MHCI− DCs. The acute deletion of Langerin+CD103+ DCs, which were relatively rare, did not affect CD8 cell motility and DC contact times, indicating that Langerin−CD103− DCs provide stop signals to CD8 cells. CD4 cells, in contrast, had similar contact durations with MHCII+ and MHCII− DCs. However, CD4 motility rapidly increased after the infusion of an MHCII-blocking antibody, indicating that TCR signaling actively suppressed CD4 movements. Many CD4 cells still were stationary after anti-MHCII antibody infusion, suggesting CD4 cell heterogeneity within the lesion. These data support a model of local GVHD maintenance within target tissues.
Introduction
Allogeneic hematopoietic stem cell transplantation (alloSCT) can be a curative therapy for malignant and nonmalignant hematopoietic disorders. Much of the efficacy of alloSCT is attributable to donor αβT cells, which promote engraftment and immune reconstitution. Importantly, alloreactive donor T cells can attack neoplastic cells, mediating the graft-versus-leukemia (GVL) effect.1,2 However, alloreactive T cells also attack normal cells causing graft-versus-host disease (GVHD).3-5
A central goal of alloSCT research has been to develop methods to minimize GVHD while preserving T-cell-mediated GVL and immune reconstitution. Toward this end, substantial research has been devoted toward understanding how donor alloreactive T cells are activated, migrate to tissues, and mediate end organ damage.5-19 These studies support a model in which T cells are largely, but not exclusively, activated in secondary lymphoid tissues by both host and donor-derived antigen-presenting cells (APCs),10,20,21 and migrate into host tissues in a chemokine-receptor-dependent fashion. Once in tissues, CD8 cells require TCR:MHCI contacts with target tissues to cause tissue damage, whereas CD4 cells do not.15,22
Gene-deficient mice and blocking antibodies have revealed much about GVHD pathobiology. The effect of a reagent or gene deletion typically is measured by clinical parameters, the numbers and phenotypes of extracted T cells, and immunohistology. However, immune responses are dynamic processes composed of motile cells. Standard approaches do not capture cell movements. Therefore, key aspects of GVHD biology remain uninvestigated: GVHD lesion stability, rates of influx of new T cells, and the nature of T cell:APC interactions. An underlying hypothesis of our studies was that because GVHD lesions contain T cells, APCs, and limitless alloantigen, they could at least in part be sustained locally. To address these questions, we applied 2-photon intravital microscopy (2PIM) to study cutaneous GVHD.
Materials and methods
Mice
129S1/SVlmJ mice (129) were purchased from the NCI Frederick or the Jackson Labs (JAX). C57Bl/6 mice (B6) were purchased from Harlan Laboratories. B6 CD11c-EYFP transgenic mice expressing eYFP driven by a CD11c promoter (CD11c-YFP) were a gift of Michelle Nussenzweig23 (Rockefeller University). muLangerin-DTR-EGFP24 were used with permission of Bernard Malissen (Centre d’immunologie de Marseille-Luminy). CD11c-DTR mice were from Dan Littman (New York University). β-2 microglobulin-deficient mice (β2M−/−); B6.129P2-B2mtm1Unc/J), dsRed transgenic (RFP; CAG-DsRed*MST)1Nagy/J) and MHCII− (IAb/IE−/−; B6.129S2-H2dlAb1-Ea/J) were from JAX.
Bone marrow transplantation
All transplants were performed according to protocols approved by the Yale University or University of Pittsburgh Institutional Animal Care and Use committees. Irradiated 8- to 12-week 129 mice (1000 cGy) were reconstituted with 5 × 10⁶ BM cells from the indicated B6 background mice with no T cells or with 5 × 10⁵ B6 CD4 cells and 1 to 1.5 × 10⁶ B6 CD8 cells, with either CD4 or CD8 cells from RFP mice. GVHD mortality was typically 40% to 50% by day 21. Surviving mice were imaged between days 28 and 35. In experiments with β2M−/− donor cells, hosts were treated with anti-NK1.1 (200 μg; PK136; laboratory-prepared) on days −2 and −1 to prevent NK cell-mediated rejection.25,26 In experiments with muLangerin-DTRxCD11c-YFP or CD11c-YFPxCD11c-DTR BM, mice were injected IV with 4 ng/g diphtheria toxin (Sigma Aldrich) 48 and 24 hours before imaging.
Cell purifications
CD4+ and CD8+ cells were purified from lymph node cells, using EasySep kits (StemCell Technologies), and were more than 85% pure with less than 5% contamination with the depleted T-cell population. BM T-cell-depletion was done with EasySep kits.
2PIM imaging
Imaging was performed with an upright laser-scanning microscope (La Vision BioTec) with excitation by a Coherent Chameleon Vision II Titanium-Sapphire femtosecond pulsed laser tuned at 900 to 980 nm. Images were collected from 21z-steps spaced 3 μm apart every 30 seconds for up to 4 hours, encompassing a 500 × 500 × 60 μm volume. Mice were anesthetized and ears were treated with hair remover cream. A cover slip, onto which was glued a metal ring, was placed on the ear. The ring was filled with water to immerse an Olympus 20×/0.95NA-dipping objective. For MHCII-blocking experiments, mice were imaged for 1 hour, followed by intraperitoneal injection of 2 mg αMHCII-blocking Ab27 (clone Y3P; laboratory-prepared) or immunoglobulin G2a isotype control (2B8; clone BioXCell) while continuously imaging.
Statistical analysis
Differences in pathology were determined by the Mann-Whitney U test. Significance of weight loss and comparisons of T-cell speeds, sphericity, and displacements were done with an unpaired Student t test. Distributions of T cell:APC contact times were compared using χ2 (GraphPad Prism).
Results
Model system
Our studies used the B6 (H-2b)→129 (H-2b) MHC-matched, multiple minor histocompatibility antigen (miHA)-mismatched system, akin to most human alloSCTs. Because donor and recipient share the MHC type, TCRs on alloreactive T cells can engage miHAs presented by donor or host APCs. GVHD was manifest by death, weight loss, and histopathologic GVHD (supplemental Figure 1).
To image skin-infiltrating T cells and tissue DCs (t-DCs), irradiated 129 mice were reconstituted with BM from B6 CD11c-YFP transgenic mice.23 GVHD was induced by a mix of B6 CD4 and CD8 cells, with one or the other from RFP donors. Immunofluorescence of the ear revealed infiltration by RFP+ T cells and CD11c+ cells near the dermoepidermal junction (supplemental Figure 2). Flow cytometry of digested ears failed to detect a significant fraction of CD4+ FoxP3+ cells, indicating that nearly all CD4 cells were conventional effectors (supplemental Figure 2D). YFP+ cells were uniformly MHCII+ by flow cytometry, indicating that YFP+ cells imaged were nearly all DCs (supplemental Figure 2E). We began imaging at day +28, a time when GVHD was established. CD11c-YFP+ DCs formed a network that prevented identification of individual YFP+ cells. We therefore used Imaris to transform the YFP+ volume into a 3D surface and to fit spheres into RFP+ T cells to calculate the shortest distance from each T cell to the DC surface at each scan. A T cell was considered stationary if it had a speed of less than 5 μm/min and as being in contact with a DC if the distance from T-cell centroid to the edge of DC surface was 2 μm or less.28 By 2PIM, the locations of the DC/T-cell infiltrates can be inferred by the second harmonic signals, which visualize the collagen network in the dermis (supplemental Figure 3; supplemental Videos 21-22). Gaps in the network are the locations of hair follicles.
T-cell dynamics
CD11c+ and CD4 cell dynamics were analyzed in 6 one-hour videos from 6 mice. The striking initial observation was that a large fraction of CD4 cells were stationary for the entire 60 minutes (Figure 1A; supplemental Video 1), confirmed by their low mean speeds (track length/time) and displacements (Figure 1B). Nonetheless, within each volume were CD4 cells with long track lengths and mean speeds 3 to 5 times that of the population mean, confirming that low speeds were not a result of poor tissue viability (Figure 1B-C). There was heterogeneity in CD4 cell motility among mice, with low and high CD4 velocities in mice 5 and 6, respectively. To better visualize the behaviors of CD4 cells, we plotted each CD4 cell’s mean speed, mean distance to the DC surface, and total displacement (Figure 1D), which confirmed that the majority of T cells were essentially stationary, and that many were in close proximity to CD11c+ cells.

CD4 cell dynamics. Irradiated 129 mice were reconstituted with B6 CD11c-YFP BM, B6 RFP+ CD4 cells, and unlabeled B6 CD8 cells. Ears were imaged ∼28 days after transplantation. (A) Image from a representative video (supplemental Video 1). Mean speeds and displacements for tracked cells are shown in panel B. Each symbol is a unique tracked CD4 cell. (C) Representative tracking from a single video with the starting point of each CD4 cell at the origin. Color denotes time. (D) The mean speed, distance to the YFP surface, and displacement were calculated for each cell in 6 videos (color coded). (E) Average CD4 cell behaviors from 6 videos, represented in a 100-circle plot. “Stable” indicates an instantaneous velocity of less than 5 μm/minute. “In contact” indicates a distance 2 μm or less from the DC surface. “Black space” indicates a distance more than 2 μm from DC surface.
CD4 cell dynamics. Irradiated 129 mice were reconstituted with B6 CD11c-YFP BM, B6 RFP+ CD4 cells, and unlabeled B6 CD8 cells. Ears were imaged ∼28 days after transplantation. (A) Image from a representative video (supplemental Video 1). Mean speeds and displacements for tracked cells are shown in panel B. Each symbol is a unique tracked CD4 cell. (C) Representative tracking from a single video with the starting point of each CD4 cell at the origin. Color denotes time. (D) The mean speed, distance to the YFP surface, and displacement were calculated for each cell in 6 videos (color coded). (E) Average CD4 cell behaviors from 6 videos, represented in a 100-circle plot. “Stable” indicates an instantaneous velocity of less than 5 μm/minute. “In contact” indicates a distance 2 μm or less from the DC surface. “Black space” indicates a distance more than 2 μm from DC surface.
We also analyzed the influx and efflux of CD4 cells (Figure 1E). Forty-one of 692 tracked CD4 cells (6% of imaged CD4 cells; range from individual videos, 4.5%-17%) entered the volumes during imaging. Of these, 10 stopped (see supplemental Methods for cell movement definitions) for at least 10 minutes, representing 1.4% of total CD4 cells (range, 0%-1.8%) and 25% of CD4 cells that entered the volume (range, 0%-43%). Seven were 2 μm or less and 3 were more than 2 μm from the DC surface. Conversely, 42 CD4 cells that were in the volume at the start of imaging left (6% of total CD4 cells; range, 0%-10%). Of these, approximately 34 had been stable for at least 10 minutes before leaving (4.9% of total CD4 cells; range, 3.1%-9.2%). Fifty percent of all tracked CD4 cells in the imaged volumes were stationary, and 42% and 8% were 2 μm or less or were more than 2 μm from the YFP surface, respectively. We enumerated CD4 cells at the beginning and end of imaging and expressed these as a percentage of the total number of unique CD4 cells identified during the entire video. Differences ranged from −6.4% to +7.8%, with an average gain of 2.24%, indicating a stable T-cell content.
CD8+ T-cell dynamics were analyzed in 3 one-hour videos from 3 mice. As with CD4 cells, many CD8 cells had low speeds and displacements (Figure 2 A-B; supplemental Video 2). Importantly, there were motile cells in each volume, confirming tissue viability (Figure 2A-C). CD8 cells mostly had low displacements and speeds, and were clustered close to the YFP surface (Figure 2D).

CD8 cell dynamics. Irradiated 129 mice were reconstituted with B6 CD11c-YFP BM, B6 RFP+ CD8 cells, and unlabeled B6 CD4 cells. Ears were imaged ∼28 days after transplantation. (A) Image from a representative video (supplemental Video 2). Mean speeds and displacements for tracked cells are shown in panel B. Each symbol is a unique tracked CD8 cell. (C) Representative tracking from a single video with the starting point of each CD8 cell at the origin. Color denotes time. (D) Mean speed, distance to the YFP surface, and displacement were calculated for each cell in 3 videos (color coded). (E) Average CD8 cell behaviors from 3 videos, represented in a 100-circle plot.
CD8 cell dynamics. Irradiated 129 mice were reconstituted with B6 CD11c-YFP BM, B6 RFP+ CD8 cells, and unlabeled B6 CD4 cells. Ears were imaged ∼28 days after transplantation. (A) Image from a representative video (supplemental Video 2). Mean speeds and displacements for tracked cells are shown in panel B. Each symbol is a unique tracked CD8 cell. (C) Representative tracking from a single video with the starting point of each CD8 cell at the origin. Color denotes time. (D) Mean speed, distance to the YFP surface, and displacement were calculated for each cell in 3 videos (color coded). (E) Average CD8 cell behaviors from 3 videos, represented in a 100-circle plot.
We also analyzed the influx and efflux of CD8 cells (Figure 2E). Twenty-two of 365 tracked CD8 cells entered the volume during imaging (6% of lesional CD8 cells; range, 0%-9%). Of these, 12 (3.2% of total CD8 cells; range, 0%-18%) stopped for at least 10 minutes, representing 3.2% of total lesional CD8 cells but 55% (range, 20%-64%) of entering CD8 cells. Five were 2 μm or less and 7 were more than 2 μm from the DC surface. Conversely, 12 CD8 cells (3.2% of all CD8 cells; range, 1.75%-8%) that were present at the start of imaging left. Of these, approximately 7 (1.9% of total lesional CD8 cells) were stable for at least 10 minutes before leaving. To put the rates of influx and efflux into context, 45% and 17% of CD8 cells in the imaged volumes were stationary, at 2 μm or less or more than 2 μm from the YFP surface, respectively. We enumerated CD8 cells at the beginning and end of imaging and expressed these as a percentage of the total number of unique CD8 cells identified during the entire video. The differences ranged from −5.8% to +3.3%, with an average gain of 0.27%, indicating a stable CD8 cell content.
Approximately 18% of CD8 cells and 9% of CD4 were stable and more than 2 μm from the YFP surface (in “black space”). Such cells could have been in contact with MHCI+ or MHCII+ nonhematopoietic cells or CD11c− hematopoietic cells. That the percentage of CD8 cells stable in black space was twice that of CD4 cells is consistent with their interacting with nonhematopoietic cells, which are more likely to express MHCI than MHCII.
CD8 cell interactions with t-DCs
The close proximity of CD8 cells to CD11c+ cells suggested the possibility of TCR:MHCI cognate interactions between the 2 cell types. To test this, we used 2PIM to compare CD8 cell interactions with CD11c+YFP+ cells that were either MHCI+ or MHCI− (β2M−/−). One approach would have been to compare CD8 cell interactions with DCs in mice transplanted with BM from CD11c-YFP or CD11c-YFP/β2M−/− mice. However, we were concerned that recipients of β2M−/− BM would develop less severe cutaneous GVHD.13,29 Therefore, mice were transplanted with RFP+ CD8 cells, unlabeled CD4 cells, and a 1:1 mix of B6 CD11c-YFP/β2M−/− BM and wt B6 BM or B6 CD11c-YFP BM and B6 β2M−/− BM (Figure 3A). Mice developed clinical GVHD manifest by weight loss and death. Paralleling the clinical data, the ear lesions observed by 2PIM were similar in character to those that developed when all donor BM cells were MHCI+ (Figure 3B; supplemental Videos 3-6). CD8 cells had shorter interactions with β2M−/−YFP+ cells than with wt YFP+ cells, and conversely, a higher fraction of CD8 cells were in contact with MHCI+ YFP+ cells than β2M−/− YFP+ cells (Figure 3B-C). A greater fraction of CD8 cells that ever contacted the DC surface stayed in contact with MHCI+ DCs for at least 30 continuous minutes than with β2M−/− DCs (Figure 3D). Some CD8 cells were stationary in close proximity to CD11c+β2M−/− cells. CD11c+β2M−/− cells were likely intertwined with nonvisualized wt MHCI+ hematopoietic cells (supplemental Figure 4), and these CD8 cells may have been in MHCI-dependent contact with them or with host MHCI+ nonhematopoietic cells. It is also possible that residual hematopoietic host MHCI+ cells could contribute to CD8+ T-cell stability, although it is likely that the majority of hematopoietic cells were donor in origin.

CD8 cells make TCR:MHCI-dependent interactions with CD11c+ donor hematopoietic cells. (A) Experimental design. Irradiated 129 mice were reconstituted with B6 RFP+ CD8 cells, unlabeled B6 CD4 cells, and 1:1 mix of CD11c-YFP/β2M−/− BM and wt B6 BM or CD11c-YFP BM and B6 β2M−/− BM. (B) Representative images from videos with wt (left column) or β2M−/− (right column) CD11c-YFP BM. The upper row depicts original videos; the lower row has been rendered to show the YFP+ surface (blue) with red spheres fit into CD8 cells (supplemental Videos 3-6). (C) Cumulative interaction times between CD8 cells and the YFP+ surface of CD8 cells that ever contact the YFP surface. P = .0001 comparing contacts with wt and β2M−/− YFP+ cells in panel B. (D) Percentage of CD8 cells that ever have contacted the YFP+ surface that stayed in continuous contact for at least 30 minutes. P = .0064.
CD8 cells make TCR:MHCI-dependent interactions with CD11c+ donor hematopoietic cells. (A) Experimental design. Irradiated 129 mice were reconstituted with B6 RFP+ CD8 cells, unlabeled B6 CD4 cells, and 1:1 mix of CD11c-YFP/β2M−/− BM and wt B6 BM or CD11c-YFP BM and B6 β2M−/− BM. (B) Representative images from videos with wt (left column) or β2M−/− (right column) CD11c-YFP BM. The upper row depicts original videos; the lower row has been rendered to show the YFP+ surface (blue) with red spheres fit into CD8 cells (supplemental Videos 3-6). (C) Cumulative interaction times between CD8 cells and the YFP+ surface of CD8 cells that ever contact the YFP surface. P = .0001 comparing contacts with wt and β2M−/− YFP+ cells in panel B. (D) Percentage of CD8 cells that ever have contacted the YFP+ surface that stayed in continuous contact for at least 30 minutes. P = .0064.
Prior work suggests that CD103+Langerin+ DCs are uniquely capable of cross-priming CD8 cells reactive against cutaneous antigens.30 This subset comprises approximately 10% of dermal DCs in ear GVHD lesions (Figure 4A). The high proportion of CD8 cells in contact with CD11c+ cells suggested that cells other than CD11c+CD103+Langerin+ DCs were capable of delivering stop signals to donor CD8 cells, presumably by cross-presenting host miHAs. To study the role of Langerin+ t-DCs, GVHD was induced by RFP+ CD8 cells and unlabeled CD4 cells with F1(CD11c-YFPxmuLangerin-DTR) donor BM. When GVHD was established, mice were injected with diphtheria toxin (DT) 48 and 24 hours before imaging to selectively delete muLangerin-expressing cells (Figure 4B; supplemental Videos 7-8). Deletion of CD103+YFP+MHCII+ cells was confirmed in a separate cohort by flow cytometry (Figure 4A). The durations of CD8 cell contacts with CD11c+ cells were similar with and without depletion of muLangerin+ cells (Figure 4C-D). Taken together with results comparing CD8 cell interactions with MHCI+ and MHCI−CD11c+ cells, these data indicate that donor cutaneous CD11c+muLangerin−CD103− cells can deliver stop signals to donor CD8 cells.
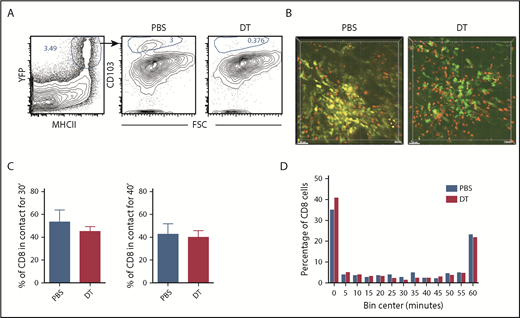
muLangerin-CD11c+ cells make stable interactions with CD8 cells. Irradiated 129 mice were reconstituted with B6 F1(muLangerin-DTRxCD11c-YFP) BM, RFP+ CD8 cells and unlabeled CD4 cells. Approximately 28 days after bone marrow transplantation, mice were treated with PBS or with DT. Mice were imaged 48 hours later. (A) Representative flow cytometry of digested skin, which demonstrates the depletion of CD103+MHCII+CD11c+ cells after DT treatment. (B) Still images from representative videos in PBS (left panel; supplemental Video 7) or DT (right panel; supplemental Video 8). The percentage of CD8 cells in continuous contact with YFP+ cells for at least 30’ or 40’ are shown in panel C. P = .26 comparing PBS and DT-treated groups. (D) Cumulative contact durations between CD8 cells and CD11c+ cells (of CD8 cells that ever contact the DC surface). P = .54.
muLangerin-CD11c+ cells make stable interactions with CD8 cells. Irradiated 129 mice were reconstituted with B6 F1(muLangerin-DTRxCD11c-YFP) BM, RFP+ CD8 cells and unlabeled CD4 cells. Approximately 28 days after bone marrow transplantation, mice were treated with PBS or with DT. Mice were imaged 48 hours later. (A) Representative flow cytometry of digested skin, which demonstrates the depletion of CD103+MHCII+CD11c+ cells after DT treatment. (B) Still images from representative videos in PBS (left panel; supplemental Video 7) or DT (right panel; supplemental Video 8). The percentage of CD8 cells in continuous contact with YFP+ cells for at least 30’ or 40’ are shown in panel C. P = .26 comparing PBS and DT-treated groups. (D) Cumulative contact durations between CD8 cells and CD11c+ cells (of CD8 cells that ever contact the DC surface). P = .54.
CD4 cell interactions with MHCII+ cells
To determine whether CD4 cell stability was driven by MHCII+ DCs, we took a similar approach, as was taken to study CD8 interactions with DCs, except with RFP+ CD4 cells, unlabeled CD8 cells, and CD11c-YFP/MHCII−/− BM. However, there was not a significant difference in interaction times between donor CD4 cells and MHCII+ or MHCII− YFP+ cells (Figure 5A).
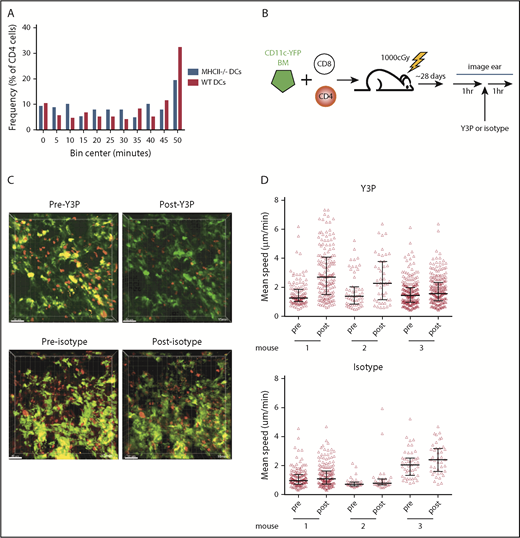
CD4 stability is dependent on TCR:MHCII contacts. Irradiated 129 mice were reconstituted with B6 RFP+ CD4 cells, unlabeled B6 CD8 cells, and 1:1 mix of CD11c-YFP/MHCII−/− BM and wt B6 BM or CD11c-YFP BM and B6 MHCII−/− BM. Shown in panel A are cumulative interaction times between CD4 cells and the YFP+ surface (of CD4 cells that ever contact the YFP surface). P = .67 comparing interactions between CD4 cells and wt or MHCII−/− DCs. (B-C) In vivo treatment with an anti-MHCII mAb (Y3P) increased CD4 cell speeds. (B) Experimental design. (C) Representative images from videos of an ear pre- and posttreatment with Y3P or isotype (supplemental Videos 9-12). (D) Mean CD4 speeds pre- and posttreatment with Y3P (upper panel) or isotype (lower panel). P ≤ .005 comparing speeds before and after Y3P for each mouse. P ≥ .09 comparing speeds before and after isotype antibody treatment of each mouse.
CD4 stability is dependent on TCR:MHCII contacts. Irradiated 129 mice were reconstituted with B6 RFP+ CD4 cells, unlabeled B6 CD8 cells, and 1:1 mix of CD11c-YFP/MHCII−/− BM and wt B6 BM or CD11c-YFP BM and B6 MHCII−/− BM. Shown in panel A are cumulative interaction times between CD4 cells and the YFP+ surface (of CD4 cells that ever contact the YFP surface). P = .67 comparing interactions between CD4 cells and wt or MHCII−/− DCs. (B-C) In vivo treatment with an anti-MHCII mAb (Y3P) increased CD4 cell speeds. (B) Experimental design. (C) Representative images from videos of an ear pre- and posttreatment with Y3P or isotype (supplemental Videos 9-12). (D) Mean CD4 speeds pre- and posttreatment with Y3P (upper panel) or isotype (lower panel). P ≤ .005 comparing speeds before and after Y3P for each mouse. P ≥ .09 comparing speeds before and after isotype antibody treatment of each mouse.
We took a second complementary approach for addressing whether TCR:MHCII interactions contributed to CD4 cells being stationary. We determined whether the injection of an anti-MHCII blocking antibody (clone Y3P), previously shown to induce CD4 motility in vivo in lymph node,27 would increase speeds of CD4 cells in cutaneous GVHD lesions. Mice were transplanted as in Figure 1. Approximately 28 days posttransplant, ears were imaged for 1 hour, followed by injection of Y3P or an isotype control, with continued imaging of the same volume for at least 1 hour (Figure 5B). Injection of Y3P, but not control IgG, increased the mean speeds of CD4 cells (Figure 5C-D; supplemental Videos 9-12), although some CD4 cells still had low speeds.
Acute depletion of CD11c+ cells
The shorter interactions between CD8 cells and β2M−/− compared with MHCI+ CD11c+ cells demonstrate that CD8 cells make TCR:MHCI-dependent contacts that induce at least transient stopping. However, these data do not indicate how much of the stationary behavior of CD8 cells is dependent on CD11c+ cells. To try to address this, we transplanted 129 mice with BM from B6 F1(CD11c-YFPxCD11c-DTR) mice, wt B6 CD4 cells, and B6 RFP+ CD8 cells. After GVHD developed, 3 mice were imaged before and after DT. Because mice were sick and we were concerned that mice would only survive 1 imaging procedure, 3 phosphate-buffered saline (PBS)-treated mice and an additional 2 DT-treated mice were also imaged. Data from these mice were grouped with the “pre” and “post” groups, respectively (Figure 6A; supplemental Videos 13-14). Data from all individual mice are shown in supplemental Figure 5. We imaged shortly after DC ablation to minimize the potential effect of systemic donor DC depletion.13,29 Despite efficient DC depletion, RFP+ cells were visible in patterns similar to what was observed before DC depletion. The mean speeds of CD8 cells were the same before and after DC depletion, whereas displacements were modestly decreased after ablation (Figure 6B-C). There was also a small but significant decrease in sphericity in DT-treated mice. Because prolonged DT treatment depletes DCs throughout the animal, we could not assess whether local t-DC depletion would affect GVHD pathology.
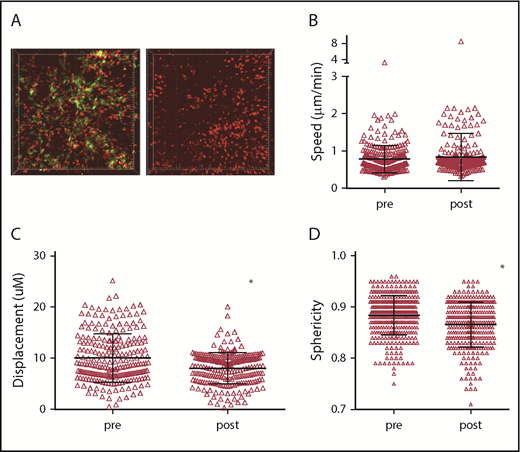
Acute depletion of DCs does not increase CD8 T-cell motility. Irradiated 129 mice were reconstituted with BM from B6 F1(CD11c-YFPxCD11c-DTR) mice, wt B6 CD4 cells and B6 RFP+ CD8 cells. Approximately 28 days after bone marrow transplantation, mice were treated with PBS or with DT 48 and 24 hours before imaging. (A) Still images from representative videos before DT (left panel; supplemental Video 13) or after DT (right panel; supplemental Video 14). CD8+ T-cell mean speeds (B), displacements (C), and sphericity (D) before and after DT treatment. *P < .0001.
Acute depletion of DCs does not increase CD8 T-cell motility. Irradiated 129 mice were reconstituted with BM from B6 F1(CD11c-YFPxCD11c-DTR) mice, wt B6 CD4 cells and B6 RFP+ CD8 cells. Approximately 28 days after bone marrow transplantation, mice were treated with PBS or with DT 48 and 24 hours before imaging. (A) Still images from representative videos before DT (left panel; supplemental Video 13) or after DT (right panel; supplemental Video 14). CD8+ T-cell mean speeds (B), displacements (C), and sphericity (D) before and after DT treatment. *P < .0001.
Infusion of dsRed+ OT-1 effectors
T cells in cutaneous GVHD lesions can have low speeds because of cognate TCR:MHC-target peptide recognition; alternatively, tissue T cells could be stationary for other reasons, as may be the case with tissue resident memory T cells.31 To determine whether newly arrived effector T cells in cutaneous GVHD can have low speeds independent of cognate TCR:MHC interactions, we introduced into mice with GVHD nonalloreactive T-cell effectors and compared their movements with those of surrounding T cells from the initial transplant. Irradiated 129 mice were reconstituted with B6 CFP transgenic CD4 and CD8 cells and B6 CD11c-YFP BM cells. At around day 28, mice were injected IV with dsRed+RAG1−/−CD8+ OT-1 effectors, which recognize the OVA-derived SIINFEKL peptide bound to Kb. Ears were imaged by 2PIM the following day. Lesions were densely infiltrated by CFP+ and YFP+ cells; small numbers of dsRed+ OT-1 cells could be identified (Figure 7). We compared the movements of dsRed cells to surrounding CFP+ cells (supplemental Videos 15-20). Some OT-1 remained stationary with very low velocities, whereas others had higher speeds, demonstrating that static behavior is not solely driven by cognate TCR:MHCI-peptide interactions.
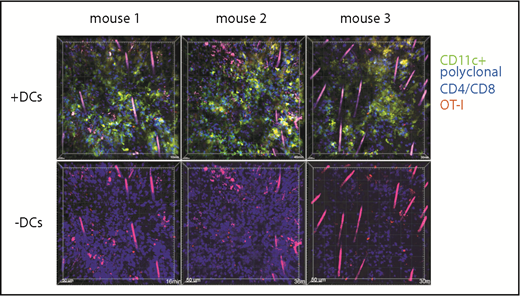
OT-1 effector motility in GVHD skin lesions. One hundred twenty-nine mice were irradiated and transplanted with B6 CD11c-YFP BM and CFP+ B6 CD4 and CD8 cells. On day 28, mice were injected with DsRed+ OT-1 effectors and imaged by 2PIM the following day. Each column shows images from a single mouse. In images in the second row, the YFP channel is masked to better visualize the dsRed+ OT-1 (supplemental Videos 15-20).
OT-1 effector motility in GVHD skin lesions. One hundred twenty-nine mice were irradiated and transplanted with B6 CD11c-YFP BM and CFP+ B6 CD4 and CD8 cells. On day 28, mice were injected with DsRed+ OT-1 effectors and imaged by 2PIM the following day. Each column shows images from a single mouse. In images in the second row, the YFP channel is masked to better visualize the dsRed+ OT-1 (supplemental Videos 15-20).
Discussion
Here we describe for the first time the dynamics of T cells and CD11c+ cells in GVHD lesions in living mice. Our results have important implications as to the mechanisms of tissue injury and GVHD maintenance.
A striking initial observation was that a large fraction of CD4 and CD8 cells were stationary. Such stationary behavior by effector T cells can be a result of engagement of their TCRs by cognate peptide:MHC complexes. T-cell motilities in experiments with in vivo administration of an anti-MHCII mAb or with β2M−/− donor BM further support the idea that at least some of these stationary T cells were driven to be so by cognate antigen encounters, whereas stationary OT-1 cells observed in GVHD lesions demonstrate that stopping behaviors need not be antigen-driven.
Few T cells entered or left imaged volumes. Rates of influx and efflux ranged from 0% to 17% and 0% to 10% of lesional CD4 or CD8 cells per hour, respectively. Net changes in T-cell numbers ranged from +3 to −13 CD4 cells and +11 to −2 CD8 cells per hour, in line with the change in total lesional T cells, calculated by enumerating discreet T cells at the beginning and end of imaging, indicating that few T cells became “unobserved” as a result of death. More striking were the very small numbers of T cells that entered and stopped or were stopped and left the imaged volume, again arguing for surprising lesion stability. In fact, 1 of 3 CD8 lesions and 2 of 6 CD4 lesions had no such cells. We arbitrarily used a conservative 10 minutes as a threshold for a cell being scored as having been “stopped,” which likely overestimates the number of T cells that entered and stopped, given that many T cells are stationary for far longer than 10 minutes and up to 60 minutes, which was the duration of imaging.
These data are a starting point for considering the dynamics and maintenance of GVHD lesions. The dominant picture was one of stable lesions with a low rate of T-cell turnover, which suggests that cutaneous GVHD lesions can at least in part be maintained locally. This is consistent with the success of topical treatment of early-stage cutaneous GVHD. We observed a range in rates of T-cell influx and efflux in individual lesions. The differences could be variations that would equalize with longer periods of observation, or this heterogeneity could reflect GVHD lesions of distinct character, perhaps at different stages of development. It would be interesting to image the initiation and establishment of GVHD lesions. However, such a project would require the imaging of the same regions of skin in many mice sequentially over time, which is not feasible in mice with GVHD.
Another goal of our work was to determine whether T cells make cognate interactions with t-DCs. The expression of CD11c alone is insufficient to define an APC as belonging to the DC lineage, as many of these cells are monocyte-derived.32-34 Regardless of ontogeny, pre-DC and monocyte-derived CD11c+ cells share the ability to present antigen to T cells. The comparison of interaction times between CD8 cells and β2M−/− vs wild type DCs demonstrates that infiltrating CD8 cells make MHCI-dependent DC contacts, which suggests those DCs were cross-presenting host miHAs. In this regard, it is notable that CD8 cells were in stable contact with Langerin−CD11c+ cells and not only Langerin+ DCs, which have been shown to be the key DC subset capable of cross-presenting cutaneous antigens in skin-draining lymph nodes.35 One explanation could be that Langerin− DCs can cross-present, but inefficiently migrate to draining LNs. Alternatively or in addition, they may cross-present sufficiently to engage effector CD8 cells in tissues, but insufficiently to activate naive T cells ex vivo, which was the readout in prior studies.35 Langerin− DCs may not be capable of classical cross-presentation, but could instead be “cross-dressed” with MHCI-host peptide complexes derived from other cells.13,36,37 However, this seems unlikely to fully account for our observations, given the large difference in CD8 interactions with MHCI+ DCs as compared with MHCI− DCs, as the latter could have been cross-dressed with MHCI-peptide complexes.
It remains to be determined how tissue T cell:DC interactions affect GVHD locally. That acutely ablating DCs did not lead to rapid dissolution of GVHD lesions and an increase in CD8+ T-cell motility indicates that sessile CD8 behaviors do not require constant interactions with DCs. In the absence of DCs, CD8 cells that were previously making cognate contact could have turned to contact MHCI on other cells and/or been in a state such that interruption of TCR signaling does not increase motility within the time frame we imaged. The low speeds of some OT-1 effectors (Figure 7; supplemental Videos 15-20) is consistent with this. We also do not know the effect that DT-induced DC apoptosis may have had. We only studied short-term donor DC depletion, given that donor DCs can cross-prime donor CD8 cells.13,29 Ideally, we would have specifically deleted cutaneous DCs for a more prolonged period without affecting DCs elsewhere, but such an approach is not available.
Despite the DC ablation results, that DCs are recruited and that CD8 cells make cognate interactions with DCs suggest they have a function. DCs could activate CD8 cells, or conversely, they could be inhibitory.38 If CD8 cells were exclusively bound to APCs, they would not cause significant damage, as CD8-mediated GVHD requires cognate interactions with MHCI+ nonhematopoietic cells.15 In this way, DCs could be a sink for pathogenic CD8 cells. Some CD8 cells have relatively shorter DC contacts, and these cells may subsequently engage nonhematopoietic targets. It is also possible that even CD8 cells with long DC contacts detach and polarize toward nonhematopoietic targets without moving. Cutaneous DCs can express PD-L1, which could inhibit lesional T cells.38 Unambiguous answers to these questions will require in vivo approaches to determine the polarities of TCR organization combined with the visualization of nonhematopoietic cells and techniques for longer-term and specific cutaneous DC ablation, which to our knowledge do not exist.
Cutaneous CD4 cells also made TCR:MHCII interactions, as demonstrated by the increase in CD4 cell motility after Y3P injection. Given the low rate of influx of CD4 cells, this rise in motility cannot be accounted for by newly entered CD4 cells that may have been prevented from making de novo TCR:MHCII interactions by Y3P. Not all lesional CD4 cells increased motility after Y3P. Presumably, antibody needs to enter the immunologic synapse to interrupt TCR:MHCII interactions sufficiently to decrease TCR signaling and, subsequently, motility. T cells with TCRs that interact with more MHCII molecules or with higher-affinity TCRs might be less likely to have TCR signaling drop below the necessary threshold. Subsets of CD4 cells (and CD8 cells) could be intrinsically incapable of increasing their motility even with complete interruption of TCR signaling, and others could be stationary independent of active TCR signaling, as is the case with the OT-1 effectors in our experiments. Nonetheless, our data definitively show some CD4 stability is TCR:MHCII-mediated.
However, we could not demonstrate that CD4 cells make TCR:MHCII interactions with DCs. The trivial explanation is that CD4 cells do not make such cognate interactions, but we think this is unlikely. Several factors could have contributed to our inability to detect the difference. One possibility is that CD4 cells more readily make cognate interactions with CD11c−MHCII+ cells. As these cells may be more capable of indirectly presenting miHAs on MHCII than on MHCI, they could have influenced the CD4 result more so than the CD8 result. MHCII−CD11c+ cells could also have been cross-dressed with MHCII-miHA complexes sufficiently to arrest CD4 cells. CD4 cells might also be in contact with nonhematopoietic cells, which can be induced to express MHCII during the GVHD response.15,39
Targeting pathways specifically engaged in damaging GVHD target organs could lead to therapies that spare antipathogen T cells and alloreactive T cells at sites that harbor malignant cells. Understanding the mechanisms of local damage is critical to the development of such approaches. Our work suggests that cutaneous GVHD is locally driven, which supports the development of more effective local therapies. Future studies must focus on other GVHD target organs, and in particular the bowel.
The full-text version of this article contains a data supplement.
Acknowledgments
The authors acknowledge the diligent care by the animal technicians at both Yale and the University of Pittsburgh.
This work was supported by the National Institutes of Health, National Heart, Lung, and Blood Institute (R01-HL083072).
Authorship
Contribution: S.M.-Z., C.W., J.Z., and H.L. designed and performed experiments and analyzed data; S.M.-Z. also contributed to writing the paper; E.K. and S.Z. analyzed data; C.M.-M. provided technical advice and performed experiments; J.M. and D.J. scored histopathology; D.M.R. and F.G.L. assisted in experimental design; D.G. and A.H. provided technical support on 2PIM; and W.D.S. designed experiments, analyzed data, and wrote the paper.
Conflict-of-interest disclosure: W.D.S. has equity ownership in Bluesphere Bio. The remaining authors declare no competing financial interests.
Correspondence: Warren D. Shlomchik, University of Pittsburgh, 200 Lothrop St, The Thomas E. Starzl Biomedical Research Tower, E1552, Pittsburgh, PA 15261; e-mail: warrens@pitt.edu.

