

Key Points
Receptor-engineered T-cell therapy has good efficacy and acceptable safety in advanced myeloma in the context of SCT.
Engineered T cells expanded, trafficked to bone marrow, persisted, and exhibited functionality; were associated with a clinical response.

Abstract
This study in patients with relapsed, refractory, or high-risk multiple myeloma (MM) evaluated the safety and activity of autologous T cells engineered to express an affinity-enhanced T-cell receptor (TCR) that recognizes a peptide shared by cancer antigens New York esophageal squamous cell carcinoma-1 (NY-ESO-1) and L-antigen family member 1 (LAGE-1) and presented by HLA-A*02:01. T cells collected from 25 HLA-A*02:01-positive patients with MM expressing NY-ESO-1 and/or LAGE-1 were activated, transduced with self-inactivating lentiviral vector encoding the NY-ESO-1c259TCR, and expanded in culture. After myeloablation and autologous stem cell transplant (ASCT), all 25 patients received an infusion of up to 1 × 10¹⁰ NY-ESO-1 specific peptide enhanced affinity receptor (SPEAR) T cells. Objective response rate (International Myeloma Working Group consensus criteria) was 80% at day 42 (95% confidence interval [CI], 0.59-0.93), 76% at day 100 (95% CI, 0.55-0.91), and 44% at 1 year (95% CI, 0.24-0.65). At year 1, 13/25 patients were disease progression-free (52%); 11 were responders (1 stringent complete response, 1 complete response, 8 very good partial response, 1 partial response). Three patients remained disease progression-free at 38.6, 59.2, and 60.6 months post-NY-ESO-1 SPEAR T-cell infusion. Median progression-free survival was 13.5 months (range, 3.2-60.6 months); median overall survival was 35.1 months (range, 6.4-66.7 months). Infusions were well tolerated; cytokine release syndrome was not reported. No fatal serious adverse events occurred during study conduct. NY-ESO-1 SPEAR T cells expanded in vivo, trafficked to bone marrow, demonstrated persistence, and exhibited tumor antigen-directed functionality. In this MM patient population, NY-ESO-1 SPEAR T-cell therapy in the context of ASCT was associated with antitumor activity. This trial was registered at www.clinicaltrials.gov as #NCT01352286.
Introduction
Engineered T-cell immunotherapy offers a new approach for the treatment of multiple myeloma (MM), and the use of genetically engineered T cells in this disease is closely following the clinical development of T-cell immunotherapy for other hematologic malignancies, such as diffuse large B-cell lymphoma and pediatric acute lymphoblastic leukemia.1-5 Autologous T cells can be engineered to recognize known tumor-specific antigens by expressing chimeric antigen receptors6 or affinity-enhanced T-cell receptors (TCRs).7 Our specific peptide enhanced affinity receptor (SPEAR) T cells contain optimized TCRs that, in the context reported here, recognize a 9-amino acid peptide derived from New York esophageal squamous cell carcinoma-1 (NY-ESO-1) antigen and presented by the allele HLA-A*02:01, which is found in ∼50% of whites, ∼40% of Hispanics, ∼20% of African Americans, and up to 20% of Asians.8 Unlike chimeric antigen receptors, TCR-engineered T cells continue to use physiological signaling pathways, so the risks for cytokine release syndrome (CRS) and neurologic toxicity are expected to be lower than those reported in studies using chimeric antigen receptors.9 Cancer-testis antigens NY-ESO-1 and L-Antigen Family Member (LAGE) 1 are each expressed in various tumors and occur in approximately 30% and 50% of MM samples tested, respectively.10,11 Expression of NY-ESO-1 in advanced myeloma correlated with high-risk features,12 and LAGE-1 expression in relapsed MM was associated with shorter progression-free survival (PFS).13 The amino acid sequences of NY-ESO-1 and LAGE-1 share a high degree of homology,14 and the peptide sequences presented are identical.
Our affinity-enhanced NY-ESO-1c259 TCR recognizes the peptide sequence SLLMWITQC, expressed by NY-ESO-1 or LAGE-1 in complex with HLA-A*02:01, as previously described,15,16 and was clinically tested in patients with metastatic synovial sarcoma or metastatic melanoma.17,18 We hypothesized that adoptive transfer of autologous NY-ESO-1c259TCR engineered T cells (hereafter referred to as NY-ESO-1 SPEAR T cells) could improve clinical responses after autologous stem cell transplant (ASCT) in HLA-A*02:01-positive patients with advanced MM expressing NY-ESO-1 and/or LAGE-1. This study enrolled patients with antigen-positive relapsed, refractory, or high-risk for relapse MM who were eligible for ASCT. NY-ESO-1 SPEAR T cells were infused 4 days after high-dose melphalan and 2 days after ASCT. Data from 20 patients were reported previously.19 Here, we describe long-term clinical outcomes and expanded correlative translational studies for the full cohort of 25 patients who received NY-ESO-1 SPEAR T cells post-ASCT for advanced MM, including long-term persistence, marrow trafficking, functionality based on cytokine production, and longitudinal phenotypic analyses.
Materials and methods
Full details of the study design and methodology used in this clinical trial have been reported,19 and are summarized here. The study CONSORT diagram is presented in the supplemental Materials (supplemental Figure 1).
Study design and patients
This was a phase 1/2a open-label clinical trial carried out at 2 centers in the United States (clinicaltrials.gov identifier: NCT01352286). Study approval was obtained from the Institutional Review Boards of the University of Maryland and the University of Pennsylvania, the US Food and Drug Administration, and the National Institutes of Health Recombinant DNA Advisory Committee. This study was conducted in accordance with International Council for Harmonization Good Clinical Practice and the ethical principles outlined in the Declaration of Helsinki. All patients provided written informed consent before participating in the trial. Eligible patients were aged 18 to 80 years; were HLA-A*02:01 positive, with refractory, relapsed, or high-risk MM associated with 1 or more adverse cytogenetic abnormalities; had measurable disease; and confirmed expression of NY-ESO-1 and/or LAGE-1 by quantitative reverse transcription polymerase chain reaction on fresh bone marrow aspirates.
Study regimen
Approximately 7 to 14 days after being immunized with the pneumococcal conjugate vaccine, which acts as a marker of antigen-specific immune reconstitution, patients underwent steady-state apheresis for T-cell collection. Isolated T cells were then activated using anti-CD3/CD28 immunomagnetic beads, transduced with lentiviral vector encoding the affinity-enhanced NY-ESO-1c259TCR, and expanded in culture. Patients underwent stem cell mobilization (using 1.5 g/m2 cyclophosphamide plus 10 µg/kg granulocyte colony-stimulating factor) and collection. Once the NY-ESO-1 SPEAR T cells were available, patients were conditioned with high-dose melphalan (140-200 mg/m2), followed by ASCT 2 days later. At 2 days post-ASCT, patients received an infusion of autologous NY-ESO-1 SPEAR T cells (up to 1 × 10¹⁰ transduced T cells). All patients received lenalidomide maintenance therapy (10 mg/day; supplemental Materials) per the standard of care, if they remained in the study through day 100 post-ASCT. The main study times were: day 0, ASCT (stem cell infusion); day 2, NY-ESO-1 SPEAR T-cell infusion; day 42, first disease assessment; and day 100, second disease assessment; further disease assessment then occurred at months 6, 9, and 12 and every 3 months thereafter (supplemental Figure 2).
Endpoints
The primary endpoint was the occurrence of adverse events (AEs) per National Cancer Institute Common Terminology Criteria for Adverse Events Version 4 guidelines, including at least grade 4 laboratory toxicities at any time from pneumococcal conjugate vaccine immunization until 12 months post-NY-ESO-1 SPEAR T-cell infusion. Secondary endpoints were the evaluation of NY-ESO-1 SPEAR T-cell bioactivity and its mechanism of action, and the evaluation of clinical response per the International Myeloma Working Group (IMWG) Consensus Panel 1 criteria,20 including objective response rate (ORR), best objective response (BOR), duration of response (DOR), PFS, and overall survival (OS). (The protocol was amended to follow the updated IMWG consensus criteria for response assessment in MM21 ; therefore, the individual clinical responses in this report may not directly match those stated previously.19 ) Per IMWG 2011 criteria, patients remain responders as long as they do not meet progression criteria. Exploratory endpoints included the evaluation of immunological parameters associated with the persistence, bioactivity, and functionality of NY-ESO-1 SPEAR T cells.
NY-ESO-1 SPEAR T-cell and lentiviral vector manufacturing and assays for gene-modified T-cell persistence, trafficking, and phenotypic analysis
The methodology for each of these procedures has been described previously,19 and is presented in the supplemental Materials.
Statistical methods
The sample size calculation of 25 patients was based on the primary endpoint of safety, and that the rate of study-related AEs was at least 40% against the alternative that this rate was less than 40%. In addition, based on historical data, the complete response (CR) rate after ASCT in patients was estimated to be 36%. It was expected that the CR rate in this trial would be 66%. Using the 1-sided χ2 test, we had 91.6% power to detect this meaningful difference at a significant level of 5% if approximately 25 patients were enrolled.
The intent-to-treat (ITT) population included all patients who were enrolled in the trial (ie, all patients with a date of informed consent). The modified intent-to-treat (mITT) population included all ITT patients who received NY-ESO-1 SPEAR T-cell infusion and was the primary analysis population for both safety and efficacy. Because the ITT and mITT populations were the same for this study (N = 25 for both), only analyses associated with the ITT population were reported. Data collected in the study were documented using summary tables and subject data listings. Continuous variables were summarized using descriptive statistics. Categorical variables were summarized using frequencies and proportions. Time-to-event data were summarized using Kaplan-Meier methodology, using the 25th, 50th (median), and 75th percentiles with associated 2-sided 95% confidence intervals (CIs), using the complementary log-log transformation, as well as the proportion of censored observations. The 95% CIs for proportions were calculated using Clopper-Pearson (exact) confidence limits. The number and percentage of patients who experienced at least 1 AE (including patients who received a second T-cell infusion) were summarized overall, for each system organ class (per Medical Dictionary for Regulatory Activities, MedDRA), and for each preferred term. AEs were graded according to the National Cancer Institute Common Terminology Criteria for Adverse Events Version 4. No formal hypothesis-testing analysis of AE incidence rates was performed.
Results
Patients
A total of 85 patients were screened at 2 sites, of which 25 patients were enrolled and received NY-ESO-1 SPEAR T-cell infusion (Table 1; supplemental Figure 1). The main reasons for ineligibility in a significant proportion of screened patients were incorrect HLA type and lack of tumor antigen (NY-ESO-1 and/or LAGE) expression. Four of the 25 patients received a second infusion of NY-ESO-1 SPEAR T cells after responding and then progressing after the first infusion. Median patient age was 59 years, 15/25 (60%) were men, and 19/25 (76%) were white. All patients were HLA-A2+ and LAGE-1+, and 14/25 (56%) were NY-ESO-1+. Twelve (48%) of the 25 patients had at least 1 cytogenetic abnormality, most commonly a 13q deletion (8/25 [32%] patients). Patients had received a median of 3 (range, 1 to >4) prior therapies, and 4 of the 25 patients had received a prior autologous stem cell transplant. Further demographic and baseline details are presented in Table 2.
Patient disposition
| Patients (N = 25) | |
|---|---|
| ITT population, n | 25 |
| mITT population, n | 25 |
| Patient status at end of infusion 1 interventional phase, n (%)* | 25 (100) |
| Disease progression | 22 (88) |
| Did not progress† | 3 (12) |
| Patient status at end of infusion 2 interventional phase (for patients with second infusion), n (%)* | 4 (16) |
| Disease progression‡ | 4 (16) |
Patients completed the study if they discontinued because of disease progression or death after their last T-cell infusion, or if they were progression-free at the time of study completion (at Sponsor discretion) and moved into long-term follow-up. ITT population: all patients who were enrolled in the trial. mITT population: all patients in the ITT population who received ≥ 1 T-cell infusion.
Denominator for percentages is based on the ITT population.
Did not progress by the time of the primary analysis; participation was terminated by the study sponsor.
One patient progressed before withdrawing consent.
Patient demographic and baseline characteristics
| Parameter | Patients (N = 25) |
|---|---|
| Sex, n (%) | |
| Female | 10 (40) |
| Male | 15 (60) |
| Age, y* | |
| Mean (SD) | 59 (8) |
| Median | 59 |
| Minimum, maximum | 45, 72 |
| Race, n (%) | |
| Black or African American | 5 (20) |
| White | 19 (76) |
| Multiracial | 1 (4) |
| HLA status, n (%) | |
| HLA-A2+ | 25 (100) |
| NY-ESO-1 status, n (%) | |
| NY-ESO-1+ | 14 (56) |
| NY-ESO-1− | 11 (44) |
| LAGE-1 status, n (%) | |
| LAGE-1+† | 25 (100) |
| ECOG performance status, n (%) | |
| 0 | 7 (28) |
| 1 | 16 (64) |
| 2 | 2 (8) |
| Previous therapies, n (%)‡ | |
| 1 | 5 (20) |
| 2 | 6 (24) |
| 3 | 4 (16) |
| >4 | 10 (40) |
| Cytogenetic abnormalities, n (%) | |
| ≥1 | 12 (48) |
| Deletion (13q) | 8 (32) |
| Deletion (17p) | 1 (5) |
| Hypodiploid | 0 (0) |
| Transduced cell dose, n (%) | |
| <1 × 10⁹ | 3 (12) |
| 1-5 × 10⁹ | 21 (84) |
| ≥5 × 10⁹ | 1 (4) |
| Median (range) | 3.1 × 10⁹ (0.5-5.05 × 10⁹) |
ECOG, Eastern Cooperative Oncology Group; SD, standard deviation.
Age at informed consent/screening.
One patient tested positive for LAGE-1 per the laboratory report at screening but was erroneously recorded as LAGE-1 negative in the database, and this was not corrected prior to database lock.
Four patients had received a prior autologous stem cell transplant.
Safety
At the time of study interventional phase completion, 14 (56%) patients died because of disease progression, and 11 (44%) patients remained alive. AEs were summarized for the period from day −2 (administration of high-dose melphalan) to the end of the intervention phase. All patients experienced at least 1 AE (Table 3). The most common AEs were diarrhea (96%), decreased appetite (92%), nausea (92%), fatigue (88%), and thrombocytopenia (88%), which are consistent with ASCT (ie, myeloablative chemotherapy). A summary of hematologic and nonhematologic AEs occurring at grade 3 or 4 is presented in Table 4; the majority of these AEs resolved. The only notable nonhematologic grade 3 or 4 AE that did not resolve during the observation period was ejection fraction decreased (grade 3), reported in 1 patient (supplemental Table 1). Twenty-four patients (96%) had AEs with a maximum severity of at least grade 3, but there were no grade 5 AEs. Grade 4 AEs occurred in 23/25 (92%) patients, of which cytopenias were common. Thirteen (52%) patients experienced serious AEs (SAEs; Table 3). SAEs occurring in more than 1 patient were neutropenia (4/25 [16%] patients); atrial fibrillation, autologous graft-versus-host disease (GVHD), and pyrexia (each occurring in 3/25 [12%] patients); and diarrhea, febrile neutropenia, and hypoxia (each occurring in 2/25 [8%] patients). There were no reports of CRS during this study, although all 25 patients had 1 or more AEs that were considered to be potential symptoms of CRS. The most common of these occurring at grade 3 (8 patients) were maculopapular rash (12%), and hypoxia (8%). Autologous GVHD (any event) was reported in 6/25 (24%) patients (including autologous GVHD in gastrointestinal tract and autologous GVHD in skin), of which 3 were SAEs. Histologic studies that confirmed autologous GVHD were published previously.19 All 6 cases of autologous GVHD were considered at least possibly related to NY-ESO-1 SPEAR T-cell therapy, and all cases resolved after limited treatment with topical steroids or oral immunosuppression. Three patients experienced pancytopenia after initial bone marrow recovery after chemotherapy. Two of these cases were considered possibly related to NY-ESO-1 SPEAR T-cell therapy, and the other case was considered unrelated. All these events resolved. Neurologic events related to T-cell therapy (considered by the investigator as probably related, possibly related, or unlikely related to T-cell infusion) included fatigue (13/25 [52%] patients), muscular weakness (9/25 [36%] patients), and peripheral sensory neuropathy (5/25 [20%] patients). There were no AE reports consistent with encephalopathy, seizure, or inflammatory polyneuropathy related to T-cell therapy.
Overall summary of adverse events (ITT population)
| Category | Patients (N = 25), n (%) |
|---|---|
| Adverse events | 25 (100) |
| Any AE related* to study intervention | 24 (96) |
| Any AE ≥ grade 3 | 24 (96) |
| AE grade 3 hematologic† | 21 (84) |
| AE grade 3 nonhematologic† | 23 (92) |
| AE grade 4 hematologic† | 23 (92) |
| AE grade 4 nonhematologic† | 7 (28) |
| Any AE related* to study intervention and ≥grade 3 | 21 (84) |
| Serious adverse events | 13 (52) |
| Any SAE related* to study intervention | 7 (28) |
| Any SAE ≥ grade 3 | 12 (48) |
| Any SAE related* to study intervention and ≥grade 3 | 7 (28) |
| Any SAEs with fatal outcome | 0 |
Observation period: administration of high-dose melphalan (day –2) to end of intervention phase. AEs were coded using MedDRA Version 20.0.
SAE, serious AE.
Defined (by the investigator) as definitely related, probably related, possibly related, or unlikely related to T-cell infusion.
Hematologic AEs were defined as blood system disorders or investigations involving an increase/decrease in blood cells; nonhematologic AEs were defined as all other system/organ class terms.
Hematologic and nonhematologic adverse events occurring at toxicity grade 3 or 4 in ≥5% of patients by preferred term (ITT population)
| Preferred term* | Patients (N = 25), n (%) | |
|---|---|---|
| Grade 3 | Grade 4 | |
| Hematologic toxicities | ||
| Febrile neutropenia | 15 (60) | 2 (8) |
| Anemia | 14 (56) | 0 (0) |
| Neutropenia | 4 (16) | 7 (28) |
| Leukopenia | 1 (4) | 13 (52) |
| Lymphopenia | 0 (0) | 2 (8) |
| Thrombocytopenia | 0 (0) | 18 (72) |
| Nonhematologic toxicities | ||
| Diarrhea | 10 (40) | 0 (0) |
| Hypophosphatemia | 6 (24) | 0 (0) |
| Hypocalcemia | 4 (16) | 1 (4) |
| Graft-versus-host disease | 3 (12) | 0 (0) |
| Hypokalemia | 3 (12) | 0 (0) |
| Rash | 3 (12) | 0 (0) |
| Stomatitis | 3 (12) | 0 (0) |
| Abdominal pain | 2 (8) | 0 (0) |
| Fatigue | 2 (8) | 0 (0) |
| Hyponatremia | 2 (8) | 0 (0) |
| Hypoxia | 2 (8) | 0 (0) |
| Mucosal inflammation | 2 (8) | 0 (0) |
| Neutropenic colitis | 2 (8) | 0 (0) |
| Nausea | 2 (8) | 0 (0) |
| Esophagitis | 2 (8) | 0 (0) |
| Pain in extremity | 2 (8) | 0 (0) |
| Atrial fibrillation | 1 (4) | 1 (4) |
| Hypotension | 1 (4) | 1 (4) |
| Pneumonitis | 1 (4) | 1 (4) |
Patients were counted once for each preferred term.
Observation period: administration of high-dose melphalan at day –2 to end of intervention phase. AEs were coded using MedDRA Version 20.0. Definition of hematologic/nonhematologic AE terms are provided in Table 3.
AE data are listed in descending order of frequency of grade 3 events.
Efficacy
At year 1, 13/25 patients were disease progression-free (52%), 11 of which were responders (1 stringent complete response, 1 complete response, 8 very good partial response, and 1 partial response; Tables 5 and 6). Three of 25 patients (12%) remained disease progression-free at 38.6, 59.2, and 60.6 months post-NY-ESO-1 SPEAR T-cell infusion (Figure 1A). The median PFS was 13.5 months (95% CI, 8.9-31.1 months; range, 3.2-60.6 months; Figure 1B). The median OS was 35.1 months (95% CI, 22.7 months-not reached; range, 6.4-66.7 months; Figure 1C). Per IMWG 2011 criteria, ORR was 80% at day 42 (95% Clopper-Pearson CI, 0.59-0.93), 76% at day 100 (95% Clopper-Pearson CI, 0.55-0.91), and 44% at 1 year (95% Clopper-Pearson CI, 0.24-0.65; Table 5). BOR data by time are presented in Table 6. Median DOR was 12.2 months (95% CI, 7.6-29.8 months).
ORR per IMWG 2011 criteria by time points of interest (ITT population)
| Time point | ORR (N = 25), n (%) | 95% Clopper-Pearson CI |
|---|---|---|
| Day 42 | 20 (80) | 0.59-0.93 |
| Day 100* | 19 (76) | 0.55-0.91 |
| Day 180 | 16 (64) | 0.43-0.82 |
| Day 270 | 13 (52) | 0.31-0.72 |
| Year 1† | 11 (44) | 0.24-0.65 |
| Time point | ORR (N = 25), n (%) | 95% Clopper-Pearson CI |
|---|---|---|
| Day 42 | 20 (80) | 0.59-0.93 |
| Day 100* | 19 (76) | 0.55-0.91 |
| Day 180 | 16 (64) | 0.43-0.82 |
| Day 270 | 13 (52) | 0.31-0.72 |
| Year 1† | 11 (44) | 0.24-0.65 |
ORR is defined as the proportion of patients who have a positive response by IMWG 2011 criteria (sCR, CR, VGPR, PR) relative to the total number of patients in the population.
CR, complete response; PR, partial response; sCR, stringent complete response; VGPR, very good partial response.
Day 100 responders (n = 19): 1 sCR, 12 VGPR, and 6 PR.
Year 1 responders (n = 11): 1 sCR, 1 CR, 8 VGPR, and 1 PR.
BOR by time (ITT population)
| Time and parameter/category or criterion, IMWG 2011 response, n (%) | Patients (N = 25), n (%) |
|---|---|
| Day 42 | |
| sCR | 1 (4) |
| CR | 0 |
| VGPR | 10 (40) |
| PR | 9 (36) |
| SD | 5 (20) |
| PD | 0 |
| Day 100 | |
| sCR | 1 (4) |
| CR | 0 |
| VGPR | 12 (48) |
| PR | 6 (24) |
| SD | 5 (20) |
| PD | 1 (4) |
| Day 180 | |
| sCR | 2 (8) |
| CR | 1 (4) |
| VGPR | 11 (44) |
| PR | 2 (8) |
| SD | 3 (12) |
| PD | 2 (8) |
| Day 270 | |
| sCR | 2 (8) |
| CR | 1 (4) |
| VGPR | 8 (32) |
| PR | 2 (8) |
| SD | 2 (8) |
| PD | 4 (16) |
| Year 1 | |
| sCR | 1 (4) |
| CR | 1 (4) |
| VGPR | 8 (32) |
| PR | 1 (4) |
| SD | 2 (8) |
| PD | 1 (4) |
Patients without a response evaluated at the visit are included in the denominator.
BOR, best objective response; PD, progressive disease or relapse; SD, stable disease.
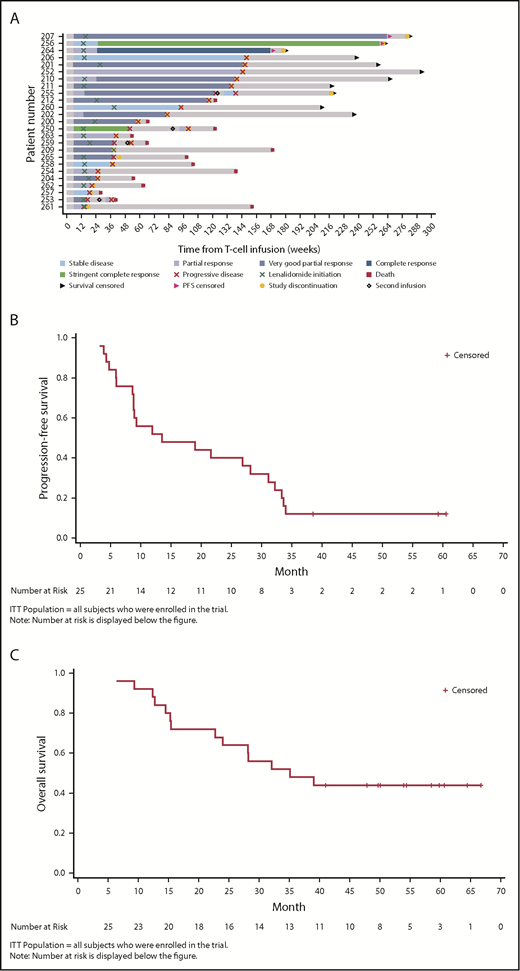
Clinical responses (ITT population). (A) Patient response profiles. Swimmer plot showing duration of clinical response and survival after disease progression. Patients 207, 256, and 264 were disease progression-free at more than 3 years post-NY-ESO-1c259 T-cell therapy. Day 0, ASCT; day 2, NY-ESO-1c259 T-cell infusion. (B) PFS, Kaplan-Meier plot. Surviving (censored) patients are represented by tick marks. (C) OS, Kaplan-Meier plot. Surviving (censored) patients are represented by tick marks.
Clinical responses (ITT population). (A) Patient response profiles. Swimmer plot showing duration of clinical response and survival after disease progression. Patients 207, 256, and 264 were disease progression-free at more than 3 years post-NY-ESO-1c259 T-cell therapy. Day 0, ASCT; day 2, NY-ESO-1c259 T-cell infusion. (B) PFS, Kaplan-Meier plot. Surviving (censored) patients are represented by tick marks. (C) OS, Kaplan-Meier plot. Surviving (censored) patients are represented by tick marks.
In the 4 patients who received a second infusion of NY-ESO-1 SPEAR T cells, 1 patient (who had a bone marrow biopsy that was almost 100% full of myeloma) had a transient very good partial response in conjunction with marked expansion of CD8+ T cells in the marrow (∼70%), especially after addition of low-dose lenalidomide; however, these T cells were composed chiefly of 2 dominant clonotypes that were distinct from the infused NY-ESO-1 SPEAR T cells, suggesting epitope spreading.19 The remaining 3 patients did not exhibit significant clinical responses or T-cell expansion.
Persistence, trafficking, and function of NY-ESO-1 SPEAR T cells in peripheral blood and bone marrow
Persistence of NY-ESO-1 SPEAR T cells
Persistence was measured at baseline and after NY-ESO-1 SPEAR T-cell infusion in all 25 treated patients. Quantitative polymerase chain reaction of peripheral blood mononuclear cells (PBMCs) from responders and nonresponders showed peak concentrations (assessed by copies of TCR vector per microgram genomic DNA) within the first 7 days post-NY-ESO-1 SPEAR T-cell infusion (Figure 2A). Concentrations declined rapidly thereafter in most patients, but remained quantifiable (more than lower limit of quantification) until the day 100 point in all but 2 patients (1 responder and 1 nonresponder). Ten patients had quantifiable persistence 1 year after infusion (8 responders and 2 nonresponders). Two patients (201 and 252) had detectable NY-ESO-1 SPEAR T cells at 5 years postinfusion (tumor antigen expression status in patient 201 was not known at the time of disease progression; patient 252 relapsed with antigen-positive tumor). Three responders had long-term elevations of NY-ESO-1 SPEAR T cells (patient 201: DOR, 141 weeks; PFS, 146 weeks; and OS, 254 weeks; patient 250: DOR, 46 weeks; PFS, 52 weeks; and OS, 122 weeks; patient 252: DOR, 139 weeks; PFS, 145 weeks; and OS, 290 weeks). No statistical correlation between persistence and response could be established because of the small number of nonresponders (4 patients). Flow cytometry using PBMC samples confirmed the expression of modified TCRs in the T cells from study patients (Figure 2B). These assays demonstrated the persistence of potentially physiologically relevant numbers of NY-ESO-1 SPEAR T cells (both CD4+ and CD8+ subpopulations) in the peripheral blood. Persistence of NY-ESO-1 SPEAR T cells in PBMCs and bone marrow for patients with paired samples was also demonstrated (Figure 2C).
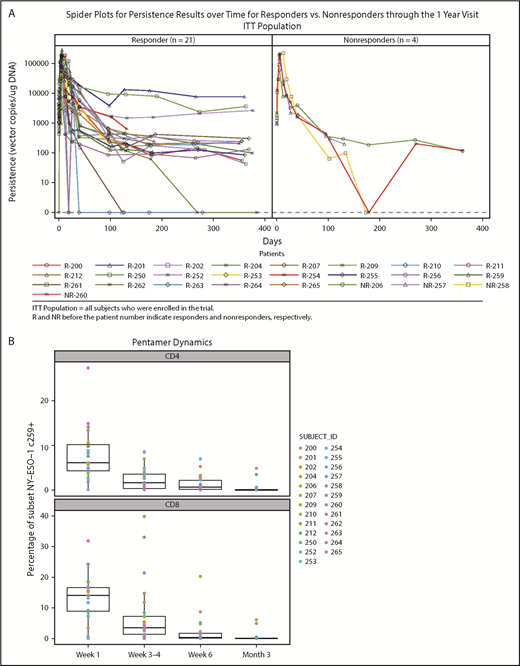
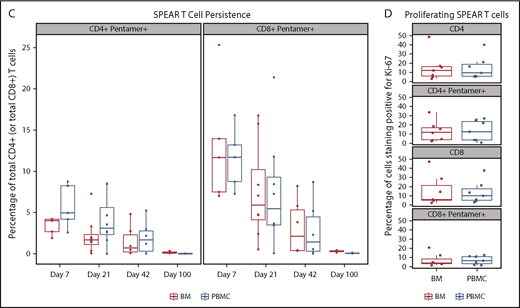
Persistence of NY-ESO-1 SPEAR T cells in the peripheral blood and bone marrow. (A) Persistence of NY-ESO-1 SPEAR T cells in PBMC through 1 year after T-cell infusion measured by quantitative polymerase chain reaction methodology is shown for responders (left) and nonresponders (right). Note: Responder/nonresponder status based on BOR up to year 1. (Assumptions: average of 1 vector copy per cell based on transduction efficiency; 1 μg DNA = ∼158 000 cells. Lower limit of quantification of the assay was established at 50 copies/μg DNA at the University of Pennsylvania, and 100 copies/μg DNA at Cambridge Biomedical.) (B) Persistence of NY-ESO-1 SPEAR T-cells in PBMC through 100 days after T-cell infusion was confirmed via flow cytometry measurements. Box plot shows the mean, upper, and lower quartiles. (C) Persistence of NY-ESO-1 SPEAR T cells was compared in PBMC and bone marrow (BM) from patients with paired samples, and is shown as a percentage of the total CD4+ (or CD8+) T cells. Box plot shows the mean, upper, and lower quartiles. (D) NY-ESO-1 SPEAR T-cell proliferation in the BM and PBMC was demonstrated by Ki-67 staining. Box plot shows the mean, upper, and lower quartiles. Day 21 was selected because of patient numbers (evaluable BM samples, n = 8) and robust data at this time. Note: the pentamer is less efficient for CD4+ T-cell binding and, therefore, may underestimate this compartment.
Persistence of NY-ESO-1 SPEAR T cells in the peripheral blood and bone marrow. (A) Persistence of NY-ESO-1 SPEAR T cells in PBMC through 1 year after T-cell infusion measured by quantitative polymerase chain reaction methodology is shown for responders (left) and nonresponders (right). Note: Responder/nonresponder status based on BOR up to year 1. (Assumptions: average of 1 vector copy per cell based on transduction efficiency; 1 μg DNA = ∼158 000 cells. Lower limit of quantification of the assay was established at 50 copies/μg DNA at the University of Pennsylvania, and 100 copies/μg DNA at Cambridge Biomedical.) (B) Persistence of NY-ESO-1 SPEAR T-cells in PBMC through 100 days after T-cell infusion was confirmed via flow cytometry measurements. Box plot shows the mean, upper, and lower quartiles. (C) Persistence of NY-ESO-1 SPEAR T cells was compared in PBMC and bone marrow (BM) from patients with paired samples, and is shown as a percentage of the total CD4+ (or CD8+) T cells. Box plot shows the mean, upper, and lower quartiles. (D) NY-ESO-1 SPEAR T-cell proliferation in the BM and PBMC was demonstrated by Ki-67 staining. Box plot shows the mean, upper, and lower quartiles. Day 21 was selected because of patient numbers (evaluable BM samples, n = 8) and robust data at this time. Note: the pentamer is less efficient for CD4+ T-cell binding and, therefore, may underestimate this compartment.
Infiltration and proliferation of NY-ESO-1 SPEAR T cells
Infiltration of the bone marrow by NY-ESO-1 SPEAR T cells, evaluated in 11 of 25 patients, was detected at day 7 post-T-cell infusion and persisted to day 100. The percentage of NY-ESO-1 SPEAR T cells (CD4+ or CD8+) in the bone marrow was assessed at days 7, 21, 42, and 100 (Figure 2C). Proliferation of NY-ESO-1 SPEAR T cells and nontransduced cells was assessed in peripheral blood and bone marrow via staining with the cell proliferation marker Ki-67, and similar levels of proliferation (∼10%) were observed in all cases (Figure 2D). These data demonstrated that NY-ESO-1 SPEAR T cells were present in peripheral blood and bone marrow by day 7, with evidence of ongoing trafficking between the 2 compartments beyond this time point (data not shown).
Memory phenotype of persisting NY-ESO-1 SPEAR T cells
Memory phenotypes of NY-ESO-1 SPEAR T cells were reported for 8 of 25 patients as a result of the limited availability of paired samples of peripheral blood and bone marrow (Figure 3A-B). Distribution of memory subsets within NY-ESO-1 SPEAR T cells in the bone marrow was reflective of that observed in the paired PBMCs. Although all memory subsets (central memory [CM], effector memory [EM], EM RA+ [EMRA], stem cell memory [SCM], and naïve) were observed in each manufactured product infused, persisting cells in patient samples were predominantly from either the EMRA or SCM lineage (Figure 3B). The presence of both a self-renewing and effector population supports the hypothesis that NY-ESO-1 SPEAR T cells were trafficking between these 2 compartments and colonizing the bone marrow, and suggests that sampling the peripheral blood compartment is representative of the tumor compartment (ie, bone marrow) in MM.
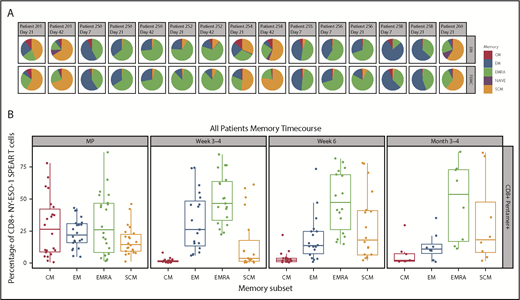
Memory phenotypes of NY-ESO-1 SPEAR T cells. (A) Distribution of memory subsets with described phenotypic markers of CM, EM, EM RA+ (EMRA), stem cell memory SCM, and naïve within CD8+ pentamer+ NY-ESO-1 SPEAR T cells in BM and PBMC postinfusion were performed in patients in whom parallel collection of BM and PBMC was carried out and in whom sufficient cells were available for analysis (n = 8). Pie chart colors represent the proportions of NY‐ESO‐1 SPEAR T‐cells with described phenotypic markers of CM (red), EM (blue), EMRA (green), SCM (orange), and naïve cells (purple) within CD8+ SPEAR T‐cells. (B) Percentage of NY-ESO-1 SPEAR T cells with described phenotypic markers of CM, EM, EMRA, and SCM within CD8+ pentamer+ NY-ESO-1 SPEAR T cells in the manufactured product and posttreatment PBMC at various times from all 25 patients. The dominant populations of persisting cells were EMRA (green) and SCM (orange). Box plot shows the mean and upper and lower quartiles.
Memory phenotypes of NY-ESO-1 SPEAR T cells. (A) Distribution of memory subsets with described phenotypic markers of CM, EM, EM RA+ (EMRA), stem cell memory SCM, and naïve within CD8+ pentamer+ NY-ESO-1 SPEAR T cells in BM and PBMC postinfusion were performed in patients in whom parallel collection of BM and PBMC was carried out and in whom sufficient cells were available for analysis (n = 8). Pie chart colors represent the proportions of NY‐ESO‐1 SPEAR T‐cells with described phenotypic markers of CM (red), EM (blue), EMRA (green), SCM (orange), and naïve cells (purple) within CD8+ SPEAR T‐cells. (B) Percentage of NY-ESO-1 SPEAR T cells with described phenotypic markers of CM, EM, EMRA, and SCM within CD8+ pentamer+ NY-ESO-1 SPEAR T cells in the manufactured product and posttreatment PBMC at various times from all 25 patients. The dominant populations of persisting cells were EMRA (green) and SCM (orange). Box plot shows the mean and upper and lower quartiles.
Postinfusion cytokine production by NY-ESO-1 SPEAR T cells
Production of the cytokines interferon γ, interleukin 2, and tumor necrosis factor α in NY-ESO-1 SPEAR T cells was evaluated in postinfusion peripheral blood samples. NY-ESO-1 SPEAR T cells produced cytokines in response to antigen-specific stimulation (using SLLMWITQC peptide), and did so at a consistent level postinfusion; furthermore, they did not lose functionality, as cytokine production was maintained up to 1 year postinfusion (Figure 4A). Only transduced T cells reacted with antigen-specific cytokine responses (Figure 4B). No cytokine response to antigen was observed before the engineered NY-ESO-1 TCR was introduced (day –50 sample). On restimulation with antigens in vitro, using antigen-loaded T2 cells, detectable levels of cytokines were generated by T cells within the sample, whereas no cytokines were detected in the absence of antigen-specific stimulation (unpulsed T2 cells, negative control). Cells from all samples were capable of producing cytokines, as demonstrated by phorbol myristate acetate and ionomycin stimulation (positive control).
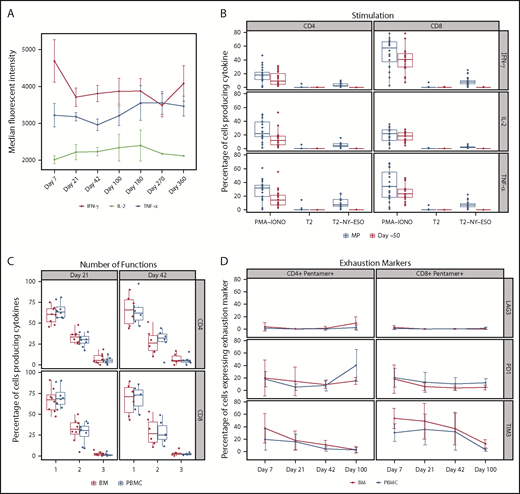
Functionality of NY-ESO-1 SPEAR T cells postinfusion. (A) Cytokine production: cytokine levels per cell were measured by median fluorescent intensity. Cytokines interferon γ, interleukin 2, and tumor necrosis factor α were measured by intracellular cytokine staining after antigen-specific stimulation. Data were measured in 20 of 25 patients. Line graph shows the mean and standard deviation. Median fluorescent intensity was measured from the cytokine-positive population only (ie, median fluorescent intensity values ≥2000). (B) Functional characterization by antigen-specific cytokine responses: NY-ESO-1 SPEAR T cells produced cytokine in response to antigen stimulation, the level of which correlated with the transduction percentage. Before manufacturing, and therefore, in the absence of NY-ESO-1 SPEAR T cells (ie, day –50), there was no measurable response to antigen stimulation. Transduction efficiency of manufactured product, median (range): CD8+ T cells 18.85% (5.94%-46.5%), CD4+ T cells 14.83% (2.46%-44.83%). Data were measured in 22 of 25 patients. Day –50 = baseline peripheral blood sample. Box plot shows the mean and upper and lower quartiles. (C) Polyfunctionality: the percentage of CD4+ T cells and CD8+ T cells expressing interferon γ, interleukin 2, or tumor necrosis factor α; a combination of any 2 of the 3 cytokines; or all 3 cytokines in response to ex vivo stimulation with antigen-pulsed T2 cells were evaluated in paired PBMC and BM samples from a subset of patients (n = 11). The percentage of cytokine-positive cells producing 1 or more cytokines is displayed as a percentage of all cytokine-producing cells. Box plot shows the mean and upper and lower quartiles. (D) Expression of exhaustion markers: the percentage of CD4+ pentamer+ T cells or CD8+ pentamer+ T cells were evaluated for expression of 3 exhaustion markers (LAG3, PD1, and TIM3) in paired PBMC and BM samples from a subset of patients (n = 11). Line graph shows the mean and standard deviation. MP, manufactured product; PMA-IONO, phorbol myristate acetate + ionomycin (positive control); T2, T2 cells unpulsed (negative control); T2-NY-ESO, T2 cells pulsed with NY-ESO-1 peptide.
Functionality of NY-ESO-1 SPEAR T cells postinfusion. (A) Cytokine production: cytokine levels per cell were measured by median fluorescent intensity. Cytokines interferon γ, interleukin 2, and tumor necrosis factor α were measured by intracellular cytokine staining after antigen-specific stimulation. Data were measured in 20 of 25 patients. Line graph shows the mean and standard deviation. Median fluorescent intensity was measured from the cytokine-positive population only (ie, median fluorescent intensity values ≥2000). (B) Functional characterization by antigen-specific cytokine responses: NY-ESO-1 SPEAR T cells produced cytokine in response to antigen stimulation, the level of which correlated with the transduction percentage. Before manufacturing, and therefore, in the absence of NY-ESO-1 SPEAR T cells (ie, day –50), there was no measurable response to antigen stimulation. Transduction efficiency of manufactured product, median (range): CD8+ T cells 18.85% (5.94%-46.5%), CD4+ T cells 14.83% (2.46%-44.83%). Data were measured in 22 of 25 patients. Day –50 = baseline peripheral blood sample. Box plot shows the mean and upper and lower quartiles. (C) Polyfunctionality: the percentage of CD4+ T cells and CD8+ T cells expressing interferon γ, interleukin 2, or tumor necrosis factor α; a combination of any 2 of the 3 cytokines; or all 3 cytokines in response to ex vivo stimulation with antigen-pulsed T2 cells were evaluated in paired PBMC and BM samples from a subset of patients (n = 11). The percentage of cytokine-positive cells producing 1 or more cytokines is displayed as a percentage of all cytokine-producing cells. Box plot shows the mean and upper and lower quartiles. (D) Expression of exhaustion markers: the percentage of CD4+ pentamer+ T cells or CD8+ pentamer+ T cells were evaluated for expression of 3 exhaustion markers (LAG3, PD1, and TIM3) in paired PBMC and BM samples from a subset of patients (n = 11). Line graph shows the mean and standard deviation. MP, manufactured product; PMA-IONO, phorbol myristate acetate + ionomycin (positive control); T2, T2 cells unpulsed (negative control); T2-NY-ESO, T2 cells pulsed with NY-ESO-1 peptide.
Functional T-cell characterization was performed in 11 of 25 patients after infusion to evaluate the activity of the CD8+ T cells recognizing antigen (SLLMWITQC peptide pulsed onto T2 targets). Polyfunctionality of peripheral blood and bone marrow CD8+ T cells was evaluated in response to phorbol myristate acetate and ionomycin stimulation, and in response to unpulsed T2 target cells (data not shown). Antigen-specific polyfunctional CD8+ T cells (expressing at least 2 of the 3 cytokines measured) were present in the peripheral blood and bone marrow at days 21, 42, and 100 postinfusion (Figure 4C). Antigen-specific polyfunctional CD4+ T cells were present in the peripheral blood and bone marrow at days 21 and 42; however, at day 100, they were present in the peripheral blood but were not detected in the bone marrow in 2 of 3 patients tested (data not shown). Approximately 30% of NY-ESO-1 SPEAR T cells were polyfunctional in both the peripheral blood and bone marrow compartments.
Accumulation of exhaustion markers
NY-ESO-1 SPEAR T cells were evaluated for expression of the exhaustion markers lymphocyte activation gene-3 (LAG3; CD223), programmed death-1 receptor (PD1), and T cell immunoglobulin and mucin domain-3 (TIM3) in paired peripheral blood and bone marrow samples from 11 of 25 patients. Overall, the trends in LAG3, PD1, and TIM3 expression in CD4+ and CD8+ gene-modified T cells (pentamer+) were similar in each compartment (Figure 4D). In the peripheral blood, relative to levels in the manufactured product, the percentage of CD8+ pentamer+ T cells expressing TIM3 decreased after infusion up to day 100 postinfusion (data not shown). In addition to it being a T-cell exhaustion marker, TIM3 can also be expressed on activated T cells. This may explain the observation that the majority of gene-modified T cells in the manufactured product, which consists of activated T cells, expressed TIM3 (data not shown). The percentage of CD8+ pentamer+ cells expressing PD1 peaked at day 7 postinfusion. Minimal to no expression of LAG3 was observed in the manufactured product and at postinfusion points up to day 100.
Diversity in NY-ESO-1 SPEAR T-cell populations
TCR diversity postinfusion, a potential indicator of antigen-specific T-cell responses within the bone marrow, was evaluated via TCR Vβ CDR3 sequencing. In 12 of 14 pre- and posttreatment paired samples, a consistent decrease in TCR diversity (ie, decreased polyclonality) was observed postinfusion (Figure 5); no dominant population was seen in any sample. This suggests that clonal expansion of T cells may be occurring in the bone marrow, and may be an indirect indicator of antitumor reactivity.
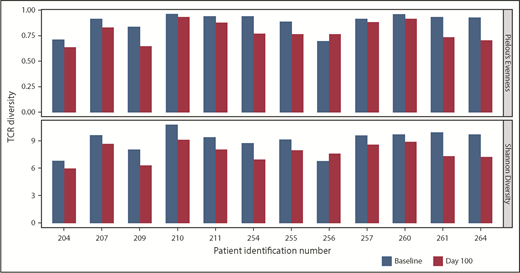
TCR clonality of T-cell response postinfusion. TCR clonality was assessed via Pielou’s Evenness Index (upper) and Shannon’s Diversity Index (lower). These indices were calculated using all TCR sequences evaluated for preinfusion manufactured product and the corresponding BM samples taken at day 100 postinfusion, and are shown for all patients in whom both baseline and day 100 samples were collected. Day 100 samples were not available for 2 patients, for whom the sample collected at the point closest to day 100 was analyzed.
TCR clonality of T-cell response postinfusion. TCR clonality was assessed via Pielou’s Evenness Index (upper) and Shannon’s Diversity Index (lower). These indices were calculated using all TCR sequences evaluated for preinfusion manufactured product and the corresponding BM samples taken at day 100 postinfusion, and are shown for all patients in whom both baseline and day 100 samples were collected. Day 100 samples were not available for 2 patients, for whom the sample collected at the point closest to day 100 was analyzed.
Discussion
NY-ESO-1 SPEAR T-cell therapy in the setting of ASCT was associated with long-term survival with a favorable safety profile and potential clinical activity in this cohort of 25 patients with relapsed, refractory, or high risk for relapse MM. This long‐term and expanded analysis demonstrated that the engineered T cells expanded in vivo, trafficked to bone marrow, demonstrated persistence, exhibited tumor antigen-directed functionality, and were associated with a long-term clinical response in a subset of patients. There were no fatal SAEs during this study, and the most common AEs (diarrhea, decreased appetite, nausea, fatigue, and thrombocytopenia) were consistent with ASCT. Although there were no reports of CRS, all patients had potential symptoms of CRS, and it is known that AEs may mask clinical diagnosis of milder cases of CRS post-ASCT.19 Six patients experienced and recovered from autologous GVHD that was possibly related to NY-ESO-1 SPEAR T-cell therapy. As described in our earlier report,19 we performed analyses of engineered T cells in inflamed and normal colonic tissue and peripheral blood in patients who developed autologous GVHD. Although engineered T cells were identified in inflamed tissue, they were at lower proportions in sites of inflammation than in adjacent noninflamed tissues, suggesting that gene-modified T cells were not principally driving the GVHD. Furthermore, we had previously observed autologous GVHD in the gut and skin after post-ASCT adoptive transfers of activated but non-gene-modified T cells.22 Autologous GVHD was not reported in another study with NY-ESO-1 SPEAR T cells.23 As of study interventional phase completion, 11 of 25 patients remained alive and 3 patients were disease progression-free at more than 3 years after NY-ESO-1 SPEAR T-cell therapy.
Functional studies characterizing the persistence of the engineered T cells, as demonstrated by detection of viable populations with functional activity, showed that the majority of patients with MM studied had detectable levels of NY-ESO-1 SPEAR T cells after 1 year of follow-up. There was also rapid infiltration of NY-ESO-1 SPEAR T cells into the bone marrow (ie, by day 7 postinfusion), with subsequent evidence of cell cycling/proliferation. These persisting NY-ESO-1 SPEAR T cells exhibited and maintained polyfunctionality postinfusion by producing multiple cytokines in response to antigen stimulation. In addition, exhaustion markers did not appear to accumulate in these persisting NY-ESO-1 SPEAR T cells, suggesting infused T cells could maintain functional activity against the antigen over prolonged periods (ie, up to 180 days postinfusion). Furthermore, there was evidence that SPEAR T cells were highly polyfunctional in bone marrow postinfusion. Similar results were shown in a study evaluating NY-ESO-1 SPEAR T cells in 10 patients with metastatic synovial sarcoma, in which 7 patients who were monitored beyond 200 days had detectable circulating NY-ESO-1 SPEAR T cells.23 In addition, persisting NY-ESO-1 SPEAR T cells (CD4+ and CD8+) in synovial sarcoma remained virtually negative (data not further specified) for exhaustion markers PD1 and LAG3. The persisting NY-ESO-1 SPEAR T cells in our study included highly differentiated effector subsets (EM and EMRA) and a population of self-renewing SCM cells, with the latter being associated with long-term persistence of functional T cells.24 Memory cell phenotypes in the metastatic synovial sarcoma study showed a similar pattern.23 The reduction in T-cell polyclonality observed in our study, which was reported as a decrease in the clonal diversity index over time, may indicate the emergence of a selected population of T cells, and may reflect effects from ASCT.25 However, it should be noted that the sequencing approach used here detected endogenous TCRs expressed on both transduced and nontransduced NY-ESO-1 SPEAR T cells from manufacturing, as well as native T cells; thus, it cannot be stated which T-cell population was expanding, only that overall diversity was decreasing.
This MM study identified a small subset of patients who achieved long-term clinical responses, and other patients in whom long-term NY-ESO-1 SPEAR T-cell persistence was demonstrated. Because of the small number of patients involved, it is currently unclear whether there is a relationship between long-term persistence of engineered T cells and a clinically relevant outcome (eg, absence of tumor antigen expression, PFS, and/or OS, etc). This is the first time that extended persistence of TCR-engineered T cells has been reported, with NY-ESO-1 SPEAR T cells detectable at up to 5 years postinfusion. Although the NY-ESO-1 SPEAR T cells administered in our study after a myeloablative preparative regimen and ASCT led to antitumor activity, the degree to which the engineered T cells contributed to the overall clinical benefit cannot be clearly determined in a single-arm study, as ASCT alone has antitumor activity. In addition, it is possible that lenalidomide maintenance may have contributed to the clinical responses observed and, conceivably, may have enhanced NY-ESO-1 SPEAR T-cell functions. Thus, further clinical trials are warranted, either with ASCT or as monotherapy after nontransplant conditioning. Given the acceptable safety profile and the evidence for clinical activity shown by our data, SPEAR T-cell therapy could also be considered for other NY-ESO-1–expressing malignancies.
The full-text version of this article contains a data supplement.
Acknowledgments
The authors acknowledge the inpatient and outpatient nursing staff of the University of Maryland and the University of Pennsylvania for the care of the patients; the clinical research staff; and, above all, the courageous patients who participated in this gene therapy trial. The authors would also like to acknowledge the following individuals: Samik Basu (translational studies oversight, Adaptimmune US), Frederic Bushman (integration site analysis, University of Pennsylvania), Eduardo Davila (initial T-cell phenotypic analysis, University of Maryland), Lilliam Fernandes (clinical trial support, Adaptimmune US), Alfred Garfall (clinical research, University of Pennsylvania), Tom Holdich (study physician, Adaptimmune UK), Frank Fang (assistance with statistical analyses, Adaptimmune US), Zoe Zheng (engineered T-cell manufacturing, Adaptimmune US), Bruce Levine (cell processing, University of Pennsylvania), Dan T. Vogl (clinical research, University of Pennsylvania), Carl June (regulatory support, University of Pennsylvania), and our colleagues at GSK. Medical writing assistance and editorial support for this manuscript were provided by José L. Walewski and Debra Brocksmith from the Envision Pharma Group, which was contracted and compensated by Adaptimmune.
The authors of this manuscript meet all the criteria for authorship suggested by the International Committee of Medical Journal Editors. The authors received no direct remuneration for the development of this manuscript.
This study was funded by Adaptimmune.
Authorship
Contribution: E.A.S., G.K.B., and A.P.R. designed the study; E.A.S., A.Z.B., K.D., and A.P.R. enrolled and followed patients in the study; T.H.F. and K.C. coordinated the study; R.A. was the Responsible Medical Officer for the study; D.E.L., L.M., J.-M.N., and R.W. performed the correlative analysis; M.I. and T.T. performed the statistical analysis; E.N. performed the evaluation and interpretation of safety data in the context of overall benefit:risk; E.A.S., T.H.F., D.E.L., and A.P.R. wrote the first draft; and all authors provided critical revisions, gave final approval, and agreed to be accountable for the work.
Conflict-of-interest disclosure: D.E.L., K.C., M.I., L.M., J.-M.N., E.N., T.T., R.W., and R.A. are employees of Adaptimmune and own stock or other ownership interests in Adaptimmune. T.H.F. and G.K.B. were employees of Adaptimmune at the time of this study. The remaining authors declare no competing financial interests.
The current affiliation for T.H.F. is GlaxoSmithKline, Collegeville, PA.
The current affiliation for G.K.B. is Caballeta Bio, Radnor, PA.
Correspondence: Aaron P. Rapoport, Marlene and Stewart Greenebaum Comprehensive Cancer Center, University of Maryland School of Medicine, 22 S Greene St, Baltimore, MD 21201; e-mail: arapoport@umm.edu.

