

Key Points
We describe a comprehensive computational biology modeling and digital drug simulation platform.
Somatic gene mutations and gene copy number variations found in individual patients were used for predictions of treatment responses.

Abstract
Patients with myelodysplastic syndromes (MDS) or acute myeloid leukemia (AML) are generally older and have more comorbidities. Therefore, identifying personalized treatment options for each patient early and accurately is essential. To address this, we developed a computational biology modeling (CBM) and digital drug simulation platform that relies on somatic gene mutations and gene CNVs found in malignant cells of individual patients. Drug treatment simulations based on unique patient-specific disease networks were used to generate treatment predictions. To evaluate the accuracy of the genomics-informed computational platform, we conducted a pilot prospective clinical study (NCT02435550) enrolling confirmed MDS and AML patients. Blinded to the empirically prescribed treatment regimen for each patient, genomic data from 50 evaluable patients were analyzed by CBM to predict patient-specific treatment responses. CBM accurately predicted treatment responses in 55 of 61 (90%) simulations, with 33 of 61 true positives, 22 of 61 true negatives, 3 of 61 false positives, and 3 of 61 false negatives, resulting in a sensitivity of 94%, a specificity of 88%, and an accuracy of 90%. Laboratory validation further confirmed the accuracy of CBM-predicted activated protein networks in 17 of 19 (89%) samples from 11 patients. Somatic mutations in the TET2, IDH1/2, ASXL1, and EZH2 genes were discovered to be highly informative of MDS response to hypomethylating agents. In sum, analyses of patient cancer genomics using the CBM platform can be used to predict precision treatment responses in MDS and AML patients.
Introduction
In recent years, next-generation sequencing has revealed a remarkable level of heterogeneity in the genetic landscape in patients with myelodysplastic syndromes (MDS) and acute myeloid leukemia (AML).1,2 Despite advances in understanding MDS and AML biology, cytotoxic chemotherapy remains the cornerstone of standard treatment. Because tolerance to such intensive treatments, especially in older adults, is often poor, the decision to administer or receive chemotherapy is complicated and is often accompanied by apprehension in physicians and patients alike.3,4 Thus, it is not surprising that only 30% to 50% of AML patients receive induction chemotherapy.5
Ideally, the choice to administer induction treatment should be informed by the patient’s MDS or AML disease biology, wherein specific molecular biomarkers would predict treatment responses or resistance with high probability. In this regard, studies have suggested that a TET2 gene mutation is associated with improved clinical outcomes in MDS patients following treatment with hypomethylating agents (HMAs).6,7 In retrospective analyses in AML, we and other investigators have shown that cytarabine-induced recurrent gene-expression patterns correlate with clinical outcomes.8,9 Although these findings have identified putative biomarkers predicting treatment response, validation in MDS and AML patients remains elusive.
In lieu of predictive biomarkers to assess treatment options for MDS and AML patients, the development of an algorithm with the ability to prospectively predict treatment responses in patients would prove helpful in differentiating cases prioritized for standard chemotherapy from those better suited for clinical trial referral. Such a predictive platform would assist in preventing patients from undergoing unnecessary chemotherapy regimens, thereby avoiding toxic side effects. By improving the accuracy of the choice of treatment selection, a predictive model would, in the long run, also help to reduce the high health care costs incurred by AML and MDS patients, thereby increasing health care system efficiency.10,11
Toward these goals, we developed a computational biology modeling (CBM) and digital drug simulation platform that relies on somatic gene mutations and gene copy number variations (CNVs) found in individual MDS or AML patients. Genomic abnormalities are converted by the computational system into patient-specific protein networks to generate a virtual disease model. The patient-specific disease models are then interrogated using a drug library via simulations based on mathematical modeling to predict inhibition of MDS or AML cell proliferation and survival. Leading up to this pilot prospective study, we conducted a retrospective analysis and found a high degree of accuracy using the CBM method in matching treatment responses in patients diagnosed with MDS with their actual clinical outcomes.12 Encouraged by these findings, we aimed to prospectively define the predictive value of our computational platform in patients with AML and MDS. In this article, we present the results of our pilot prospective clinical study.
Methods
Study design
iCare for Cancer Patients (iCare 1) is a prospective nonrandomized single-arm prediction-masked open-label clinical trial (NCT02435550). All procedures relating to study conduct, evaluation, and documentation were in accordance with Good Clinical Practice and complied with ethical principles outlined in the Declaration of Helsinki. The study protocol was approved by the University of Florida Institutional Review Board (IRB201500073). All patients provided written informed consent before participating in the study and received treatment according to standard-of-care options at the discretion of the attending physician. To be eligible for efficacy assessment, patients were required to have received one of the following treatment regimens: a minimum of 4 cycles of an HMA, 2 cycles of lenalidomide, 2 cycles of targeted therapy, or 1 cycle of high-intensity chemotherapy. A restaging bone marrow (BM) biopsy and complete blood count were also required for evaluation of treatment response.
Patients
Patients aged ≥18 years with a diagnosis of MDS, or de novo or secondary AML, regardless of risk category, were enrolled in the study between June 2015 and July 2017 at the University of Florida. All individuals were required to have measurable disease defined as ≥5% myeloblasts in the BM, ≥5% myeloblasts in peripheral blood (PB), or ≥5% large unstained cells in PB.
BM and PB sampling
Consistent with standard clinical care, patients underwent BM aspirates and/or PB draws for disease assessment at diagnosis (baseline) and following treatment initiation for response assessment (follow-up). Samples from consenting patients were collected and stored in a malignant hematology biorepository (UF IRB201501063) for subsequent molecular validation studies (UF IRB201600284).
Genomic interrogation
Patient samples, BM or PB obtained during standard clinical care, were processed in the UF Health Shands Hospital Pathology Laboratory for morphology assessment, flow cytometry, cytogenetic karyotyping, and fluorescence in situ hybridization (FISH) testing using standard protocols.
The remaining sample (<1 mL) was subjected to genomic DNA isolation (QIAamp DNA Blood Mini Kit; QIAGEN, Hilden, Germany) for exome sequencing (ES) and CNV analysis (MOgene, St. Louis, MO; Otogenetics Corporation, Atlanta, GA). Illumina libraries were made from qualified fragmented genomic DNA using a SPRIworks HT Reagent Kit (catalog no. B06938; Beckman Coulter, Indianapolis, IN), and the resulting libraries were subjected to exome enrichment using SureSelect All Exon kits (OneSeq, Clinical Research Exome or V5; Agilent Technologies, Wilmington, DE), following the manufacturer’s instructions. Enriched libraries were tested for enrichment by quantitative polymerase chain reaction and for size distribution and concentration using an Agilent Bioanalyzer 2100. The samples were then sequenced on an Illumina HiSeq 2500, which generated paired-end reads of 125 nucleotides. Data were analyzed for data quality using FASTQC (Babraham Institute, Cambridge, United Kingdom). Variant calling was performed by Farsight Genome Systems. Variant annotation was accomplished through scripts that assembled annotations from 1000 Genomes, ClinVar, ESP, gnomAD, and ExAC, as well as protein predictions from LRT, MetaLR, MetaSVM, Mutation Assessor, PROVEAN, fathmm, MutationTaster, SIFT, and PolyPhen. All variants with deleterious or unknown impact on protein function were reported. Common polymorphisms that were nondeleterious to protein function were excluded.
CBM for MDS and AML
CBM used in this study is a comprehensive network of signaling, metabolic, epigenetic, and transcriptional regulatory pathways underlying cancer physiology.12-15 The network is created through a rigorous workflow of manually curating and aggregating published experimental data and representing the functionality of the genes, proteins, and interactions mathematically, using ordinary differential equations. The CBM includes 112 pathways, >85 000 reactions, and 3300 cancer specific-genes, including comprehensive coverage of the kinome, transcriptome, proteome, and metabolome. This integrated network that makes up the CBM can be used to predict a patient’s response to a single drug or a combination of drugs. Both prospective and retrospective validations have been shown in multiple indications, including studies in glioblastoma multiform, multiple myeloma, and myeloproliferative neoplasms.12-16
In this study, ES- and CNV-derived genomic data, together with karyotypic (cytogenetics, FISH) data, were prospectively collected from individual patients. Comprehensive genomic data collected were entered into the CBM platform (Cellworks Group) to generate a patient-specific protein network map of the disease (Appendix).
Computational protein network maps, showing activated and deactivated networks and their intersections, were generated for each patient based on their MDS or AML genomic data. Using these computational maps, mathematical modeling of MDS or AML cell proliferation or inhibition was simulated for each patient. The cell proliferation index is an average function of the active CDK-cyclin complexes that define cell cycle checkpoints and was quantified by calculating permutations of the biomarkers CDK4-CCND1, CDK2-CCNE, CDK2-CCNA, and CDK1-CCNB1. A cell viability index based on cell survival and apoptosis was also generated for each patient. The biomarkers constituting the survival index included AKT1, BCL2, MCL1, BIRC5, BIRC2, and XIAP, whereas the apoptosis index included BAX, CASP3, NOXA, and CASP8. The overall viability index of a cell was calculated as the ratio of survival index/apoptosis index. The weight of each biomarker was adjusted to mitigate against over- or underweighting.
Members of the CBM modeling team were masked to clinical outcomes. All patients received treatment according to standard-of-care options at the discretion of the treating physician.
Digital drug simulations using the CBM platform
The CBM model was initially mathematically simulated until the system reached a homeostatic steady-state and was considered to be a nondisease or control state. Then, for each patient, the control state was triggered into a disease state by introducing the patient’s MDS or AML somatic gene mutations and gene CNVs. The mathematical model was further simulated to achieve a disease steady-state. Each mutation’s weight in the patient’s computational model was adjusted so that all mutations contributed to the disease steady-state. Thus, for each patient, disease end points of MDS or AML cell proliferation and viability were assessed.
All digital drug treatments were performed on disease steady-state conditions to quantify the extent that the drugs returned diseased cell indices (proliferation, viability) back to the control state. For each case, a disease inhibition score was calculated using the following formula:
If a specific drug normalized diseased cell indices (proliferation, viability) in a dose-dependent manner to a disease inhibition <20%, then the patient’s disease was predicted to be a responder to drug treatment. If, on the other hand, the drug in the patient’s model did not normalize cell proliferation or viability below the threshold disease inhibition score, the disease was predicted to be a nonresponder to drug treatment.
A digital drug library of 67 US Food and Drug Administration–approved drugs was generated by programming the mechanisms of action of each individual drug established from the published literature.
Protein network analysis
To validate the CBM-predicted protein network aberrations, a Wes capillary system (12-230 kD Wes Separation Module kit; SM-W004; Protein Simple) was used to isolate proteins from 11 patient samples, as per the manufacturer’s protocol. Samples were stored at −80°C for use at a later time.
Western blot analysis was next performed on the protein samples using standard protocols. The following antibodies were used: anti-rabbit PIK3CA (4255), anti-rabbit phospho-Erk1/2 Thr202/Tyr204 (4377), and rabbit Erk1/2 (9102; all from Cell signaling Technology), as well as GAPDH (sc-25778; Santa Cruz Biotechnology) as a control. Correlation between western blot assays (actual responses) and CBM predictions of biomarker impact was assessed and recorded.
Clinical outcome measures
The treating physicians and patients were masked to the predictions of the CBM platform and vice versa. The efficacy outcome of the overall response rate to treatment was defined in AML as the achievement of complete remission, complete remission with incomplete count recovery, or partial remission, according to National Comprehensive Cancer Network Clinical Practice Guidelines in Oncology AML 2017 criteria.17 For MDS, overall response rate was defined as the achievement of complete remission, partial remission, and/or hematological improvement, according to International Working Group 2006 criteria.18 Responses to treatment regimens listed above were recorded. The performance of the CBM platform was evaluated via confusion matrix and receiver operating characteristics (ROC) curve. The confusion matrix calculations included the following definitions:
where TP (true positive) is a clinical responder predicted as a responder, TN (true negative) is a clinical nonresponder predicted as a nonresponder, FP (false positive) is a clinical nonresponder predicted as a responder, and FN (false negative) is a clinical responder predicted as a nonresponder.
Statistical analyses
The effectiveness of the CBM platform was evaluated by comparing the predicted drug responses of the MDS and AML patients with the actual clinical outcomes of treated patients. Using the results presented in Figure 4, we performed hypothesis tests to determine whether CBM-based predictions were significantly more accurate than the accuracy of empiric drug administration. Fisher’s exact test was used based on the sample sizes in Figure 4. P ≤ .05 was considered significant.
The statistical analyses also involved the calculation of effective sample size for testing the CBM predictive power to demonstrate its reliability/robustness based on the results from this prospective trial (for level of significance = 5%).
Results
Overview of the study, patient details, and baseline characteristics
This study was designed to assess the biological and clinical predictive values of the genomics-informed CBM platform in patients with MDS and AML by comparing CBM-generated predictions of treatment responses with actual treatment responses (Figure 1).
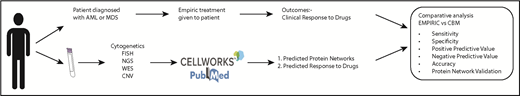
Study schema of the iCare 1 clinical study. NGS, next-generation sequencing; WES, whole-exome sequencing.
Study schema of the iCare 1 clinical study. NGS, next-generation sequencing; WES, whole-exome sequencing.
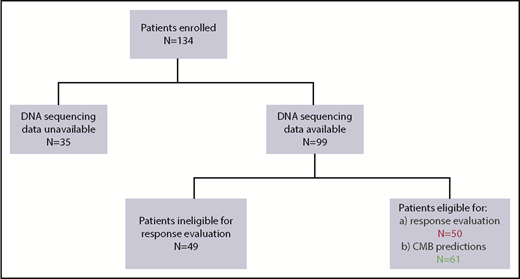
Between June 2015 and December 2017, 134 patients were enrolled in the iCare 1 prospective clinical study at the University of Florida. Of these, ES, CNV, and karyotype data were available for 99 of 134 (74%) patients. Thirty-five of the 134 patients (26%) were ineligible for the study as a result of sample inadequacy and were excluded. CBM analysis was conducted for the remaining 99 patients. Fifty (50%) of the 99 patients met eligibility criteria for clinical response evaluation at the time of data cutoff, whereas 49 did not (Figure 2; supplemental Table 1). Baseline demographics and clinical characteristics of the 50 eligible patients are summarized in Table 1 and supplemental Table 1. These patients had a median age of 66.5 years (range, 42-90 years); 15 (30%) patients had MDS, 33 (66%) patients had AML (including 21 [42%] patients with de novo AML and 12 [24%] patients with secondary AML), 1 (2%) patient had chronic myelomonocytic leukemia-2, and 1 (2%) patient was diagnosed with myelofibrosis. Cytogenetics were complex in 31 (62%) patients and uninformative in 17 (34%) patients. Common myeloid gene mutations occurring at a frequency ≥20% are detailed in supplemental Table 1 and are summarized for the 50 evaluable patients in Figure 3. The average number of genomic abnormalities (gene mutations and gene CNVs) per patient for the 50 participants was 269 (range, 22-983) (supplemental Table 1). Specimens for proteomic analysis were available for only 11 of 50 (22%) of clinically evaluable participants, because 39 patients did not have adequate samples for our study.
Baseline and clinical characteristics of 50 evaluable participants in the iCARE1 clinical study
| Characteristics | Data |
|---|---|
| Age, median (range), y | 66.5 (42-90) |
| Sex | |
| Female | 25 (50) |
| Male | 25 (50) |
| Disease and origin | |
| MDS | 15 (30) |
| AML | 33 (66) |
| De novo | 21 (64) |
| Secondary | 12 (36) |
| CMML-2 | 1 (2) |
| Myelofibrosis | 1 (2) |
| Diagnosis | |
| Newly diagnosed | 34 (68) |
| Relapsed/refractory | 16 (32) |
| Prior therapy | |
| No | 20 (40) |
| Yes | 30 (60) |
| Cytogenetics | |
| Uninformative | 17 (34) |
| Complex | 31 (62) |
| Other | 2 (4) |
Unless otherwise noted, all data are n (%).
CMML-2, chronic myelomonocytic leukemia-2.
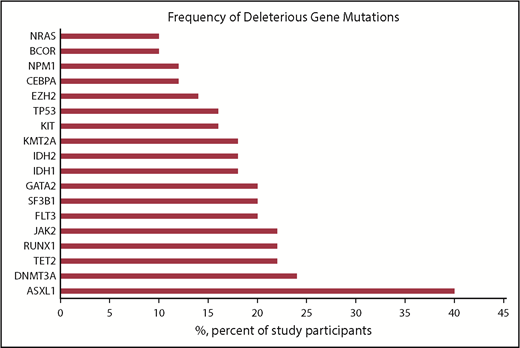
Frequency of common deleterious myeloid gene mutations detected in 50 clinically evaluable patients with MDS or AML.
Frequency of common deleterious myeloid gene mutations detected in 50 clinically evaluable patients with MDS or AML.
CBM predictions and correlation with clinical responses
Sixty-one CBM-based drug predictions were generated prospectively for the 50 clinically evaluable patients (supplemental Table 1); these 50 patients had been prescribed 61 drug regimens by the treating physicians who were blinded to the CBM predictions. Treatment included 7 days of infusional cytarabine and 3 days of anthracycline (7+3), high-dose cytarabine (HiDAC), cytarabine plus fludarabine, lenalidomide, azacitidine, decitabine, bortezomib, ruxolitinib, imatinib mesylate, or vorasidenib.
CBM accurately predicted clinical drug responses in 55 of 61 treatments with an overall accuracy of 90%. The confusion matrix highlights the performance of CBM (Figure 4). Compared with the empiric drug prescriptions prescribed by the treating physicians, CBM-based predictions resulted in a significantly higher accuracy overall in terms of the responder and nonresponder treatment outcomes (P = 6.416E−05). Of the 55 correct predictions, 33 were TP clinical response predictions, and 22 were TN. Of the 6 incorrect predictions, 3 were FP and 3 were FN response predictions. Based on these findings, the CBM prediction sensitivity was calculated to be 91.67%, and specificity was 88%, with a PPV of 91.67% and an NPV of 88% (see “Methods” for definitions).
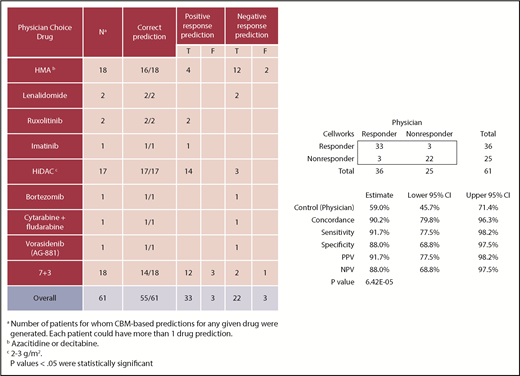
Prediction values of CBM predictions compared with actual clinical outcomes in terms of actual clinical improvement (TP response) and no clinical improvement (TN response). The 95% confidence interval (CI) was calculated using the Clopper-Pearson test.
Prediction values of CBM predictions compared with actual clinical outcomes in terms of actual clinical improvement (TP response) and no clinical improvement (TN response). The 95% confidence interval (CI) was calculated using the Clopper-Pearson test.
Considering the use of first-line standard-of-care therapy for patients with AML (7+3), CBM correctly predicted patient response to therapy in 14 of 18 (78%) cases, 17 of 17 (100%) HiDAC cases, and 16 of 18 (89%) HMA cases (ie, azacitidine, decitabine). Considering all other drugs prescribed together, CBM correctly predicted responses in all 8 (100%) cases. Of note, CBM performed accurately in treatment-naive patients and those with relapsed/refractory disease (supplemental Table 1).
The performance of the CBM platform was further evaluated using an ROC curve that used the disease-inhibition score (DIS), an output from CBM. The area under the ROC was 0.9, which highlights the very good predictive capability of CBM (Figure 5A).
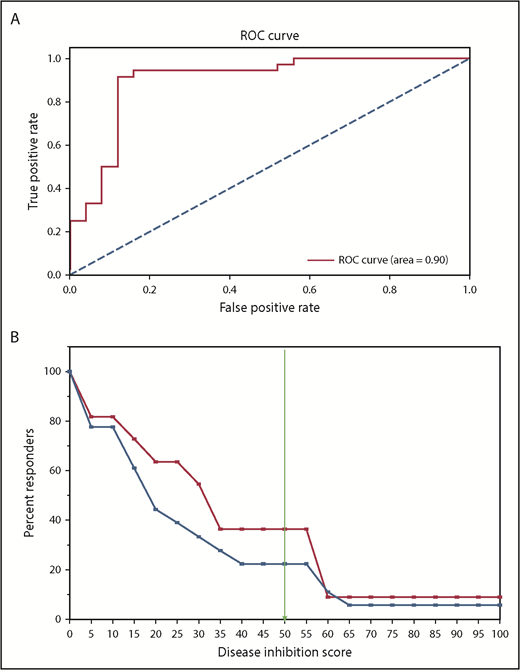
Statistical analysis of CBM prediction. (A) ROC curve used the DIS, an output from CBM, to generate area under the receiver operating characteristics = 0.9. (B) A Kaplan-Meier–like estimate of digital simulation on the 18 patients treated with HMA. The x-axis measures the predicted DIS, and the y-axis denotes the percentage of patients predicted to achieve the simulated DIS based on disease biology. The blue line represents all patients in the cohort, regardless of genomic aberrations (N = 18); the red line denotes patient profiles that had the genetic signature of WT ASXL1, TET2, or IDH1/2 mutation, and mutant EZH2 (n = 11).
Statistical analysis of CBM prediction. (A) ROC curve used the DIS, an output from CBM, to generate area under the receiver operating characteristics = 0.9. (B) A Kaplan-Meier–like estimate of digital simulation on the 18 patients treated with HMA. The x-axis measures the predicted DIS, and the y-axis denotes the percentage of patients predicted to achieve the simulated DIS based on disease biology. The blue line represents all patients in the cohort, regardless of genomic aberrations (N = 18); the red line denotes patient profiles that had the genetic signature of WT ASXL1, TET2, or IDH1/2 mutation, and mutant EZH2 (n = 11).
The effective sample size required to demonstrate the reliability/robustness of the CBM prediction, with an accuracy of 90% and a statistical power of 90%, was calculated to be 22 (N) for an effect size of 40%. The calculated effective sample size (N = 22) is much less than the number of evaluated patients (N = 50) in this prospective trial, which signifies that the number of predictions made by CBM are sufficient to demonstrate its predictive power (supplemental Table 4).
Confirmation of protein network biomarker predictions by western blot analysis
Nineteen samples derived from 11 patients were available for laboratory validation of CBM-predicted activated protein networks and biomarkers therein. We selected 4 biomarkers frequently activated in cancer cells (AKT2, AKT3, PIK3CA, and ERK1/2). These biomarkers were interrogated by western blot analysis for activation, as measured by changes in their phosphorylation status. When matching CBM predictions of activated proteins to actual activated proteins, the CBM method accurately matched 17 of 19 (89%) (Figure 6). An example of CBM-predicted increased PIK3CA activity, as measured by increased phosphorylation of PIK3CA in a western blot, is shown in Figure 7 for 3 patient samples compared with a healthy BM control. Two of the 3 patient samples demonstrated increased phospho-PIK3CA protein levels.
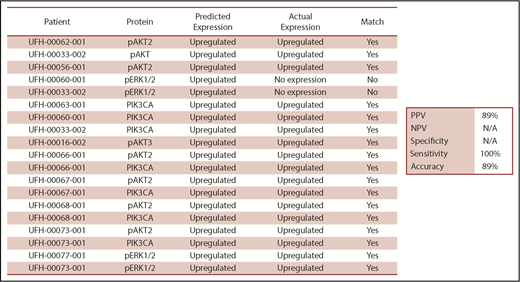
Comparison of iCare predictions matched with actual expression of selected malignancy-associated proteins. N/A, not applicable.
Comparison of iCare predictions matched with actual expression of selected malignancy-associated proteins. N/A, not applicable.
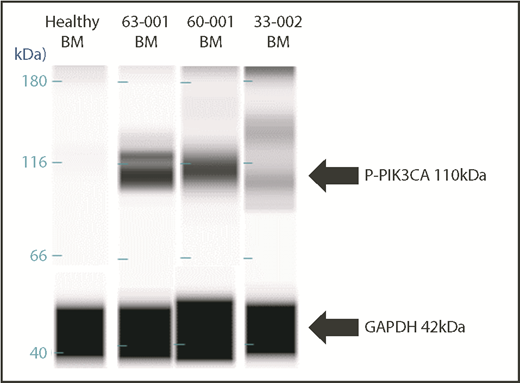
Western blot validation of CBM-predicted protein network activation. Upregulation of the 110-kDa PIK3CA protein in BM samples of 3 patients compared with normal BM from a healthy control subject.
Western blot validation of CBM-predicted protein network activation. Upregulation of the 110-kDa PIK3CA protein in BM samples of 3 patients compared with normal BM from a healthy control subject.
CBM prediction accurately pinpoints treatment responses in an MDS patient
As an example, illustrating the efficacy of the CBM platform in predicting drug responses, we describe the genomic analysis of an MDS patient treated with azacitidine. As shown in Figure 8A, a CBM-derived protein network map of the patient (ID: UFH-00012-001) was generated with gain-of-function mutations affecting EZH2, KRAS, IDH1/2, MYC, and CTNNB1 and loss-of-function mutations affecting ASXL1, CEBPA, TP53, DNMT3A, L3MBTL1, APC, and TET2. The CBM network prediction functions on the premise that all deleterious mutations with previously identified functional calls have an impact on the generated disease network. Based on this edict, gain-of-function mutations in IDH1/2 and EZH2 were predicted to contribute to increased cytosine guanine dinucleotide (CpG) methylation in this patient. Additionally, loss-of-function mutations in TET2 (involved in DNA demethylation) and L3MBTL1 (histone methyl-lysine binding protein) were further predicted to increase CpG methylation (Figure 8A, gray box). Consequently, azacitidine, which inhibits CpG methylation via DNMT1 (DNA methyltransferase 1), was predicted to target the enhanced CpG methylation status in our virtual drug simulation CBM analysis. Therefore, this patient was predicted to be a responder to azacitidine, a potent HMA. In fact, azacitidine had been empirically prescribed to the patient by the attending physician and had resulted in a complete response (Figure 1; supplemental Table 1), thereby validating the predictive usefulness and accuracy of the CBM platform.

Mechanisms of response to HMA therapy. (A) Protein network model of a relapsed AML patient with gain-of-function mutations affecting EZH2 and IDH1/2 that predicted for response to the CpG-methylating effects of azacitidine via DNMT1 inhibition. Additionally, loss-of-function mutations in TET2 and L3MBTL1 further increased CpG methylation. The patient achieved a clinical response to azacitidine. Green boxes represent gain of function; blue boxes represent loss of function. (B) An example of a nonresponder to HMA who harbored gain-of-function mutations in IDH1/2 and loss-of-function mutations in ASXL1 and TET2, among others. Green boxes represent gain of function, light blue boxes represent loss of function, and dark blue boxes represent knockdown.
Mechanisms of response to HMA therapy. (A) Protein network model of a relapsed AML patient with gain-of-function mutations affecting EZH2 and IDH1/2 that predicted for response to the CpG-methylating effects of azacitidine via DNMT1 inhibition. Additionally, loss-of-function mutations in TET2 and L3MBTL1 further increased CpG methylation. The patient achieved a clinical response to azacitidine. Green boxes represent gain of function; blue boxes represent loss of function. (B) An example of a nonresponder to HMA who harbored gain-of-function mutations in IDH1/2 and loss-of-function mutations in ASXL1 and TET2, among others. Green boxes represent gain of function, light blue boxes represent loss of function, and dark blue boxes represent knockdown.
Identification of a new genomic signature for HMA treatment response
An additional feature of the CBM platform is its ability to derive novel inferences related to specific networks contributing to drug responses. For instance, when analyzing 18 patients who had received HMA treatment (supplemental Table 1), we noted 2 of 7 MDS patients whose disease was clinically unresponsive to HMA treatment, despite the presence of a TET2 mutation. This observation was in contrast to recent publications reporting a higher response of TET2-mutant MDS patients to HMA treatment.6,17 To address this, we used the CBM platform to virtually dissect intracellular pathways to explain this apparent paradoxical drug response. We noted a distinct genetic pattern in the HMA-unresponsive patients, with the presence of an ASXL1 mutation along with TET2 or IDH1/2 mutations but with a normal EZH2 gene. As observed in Figure 8B, patient UFH-00012-002 had gain-of-function mutations affecting the IDH1/2 and CTNNB1 genes, coupled with loss-of-function mutations affecting ASXL1, TP53, DNMT3A, NF1, APC, and TET2 genes (supplemental Table 1). Our CBM-based simulation predicted that loss-of-function mutations in ASXL1 and DNMT3A contributed to decreased CpG methylation. Furthermore, loss of TET2 function and gain of IDH1/2 function did not appear to compensate for the predicted decrease in CpG methylation, leading to diminished CpG target levels on which azacitidine could act (reviewed in El Fakih et al19 ) (Figure 8B). Hence, this patient was predicted to be a nonresponder to azacitidine. The patient had indeed failed to achieve clinical improvement following empirically prescribed treatment with azacitidine, lending further credence to the predictive effectiveness of the CBM platform.
To test the hypothesis that ASXL1 and EZH2 mutation status impacts HMA treatment response, our CBM platform was used to perform an in silico trial comparison using genomic data from patients in the study. MDS and AML patients whose disease harbored ASXL1 mutations, TET2 or IDH1/2 mutations, and EZH2 wild-type (WT; n = 7) were compared with patients harboring WT ASXL1, TET2, or IDH1/2 mutations, and mutant EZH2 (n = 11). These 2 genomic signatures were compared because of their higher representation in our clinical cohort (Figure 3).
In traditional clinical trials, the goal is usually to determine whether 2 distinguishable cohorts of patients can be segregated based on their responses to a particular drug. The survival period following drug administration is usually plotted as a Kaplan-Meir curve, and it is commonly used as a measure of the drug’s effectiveness. Here, we used DIS, a measure of the extent of disease inhibition simulated by the CBM platform, as a surrogate for survival. A higher DIS is more likely to be associated with better patient responses. To determine the mutational status of a patient’s predicted response to an HMA drug (azacitidine), DIS values were plotted against the percentage of responders in each cohort (Figure 5B). At a threshold of 50, the DIS plot showed that 38% of the patients segregated based on their specific genetic profile (ASXL wt_EZH2mut), whereas 21% segregated with other patients in the cohort, including ones harboring the ASXL mut_EZH2 WT genetic profile (blue line). This virtual analysis suggests that fewer patients with ASXL1 mutation/EZH2 WT (blue line) are predicted to respond to HMA treatment compared with patients with ASXL1 WT/EZH2 mutant (red line). Thus, we submit that ASXL1 and EZH2 mutation status deserves prospective validation in predicting HMA treatment response in MDS and AML patients.
Discussion
In this article, we demonstrate high accuracy of a genomics-informed CBM platform to prospectively predict treatment outcomes in patients with MDS and AML. Our computational method differs from other precision oncology methods in that it has the ability to highlight intracellular networks responsible for treatment sensitivity or resistance. Of particular interest is the ability of the CBM platform to predict multiple genetic factors contributing to drug response. Whereas a previous report identified TET2 mutations as a biomarker for a positive response to the HMA azacitidine or decitabine,6 the CBM platform was able to identify concurrent mutations found in TET2-mutant azacitidine nonresponders, specifically in the ASXL1 and EZH2 genes that likely alter the azacitidine drug response, thus providing a rationale for the failure of azacitidine in ASXL1-mutant EZH2-WT patients. This feature of the CBM platform has enormous potential in identifying genetic signatures corresponding to drug responses and informing precision enrollment in clinical trials and in clinical practice.
The CBM method used in this study contrasts with in vitro chemosensitivity,20 in vivo patient-derived xenograft assays21 which are limited to examining cellular responses in a finite number of drugs or drug combinations. Such studies tend to lack mechanistic insights into patient-specific cancer biology, which are featured in the computer-generated network map. Compared with these in vitro/in vivo assays, the computational method can also test a larger number of drugs and drug combinations within seconds after disease model creation. Moreover, the model can serve as the patient’s own immortal digital cell line that can be revived instantaneously to test drug or drug combinations at the behest of treating physicians. However, it may be prudent to use a combination approach involving computational modeling with in vitro chemosensitivity and in vivo patient-derived xenograft assays to improve the predictive power of drug efficacy, as we have recently demonstrated in a proof-of-concept case.22
Although the computational power of the CBM platform is informative and could advise physicians of the best choice of drug for a given patient, the inability to identify appropriate drug dosages remains a major limitation. Further refinement of this platform with data inputs from clinical trials, as well as other sources, could potentially limit this current caveat in the near future.
In sum, the results from this study provide promising data on drug-treatment responses in a prospectively recruited cohort of MDS and AML patients. This pilot study will serve as the basis of an upcoming randomized clinical trial in which CBM-based drug selection will be compared with conventional-care regimens in patients with MDS.
Interim analysis data were presented in abstract form at the 59th annual meeting of the American Society of Hematology, Atlanta, GA, 11 December 2017.
The full-text version of this article contains a data supplement.
Acknowledgments
The authors thank Howard Christian for providing medical writing support in accordance with Good Publication Practice (GPP3) guidelines and Robinson Vidva for creating the visual abstract and figures.
This work was supported in part by the Harry P. Mangurian Foundation and the Spanier Foundation. Funding for medical writing was provided by Cellworks Group. L.M.D. and C.R.C. were supported by a Gateway for Cancer Research Foundation grant (G-15-700). C.R.C. was supported by a Scholar in Clinical Research Award from the Leukemia and Lymphoma Society (2400-13) and a grant from the Gatorade Trust, which is administered by the University of Florida Department of Medicine. J.K.L. is supported by National Institutes of Health, National Cancer Institute grant R01 CA132946. L.M.D. received support from the University of Florida Clinical and Translational Science Institute (National Institutes of Health, National Center for Advancing Translational Sciences grant UL1 TR001427).
Authorship
Contribution: C.R.C. designed the study and wrote the manuscript; L.M.D., K.E.H., C.S., M.T., E.A.W., A.M., S.R., and V.V. processed samples, analyzed and interpreted data, produced figures, and wrote the manuscript; G.G.A. and C.C.K. analyzed data; S.R., Y.U., N.K.S., H.S., P.N., T.A., and S.V. analyzed and interpreted data and produced figures; N.K.S., A.K.-G., and S.V. wrote and edited the manuscript; S.G. interpreted data, performed statistical analysis, and wrote the manuscript; P.C., H.L.L., C.T., C.C., L.P., N.F., H.S.M., B.N.H., J.K.L., R.A.B., M.N., J. W. Hiemenz, J. W. Hsu, W.B.S., J.S.M., and J.R.W. recruited and treated patients, measured clinical outcomes, and wrote the manuscript; and all authors reviewed and approved the manuscript.
Conflict-of-interest disclosure: G.G.A. and C.C.K. are employees of Farsight Genome Systems, Inc. N.K.S., S.R., Y.U., A.T., H.S., P.N., T.A., and S.V. are employees of Cellworks Group, Inc. A.K.-G. is a consultant with Cellworks Group, Inc. The remaining authors declare no competing financial interests.
Correspondence: Christopher R. Cogle, University of Florida, 1600 SW Archer Rd, P.O. Box 100278, Gainesville, FL 32610; e-mail: christopher.cogle@medicine.ufl.edu.
Appendix: creation of patient profiles
In this study, ES- and CNV-derived genomic data, together with karyotypic (cytogenetics, FISH) data, were prospectively collected from individual patients. Genomic aberrations were interpreted for phenotypic implications (ie, gain of function vs loss of function). The cytogenetic segments related to deletions, gains, translocations, or derivatives were interpreted as amplifications and deletions of the genes residing in those segments. The genes found on the loci of these affected regions of the chromosome are extracted from the human reference genome at ENSEMBL. The complete list of genes is matched with the CBM to identify those that are to be represented in the model. All genes that have coverage in the model are included in the input file that is used to create the patient cancer avatar. Genes reported to have a gain in copy number due to chromosomal amplifications are interpreted as being overexpressed at the gene expression level, whereas those genes in the deleted segments are considered a loss of copy number and are interpreted as having a knockdown in the model.
For mutation signatures, the gene variants with known functional impact and therapeutic implication are searched in the public domain and are recorded in a mutation library. Mutational signatures are processed through our internal variant calling workflow that utilizes DbNFSP, a database that uses multiple prediction algorithms including SIFT, FATHMM, Mutation Assessor, LRT, Mutation Taster, PROVEAN, MetaSVM, and others, to determine whether the gene mutation will have a functional impact on the protein, which will be classified as deleterious or nondeleterious based on a concordance of >5 algorithms.23-27 A deleterious mutation in an oncogene is assumed to be a gain-of-function mutation at the protein activity level or a loss of function if present in a tumor-suppressor gene. Frameshift and missense mutations are assumed to cause a loss of protein function except in those cases where there is experimental evidence that the mutation causes a gain of function.
Finally, this input file is overlaid on the control model (nontumorigenic baseline) by indicating the gene mutations, amplifications, deletions, and translocations, and the profile is simulated as per the rules outlined above to create a dynamic disease state. Protein network maps are created for each patient profile based on their input data and disease-specific biomarkers that are unique to each profile.

