

Key Points
CyBorD DARA as induction is well tolerated and induces deep responses when used in conjunction with ASCT for MM.
Mechanism of action studies indicate that CyBorD DARA enhances macrophage activation, which may play a role in its clinical efficacy.

Abstract
Daratumumab (DARA) has shown impressive activity in combination with other agents for the treatment of multiple myeloma (MM). We conducted a phase 1b study to assess the safety and preliminary efficacy, as well as potential mechanisms of action, of DARA (16 mg/kg) in combination with a weekly schedule of subcutaneous bortezomib (1.3-1.5 mg/m2), cyclophosphamide (150-300 mg/m2), and dexamethasone (40 mg) (CyBorD DARA) as initial induction before autologous stem cell transplantation (ASCT). Eligible patients were ≤70 years of age with untreated MM requiring treatment and who lacked significant comorbidities. A total of 18 patients were enrolled. Their median age was 56 years (range, 32-66 years), and all patients had Eastern Cooperative Oncology Group performance status ≤1. The International Staging System stages were I, II, and III in 78%, 17%, and 6% of patients, respectively; 28% of patients had high-risk genetic features. There was no dose-limiting toxicity, and the incidence of grade 3 or 4 infection or neutropenia was <10%. On an intention-to-treat basis, 94% achieved ≥very good partial response with ≥complete response in 44% of patients. Among 14 of 15 patients who underwent ASCT and were evaluable for response, all 14 achieved at least very good partial response, with 8 (57%) of 14 achieving complete response. After ASCT, 10 (83%) of 12 patients in whom minimal residual disease analysis was possible were negative at a sensitivity of 10−5 (56% on intention-to-treat/whole study population) according to next-generation sequencing. Flow cytometry analysis of patient samples indicated CyBorD DARA induced activation of macrophage-mediated antibody-dependent cellular phagocytosis. This trial was registered at www.clinicaltrials.gov as #NCT02955810.
Introduction
Daratumumab (DARA), a human immunoglobulin G 1 kappa (IgG1κ) monoclonal antibody with single-agent activity in multiple myeloma (MM), exhibits strong synergy in combination with other anti-MM agents, including immunomodulatory drugs (IMiDs) and proteasome inhibitors (PIs). As previously reported in four phase 3 studies, the addition of DARA to standards of care in both relapsed refractory or transplant-ineligible patients with newly diagnosed MM resulted in a ≥45% reduction in the risk of disease progression or death.1-4 Thus, there is considerable interest in exploring DARA in combination with existing regimens for fit, transplant-eligible patients in whom induction followed by high-dose therapy with autologous stem cell transplantation (ASCT) is currently the standard of care.5 Based on response rates, depth of response, and progression-free survival as surrogate markers for outcome, 3-drug combinations including a PI and dexamethasone are currently the standard of care before ASCT.6 Given recent impressive results with triplet regimens incorporating a PI and an IMiD in induction, it is generally accepted that a PI/IMiD combination constitutes the ideal backbone with which to combine DARA before ASCT. Conversely, cyclophosphamide, a drug commonly used in the treatment of MM, is frequently partnered with monoclonal antibodies in approved regimens for the treatment of hematologic malignancies. Indeed, cyclophosphamide has been shown to induce an acute secretory activating phenotype, releasing chemokines and cytokines from treated tumor cells, which in turn induce macrophage infiltration and phagocytic activity in the bone marrow.7 After the generation of preliminary data indicating that cyclophosphamide may have the potential to enhance DARA macrophage-mediated antibody-dependent cellular phagocytosis (ADCP), we hypothesized that the addition of DARA to weekly CyBorD, a widely used combination of bortezomib, cyclophosphamide, and dexamethasone, may provide a convenient and well-tolerated alternative, IMiD-free option.8,9 Weekly (as opposed to twice weekly) administration of bortezomib is reportedly associated with a much lower risk of grade 3 peripheral neuropathy, without sacrificing efficacy, which has led to its widespread adoption.5,10 This finding provided the rationale for a phase Ib trial of CyBorD in combination with DARA (#NCT02955810). Our objectives were to determine the preliminary safety and efficacy of this combination in newly diagnosed MM patients eligible for ASCT, with the additional goal of obtaining mechanistic insights into any potential in vivo synergies.
Methods
Patients
Eligible patients were ≤70 years of age and had untreated MM requiring treatment as per the revised International Myeloma Working Group criteria, along with measurable disease. Key inclusion criteria were Eastern Cooperative Oncology Group performance status ≤2, hemoglobin level ≥7.5 g/dL, absolute neutrophil count ≥1.0 × 10⁹/L, platelet count ≥70 × 109/L, adequate liver function, and calculated creatinine clearance level ≥40 mL/min/1.73 m2. Key exclusion criteria comprised confirmed amyloidosis, known chronic obstructive pulmonary disease with a forced expiratory volume in 1 second <50% of predicted normal, history of moderate or severe persistent asthma or uncontrolled asthma at the time of screening, HIV positivity, hepatitis B or C virus positivity, history of significant other malignancy, significant concurrent uncontrolled medical illness, and grade 2 or higher peripheral neuropathy (National Cancer Institute Common Toxicity Criteria Version 4.0). All patients provided written informed consent. The study was approved by the Irish Health Products Regulatory Authority and local hospital ethics committee according to the requirements of Irish regulations, and it was conducted in accordance with the International Conference on Harmonisation of Good Clinical Practice Guidelines and the principles of the Declaration of Helsinki.
Study Design
This phase Ib, open-label, single-arm, dose escalation study was conducted at 3 separate centers within Blood Cancer Network Ireland. The study was designed to assess the safety and efficacy of 4 cycles of induction therapy with oral (by mouth) cyclophosphamide and subcutaneous bortezomib on days 1, 8, 15, and 22; dexamethasone 20 mg by mouth on days 1, 2, 8, 9, 15, 16, 22, and 23; and DARA 16 mg/kg IV on days 1, 8, 15, and 22 for cycles 1 and 2 and on days 1 and 15 for cycles 3 and 4. After induction therapy, patients proceeded to stem cell mobilization and high-dose melphalan 200 mg/m2 IV followed by ASCT. After ASCT, 2 cycles of consolidation therapy with cyclophosphamide and bortezomib on days 1, 8, 15, and 22, dexamethasone 20 mg on days 1, 2, 8, 9, 15, 16, 22, and 23, and DARA 16 mg/kg on days 1 and 15 were administered. After consolidation therapy, all patients were scheduled to receive DARA maintenance therapy on day 1 every 4 weeks until progression, unacceptable toxicity, or withdrawal of consent (maximum duration of 2 years). Patients with high-risk disease as defined by International Staging System (ISS) stage III and/or high-risk cytogenetic findings, including t(4;14), t(14;16), and del17p, received subcutaneous bortezomib on days 1 and 15 during the maintenance phase in addition to DARA. We used a standard 3 + 3 design in sequential cohorts, 3 dose levels of cyclophosphamide and bortezomib: dose level 1, cyclophosphamide 150 mg/m2 and bortezomib 1.3 mg/m2; dose level 2, cyclophosphamide 300 mg/m2 and bortezomib 1.3 mg/m2; dose level 3, cyclophosphamide 300 mg/m2 and bortezomib 1.5 mg/m2; and a dose level −1, cyclophosphamide 100 mg/m2 and bortezomib 1.3 mg/m2. Six additional patients were enrolled in an expansion cohort at the maximum tolerated dose, once this dose was determined.
The study’s primary end points were the incidence of dose-limiting toxicity within the first cycle of combination at each dose level and complete response (CR) rate post-ASCT (assessed 30-60 days after ASCT). Dose-limiting toxicity was defined as any of the following treatment-emergent adverse events occurring during the first cycle (within 28 days from the first dose) of treatment and possibly, probably, or definitely related to the combination of CyBorD plus DARA: prolonged grade IV hematologic toxicity lasting >7 days, febrile neutropenia (absolute neutrophil count <0.5 × 10⁹/L and fever >38.5°C) that persists for >48 hours despite adequate treatment with antibiotics and/or antifungal/antiviral agents, treatment delay due to toxicity that persists >42 days after the start of cycle 1, clinically significant grade 3 or 4 nonhematologic toxicity (including peripheral neuropathy), dose modifications, or missed dose during cycle 1. Secondary end points include: safety, CR rates at the end of induction, consolidation and maintenance, best overall response, minimal residual disease (MRD) negative rate as assessed by using next-generation sequencing (NGS), progression-free survival, clinical benefit rate, and overall survival. Responses were investigator assessed as per the International Myeloma Working Group criteria. To correctly characterize response and mitigate DARA interference in patients with IgGκ MM, the HYDRASHIFT 2/4 assay (Sebia) was used. All registered patients were included in the intention-to-treat (ITT) and safety analyses. This trial is registered at www.clinicaltrials.gov as NCT02955810.
Translational studies
To gain mechanistic insights into the mechanism of action of the combination of CyBorD with DARA, consenting patients were enrolled into a translational substudy. Briefly, peripheral blood (PB) and bone marrow samples were collected pretreatment and posttreatment with CyBorD and DARA; samples were then analyzed for cell number, phenotype, and serum cytokines. Full details of the methods are available in the supplemental Materials and methods.
Results
Patient characteristics and disposition
Eighteen patients were enrolled between November 2016 and December 2017 with a median follow-up of 16.8 months (Table 1). Baseline characteristics were as follows: median age, 56 years (range, 32-66 years); 61% male, 39% female; Eastern Cooperative Oncology Group performance status = 0, 1 in 50% each; and ISS stages I, II, and III in 78%, 17%, and 6% of patients, respectively. Twenty-eight percent of patients were identified with high-risk genetic features [t(4;14), t(14;16), and del17p by using fluorescence in situ hybridization and/or gene expression profiling [GEP] using SKY92 (SkylineDx)]. Three patients discontinued therapy early (primary refractory, persistent liver toxicity, and death, respectively), and 1 patient relapsed from CR while undergoing maintenance therapy.
Patient characteristics and response data
| Age, y | Sex | ISS | FISH | SKY92 | Response | MRD post-ASCT | PET | ||||
|---|---|---|---|---|---|---|---|---|---|---|---|
| Induction | ASCT | 10−4 | 10−5 | 10−6 | |||||||
| 1 | 35 | Male | I | del17p, del1p, −13 | SR | VGPR | CR | Neg | Neg | Neg | Neg |
| 2 | 57 | Male | II | HD, 1q+ | SR | CR | CR | Neg | Neg | Ind | Neg |
| 3 | 60 | Male | I | t(11;14) | SR | VGPR | CR | Neg | Neg | Ind | Neg |
| 4 | 56 | Female | I | HD, del13q | SR | VGPR | Failed PBSC mobilization | NA | NA | NA | NA |
| 5 | 60 | Male | I | IgH, −13 | SR | VGPR | VGPR* | NA | NA | NA | Neg |
| 6 | 58 | Male | I | del17p, 1q+, HD | SR | VGPR | RIP† | NA | NA | NA | NA |
| 7 | 42 | Male | I | HD | SR | Partial response | VGPR | Neg | Neg | Ind | Neg |
| 8 | 66 | Male | I | HD | SR | Partial response | VGPR | Pos | Pos | Pos | Neg |
| 9 | 54 | Male | I | Abnormal IgH, 1q+ | SR | VGPR | CR | Neg | Neg | Ind | Neg |
| 10 | 46 | Male | II | HD, 1q+ | SR | VGPR | CR | Neg | Neg | Neg | Neg |
| 11 | 64 | Female | I | Failed | SR | CR | CR | NA | NA | NA | Neg |
| 12 | 65 | Female | I | HD | SR | Partial response | VGPR | Neg | Neg | Neg | Neg |
| 13 | 66 | Female | I | −13,1q+, HD | SR | Partial response | CR | Neg | Neg | Ind | Neg |
| 14 | 48 | Female | I | t(4;14), 1q+, | HR | Partial response | VGPR | Neg | Pos | Pos | Neg |
| 15 | 52 | Male | III | t(11;14) | HR | Refractory | NA | NA | NA | NA | NA |
| 16 | 63 | Male | II | HD | SR | VGPR | VGPR | Neg | Neg | Pos | Neg |
| 17 | 50 | Female | I | t(14;16), −13, +1q | HR | VGPR | CR | Neg | Neg | Ind | Neg |
| 18 | 32 | Female | I | IgH,-13 | SR | VGPR‡ | NA | NA | NA | NA | NA |
FISH, fluorescence in situ hybridization; HD, hyperdiploidy; HR, high risk; NA, not applicable; PBSC, PB stem cell; RIP, death/died; SR, standard risk.
Measurable disease serum-free light chain (SFLC). Normalization of value of involved FLC but abnormal SFLC ratio due to suppressed uninvolved SFLC.
Died of bilateral pneumonitis. MRD negative postinduction at ≥10−4.
Came off study after 3 cycles.
Safety
Overall, treatment was well tolerated. During the dose escalation phase (n = 12), gastrointestinal side effects related to CyBorD were the most common nonhematologic adverse event (nausea, 66%; diarrhea, 66%; and constipation, 40%). The majority of these were less than grade 2 severity. The only adverse events higher than grade 3 severity occurring in >5% of patients within the dose escalation phase were lymphopenia (16%), urinary tract infection (16%), and back pain (16%). Five serious adverse events were reported, but none was related to study treatment. No patient experienced DLT, and the maximum tolerated dose of the combination was therefore set as cyclophosphamide 300 mg/m2 and bortezomib 1.5 mg/m2 in combination with DARA and dexamethasone. Across the entire study, the most common grade 3/4 hematologic treatment-emergent related adverse events were lymphopenia (22%) and neutropenia (6%). The most common grade 3/4 nonhematologic treatment-emergent related adverse events were diarrhea (11%) and neutropenic sepsis (6%) (Table 2). One patient died of grade 5 diffuse alveolar damage 7 weeks’ post-ASCT, and this death was not believed to be related to CyBorD DARA treatment. The patient had a history of heavy cigarette smoking before diagnosis, which may have predisposed toward pneumonitis. No definite infectious etiology, including viral infection, was implicated. In the expansion phase, a single patient developed grade 3 liver toxicity, which was asymptomatic. The causality of this toxicity is uncertain. Viral serology results for hepatitis A, B, and C were negative. The patient had a background of mild nonalcoholic fatty liver disease, and the first cycle of treatment was complicated by influenza, which coincided with transaminitis 2 to 3 weeks into treatment. This fluctuated between grade 2 and 3 severity and persisted despite holding therapy. Results of a liver biopsy revealed mild nonspecific changes only. DARA-associated infusion reactions were grade 2 or lower (11%).
Toxicities related to study treatment
| Treatment-emergent toxicities of ≥grade 3 severity related to study treatment | Total (N = 18) | |
|---|---|---|
| Gastrointestinal | Diarrhea | 2 |
| Infection | Sepsis | 1 |
| Laboratory abnormalities | Alanine aminotransferase elevation | 1 |
| γ-Glutamyltransferase elevation | 1 | |
| Lymphopenia | 4 | |
| Neutropenia | 1 | |
| Metabolic | Hyponatremia | 1 |
Response
On ITT analysis, 94% achieved ≥very good partial response (VGPR) with ≥CR in 44% of patients. The overall response rate postinduction therapy was 94% (17 of 18) with achievement of ≥VGPR in 67% of patients (12 of 18). Among the 16 patients completing 4 cycles of induction, ≥partial response rate postinduction was 100%, ≥VGPR (69%), and ≥CR (13%). Two patients did not complete all 4 cycles of induction. One of these patients proved refractory to treatment and discontinued due to progressive disease during cycle 4. The second patient discontinued after 3 cycles due to persistent grade 3 elevation of transaminase levels. Informative NGS data (Adaptive Biotechnologies) were available on 10 of 18 patients achieving >VGPR postinduction, all of whom were MRD-negative postinduction at a sensitivity level of 10−4, with 2 patients MRD negative at a level of 10−5 and 1 patient MRD negative at a level of 10−6.
Sixteen of 18 patients underwent PB stem cell mobilization with cyclophosphamide and granulocyte colony-stimulating factor. In addition, 4 patients (25%) received plerixafor at the discretion of their physician. PB stem cell harvests were successful in 94% of patients (15 of 16) with a sufficient number of CD34+ cells collected for ASCT. One patient, who had extensive spinal irradiation at diagnosis, failed repeated attempts at stem cell mobilization. This patient did not proceed to ASCT; however, because the patient seemed to be benefiting from therapy, she went on to receive consolidation and maintenance therapy. The median number of CD34+ cells harvested was 6.46 × 10⁶/kg (range, 0.7-13.36 × 10⁶/kg; SD, ±2.74). All patients successfully harvested proceeded to ASCT, and all were successfully engrafted with a median time to neutrophil recovery >0.5 × 10⁹ and to platelets >20 × 109 of 10.5 days (range, 10-12 days; SD, ±0.79) and 15 days (range, 11-14 days; SD, ±2.15), respectively (full data were only available for 12 of 15 patients). These data are similar to those previously reported in trials using CyBorD as induction therapy before ASCT.1,2 They also compare favorably with other trials incorporating novel agents in the upfront setting.3
One patient died before the post-ASCT response assessment. Thus, 14 of 15 patients are evaluable for response post-ASCT. Responses deepened post-ASCT, with all 14 patients achieving ≥VGPR (94% on ITT) and 57% achieving ≥CR (44% on ITT). Post-ASCT positron emission tomography/computed tomography scans were consistent with complete metabolic response in all 14 patients. After ASCT, there was considerable upgrading of response. MRD analysis was possible in 12 of 14 patients (Table 3). In the remaining 2 patients, the diagnostic samples failed to calibrate. Excluding patients who were in VGPR post-ASCT but in whom MRD analysis was not possible, 10 (83%) of 12 patients were negative at 1 in 105 (56% on ITT). At a sensitivity of 10−6, 3 (25%) were negative and 6 (50%) were indeterminate, with only 3 patients (25%) positive at this level. Following consolidation, 8 of 18 (44%) patients were MRD negative at a level of 10−5 with 10 of 18 (56%) negative at 10−4 (Table 3). At last follow-up 14 patients remained on study without disease progression.
MRD (NGS) results after induction, ASCT, and consolidation
| Patients | MRD level | Post-induction | Post-ASCT | Post-consolidation |
|---|---|---|---|---|
| ITT (n = 18) | <10−5 | 2/18 (11%) | 10/18 (56%) | 8/18 (44%) |
| <10−6 | 1/18 (6%) | 3/18 (17%) | 3/18 (17%) | |
| Evaluable* (n = 12) | <10−5 | 2/12 (15%) | 10/12 (83%) | 8/12 (67%) |
| <10−6 | 1/12 (8%) | 3/12 (25%) | 3/12 (25%) |
ITT, intention-to-treat.
Patients who achieved ≥ VGPR after completion of ASCT and with MRD results available.
To explore the hypothesis that CyBorD DARA would lead to increased tumor infiltration by activated macrophages leading to a more robust antitumor immune response, we collected PB and bone marrow samples from consenting patients (n = 12) at baseline and 24 hours after starting treatment with CyBorD DARA.
CyBorD DARA rapidly deplete natural killer cells without affecting macrophage numbers in the bone marrow
CD38 is expressed at high levels on myeloma cells and on natural killer (NK) cells at higher levels than other immune cells,11 resulting in NK cell depletion after DARA treatment.12 To assess whether CyBorD DARA could affect macrophage activation and function in vivo, multiparameter flow cytometry was used to quantify the number of mononuclear cells in patient bone marrow samples before and 24 hours after treatment (Figure 1A-B). In line with previous studies,12 we found rapid depletion of lymphocytes (Figure 1C, left panel) as early as 24 hours’ posttreatment. We also observed an increase in neutrophils (Figure 1C, middle panel) but no significant change in the numbers of monocytes in the bone marrow of treated patients (Figure 1C, right panel). On analysis of specific lymphocyte subpopulations (supplemental Figure 1),13 we validated that the reduction of lymphocytes was specific to NK cells in MM patient bone marrow (Figure 1D, right panel) as neither CD3+ CD4+ T cells nor CD3+ CD8+ T-cell numbers were changed (Figure 1D, left and middle panels). We observed similar trends in PB mononuclear cells (Figure 2A), with rapid depletion of lymphocytes in PB samples after treatment. We also observed an increase in neutrophils (Figure 2B, middle panel) similar to that seen in bone marrow samples. In contrast to bone marrow, a significant reduction in monocytes occurred in the PB of treated patients (Figure 2B, right panel). NK cell depletion was validated in MM patient PB mononuclear cells (Figure 2C, right, left and middle panels). Collectively, our results indicate that macrophages, in contrast to NK cells, are unaffected by CyBorD DARA treatment. Macrophages in the tumor microenvironment in MM and the interaction with DARA could be harnessed to potentiate antitumor functions.
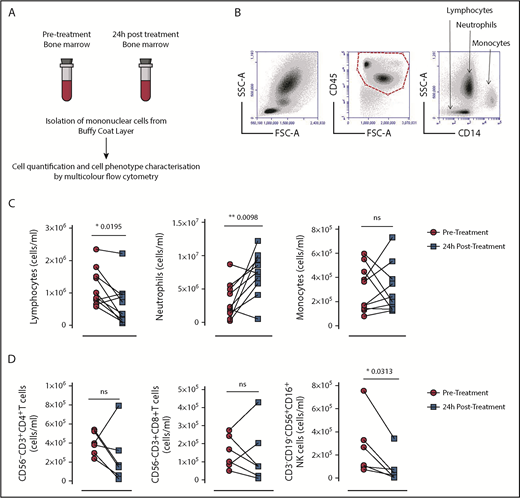
Bone marrow mononuclear cell numbers in patients with MM before and after cyclophosphamide treatment. (A) Absolute numbers of the 3 major bone marrow subtypes were quantified by using flow cytometry in bone marrow samples from 10 adults diagnosed with MM before (pretreatment) and 24 hours after (posttreatment) with CyBorD DARA. (B) Specific CD45+ bone marrow subpopulations were identified based on side scatter characteristics and surface expression of CD14. Representative gating strategy for bone marrow aspirates for the identification and quantification of lymphocytes, neutrophils, and monocytes. (C) Graphed dot plots indicate the absolute number of lymphocytes, neutrophils, and monocytes from bone marrow aspirates before (prescreened) and 24 hours’ posttreatment with CyBorD DARA (n = 10). (D) Dot plots indicate the absolute number of CD4+ and CD8+ T cells and NK cells pretreatment and posttreatment (n = 6). Gating for subpopulation of lymphocytes is shown in supplemental Figure 1. Lines between dots indicate paired samples. Wilcoxon matched pairs signed rank test and paired Student t tests were used to detect statistically significant differences between pretreatment and posttreatment samples. *P < .05, **P < .01. FSC-A, forward scatter–area; ns, not significant; SSC-A, side scatter–area.
Bone marrow mononuclear cell numbers in patients with MM before and after cyclophosphamide treatment. (A) Absolute numbers of the 3 major bone marrow subtypes were quantified by using flow cytometry in bone marrow samples from 10 adults diagnosed with MM before (pretreatment) and 24 hours after (posttreatment) with CyBorD DARA. (B) Specific CD45+ bone marrow subpopulations were identified based on side scatter characteristics and surface expression of CD14. Representative gating strategy for bone marrow aspirates for the identification and quantification of lymphocytes, neutrophils, and monocytes. (C) Graphed dot plots indicate the absolute number of lymphocytes, neutrophils, and monocytes from bone marrow aspirates before (prescreened) and 24 hours’ posttreatment with CyBorD DARA (n = 10). (D) Dot plots indicate the absolute number of CD4+ and CD8+ T cells and NK cells pretreatment and posttreatment (n = 6). Gating for subpopulation of lymphocytes is shown in supplemental Figure 1. Lines between dots indicate paired samples. Wilcoxon matched pairs signed rank test and paired Student t tests were used to detect statistically significant differences between pretreatment and posttreatment samples. *P < .05, **P < .01. FSC-A, forward scatter–area; ns, not significant; SSC-A, side scatter–area.
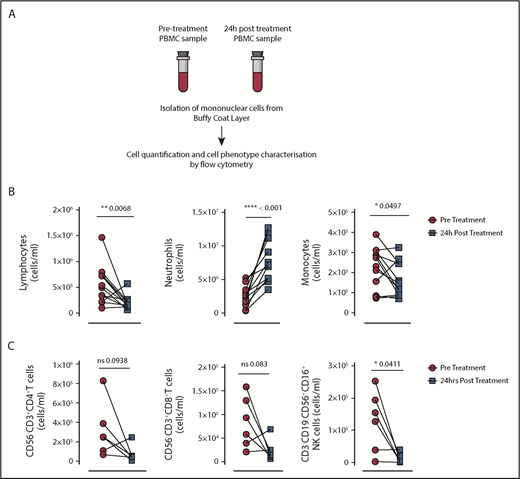
PB mononuclear cell (PBMC) numbers in patients with MM before and after cyclophosphamide treatment. (A) Absolute numbers of the 3 major PB subtypes were quantified by using flow cytometry in blood samples from 10 adults diagnosed with MM before (pretreatment) and 24 hours after (posttreatment) with CyBorD DARA. Specific CD45+ PB subpopulations were identified based on side scatter characteristics and surface expression of CD14 (as in Figure 1B). (B) Graphed dot plots indicate the absolute number of lymphocytes, neutrophils, and monocytes from bone marrow aspirates before (prescreened) and 24 hours’ posttreatment with CyBorD DARA (n = 10). (C) Dot plots indicate the absolute number of CD4+ and CD8+ T cells and NK cells pretreatment and posttreatment (n = 6). Gating for subpopulation of lymphocytes is shown in supplemental Figure 1. Each dot represents an individual patient. Lines between dots indicate paired samples. Wilcoxon matched pairs signed rank test and paired Student t tests were used to detect statistically significant differences between pretreatment and posttreatment samples. *P < .05, **P < .01, ****P < .001. ns, not significant.
PB mononuclear cell (PBMC) numbers in patients with MM before and after cyclophosphamide treatment. (A) Absolute numbers of the 3 major PB subtypes were quantified by using flow cytometry in blood samples from 10 adults diagnosed with MM before (pretreatment) and 24 hours after (posttreatment) with CyBorD DARA. Specific CD45+ PB subpopulations were identified based on side scatter characteristics and surface expression of CD14 (as in Figure 1B). (B) Graphed dot plots indicate the absolute number of lymphocytes, neutrophils, and monocytes from bone marrow aspirates before (prescreened) and 24 hours’ posttreatment with CyBorD DARA (n = 10). (C) Dot plots indicate the absolute number of CD4+ and CD8+ T cells and NK cells pretreatment and posttreatment (n = 6). Gating for subpopulation of lymphocytes is shown in supplemental Figure 1. Each dot represents an individual patient. Lines between dots indicate paired samples. Wilcoxon matched pairs signed rank test and paired Student t tests were used to detect statistically significant differences between pretreatment and posttreatment samples. *P < .05, **P < .01, ****P < .001. ns, not significant.
CyBorD DARA induces expression of Fcγ receptor 1 on patient-derived monocyte/macrophage cells
We next determined changes in macrophage activation after treatment with CyBorD DARA. Monoclonal antibodies can control tumor growth through mechanisms that include antibody-dependent cellular cytotoxicity (ADCC) and ADCP.14,15 ADCP is triggered through interaction of the antibody Fc domain with the Fcγ receptors (FcγRs) expressed on NK cells, neutrophils, and macrophages. We therefore assessed macrophage receptor expression of CCR2, CD16 (FcγRIII), CD32 (FcγRII), CD64 (FcγR1), and PD-1, receptors that can mediate effector functions such as ADCP.16,17 Using an optimized gating strategy,18 we identified monocytes/macrophages in bone marrow and PB mononuclear cell samples as CD45+, CD14+, CD33+, and CX3CR1+ cells (Figure 3A). We assessed a panel of activation receptors on macrophages in the bone marrow and PB, including CCR2, CD16, CD32, and PD-1. No changes in expression of these receptors were observed (data not shown) in either the bone marrow or PB of MM patients posttreatment. We next assessed receptors involved in macrophage-mediated phagocytosis, FcγR1 (or CD64) and signal regulatory protein-α (SIRP-α). No significant difference was observed in the expression of SIRP-α (supplemental Figure 2). Significant increases were observed in CD64 expression on macrophages posttreatment. Interestingly, these significant changes were observed in the bone marrow and PB, where we show an increase in CD64 expression by histogram (Figure 3B), and these changes were significant across the 10 independent samples analyzed (P < .01). CD64 mediates IgG1-specific ADCC/ADCP with highest affinity and transduces most stimulatory phagocytosis signals in macrophages.19 The enhanced macrophage CD64 expression in PB may serve as a noninvasive marker of macrophage ADCP activation (Figure 3C).
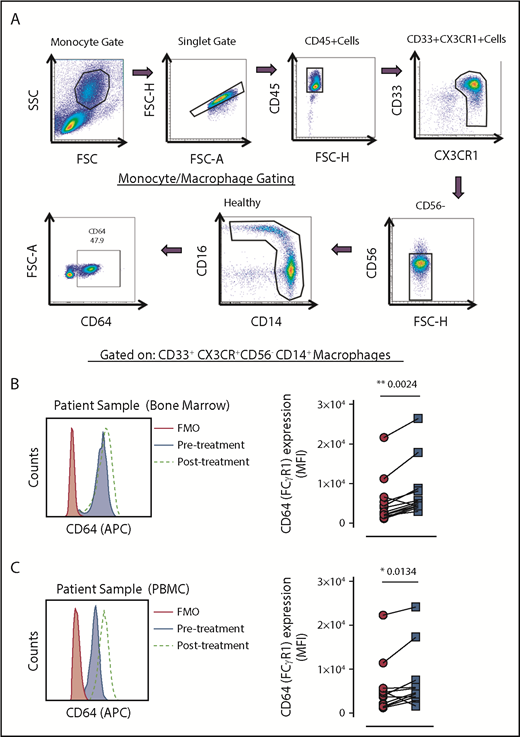
Multicolor flow cytometry for the identification and expression of CD64 on PB and bone marrow monocyte subsets. (A) Representative dot plots are shown to illustrate the gating strategy for the identification of total monocytes. Monocytes were identified by CD33+CX3CR+CD56–CD14+ expression. (B) Representative histogram of CD64 expression on CD33+CX3CR+CD56-CD14+ bone marrow monocytes/macrophages from a patient with MM pretreatment and posttreatment. The black histogram is the fluorescence minus one control (FMO). The gray filled histogram identifies the pretreatment bone marrow sample, and the dotted line represents the posttreatment bone marrow sample (left). Dot plots indicate the mean fluorescence intensity of CD64 expression pretreatment and posttreatment on CD33+CX3CR+CD56–CD14+ monocytes/macrophages (n = 13) (right). (C) Representative histogram of CD64 expression on CD33+CX3CR+CD56–CD14+ PB monocytes/macrophages from a patient with MM pretreatment and posttreatment. The black histogram is the FMO. The gray filled histogram identifies the pretreatment PB sample, and the dotted line represents the posttreatment PB sample (left). Dot plots indicate the mean fluorescence intensity of CD64 expression pretreatment and posttreatment on CD33+CX3CR+CD56–CD14+ PB monocytes/macrophages (n = 13) (panel B, right). Lines between dots indicate paired samples. Wilcoxon matched pairs signed rank test and paired Student t tests were used to detect statistically significant differences between pretreatment and posttreatment samples. *P < .05, **P < .01. APC, allophycocyanin; FSC-H, forward scatter–height; MFI, mean fluorescence intensity; SSC, side scatter.
Multicolor flow cytometry for the identification and expression of CD64 on PB and bone marrow monocyte subsets. (A) Representative dot plots are shown to illustrate the gating strategy for the identification of total monocytes. Monocytes were identified by CD33+CX3CR+CD56–CD14+ expression. (B) Representative histogram of CD64 expression on CD33+CX3CR+CD56-CD14+ bone marrow monocytes/macrophages from a patient with MM pretreatment and posttreatment. The black histogram is the fluorescence minus one control (FMO). The gray filled histogram identifies the pretreatment bone marrow sample, and the dotted line represents the posttreatment bone marrow sample (left). Dot plots indicate the mean fluorescence intensity of CD64 expression pretreatment and posttreatment on CD33+CX3CR+CD56–CD14+ monocytes/macrophages (n = 13) (right). (C) Representative histogram of CD64 expression on CD33+CX3CR+CD56–CD14+ PB monocytes/macrophages from a patient with MM pretreatment and posttreatment. The black histogram is the FMO. The gray filled histogram identifies the pretreatment PB sample, and the dotted line represents the posttreatment PB sample (left). Dot plots indicate the mean fluorescence intensity of CD64 expression pretreatment and posttreatment on CD33+CX3CR+CD56–CD14+ PB monocytes/macrophages (n = 13) (panel B, right). Lines between dots indicate paired samples. Wilcoxon matched pairs signed rank test and paired Student t tests were used to detect statistically significant differences between pretreatment and posttreatment samples. *P < .05, **P < .01. APC, allophycocyanin; FSC-H, forward scatter–height; MFI, mean fluorescence intensity; SSC, side scatter.
CyBorD DARA induces secretion of proinflammatory and suppresses anti-inflammatory mediators of macrophage function in patient serum
Macrophage phenotype, activation, and function are regulated by signals in the microenvironment.20 We next determined the levels of both proinflammatory and anti-inflammatory cytokines in patient serum (Figure 4). Levels of proinflammatory cytokine tumor necrosis factor-α (TNF-α) and interferon-γ (IFN-γ) and anti-inflammatory molecules interleukin-10 and prostaglandin E2 (PGE2) were next assessed. Although the overall levels of circulating cytokines were low, a significant increase was observed in the levels of both TNF-α and IFN-γ in serum 24 hours after treatment (Figure 4). Of note, neither TNF-α nor IFN-γ was detectable in healthy control serum samples. There were no significant changes in either interleukin-10 or PGE2 after treatment. These results indicate that circulating proinflammatory cytokines are present at higher levels posttreatment and may contribute to macrophage activation.
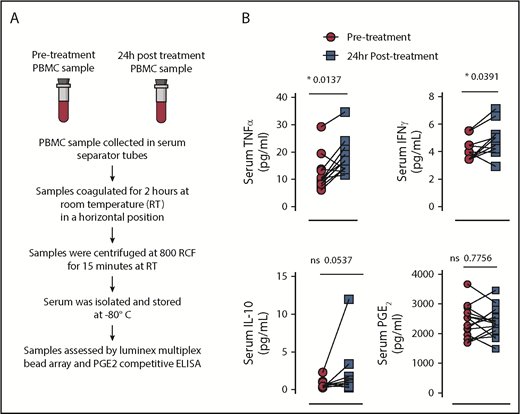
Analysis of circulating proinflammatory and anti-inflammatory cytokines in MM patient serum before and after treatment with CyBorD DARA. (A) Representative scheme to illustrate the work flow for isolation and analysis of patient serum before and after treatment. (B) Dot plots indicate the levels of TNF-α (upper left, n = 12), IFN-γ (upper right, n = 12), interleukin-10 (IL-10) (lower left, n = 12), and PGE2 (lower right, n = 12) before and after treatment in MM serum samples. Lines between dots indicate paired samples. Paired Student t tests were used to detect statistically significant differences between pretreatment and posttreatment samples. *P < .05. ELISA, enzyme-linked immunosorbent assay.
Analysis of circulating proinflammatory and anti-inflammatory cytokines in MM patient serum before and after treatment with CyBorD DARA. (A) Representative scheme to illustrate the work flow for isolation and analysis of patient serum before and after treatment. (B) Dot plots indicate the levels of TNF-α (upper left, n = 12), IFN-γ (upper right, n = 12), interleukin-10 (IL-10) (lower left, n = 12), and PGE2 (lower right, n = 12) before and after treatment in MM serum samples. Lines between dots indicate paired samples. Paired Student t tests were used to detect statistically significant differences between pretreatment and posttreatment samples. *P < .05. ELISA, enzyme-linked immunosorbent assay.
CyBorD DARA reduces CD47 expression on patient-derived CD138+ MM cells
Because CD64 has a major role in macrophage-mediated ADCP, we next assessed tumor cells for the expression of ligands that negatively regulate phagocytosis through the receptors PD-1 and SIRP-α, PD-L1 and CD47, respectively (Figure 5A). PD-L1 binding with PD-1 has also been implicated in regulation of macrophage-mediated phagocytosis.17 CD47 binds SIRP-α, resulting in inhibition of phagocytosis, and is recognized as the “don’t eat me signal” that is upregulated on tumor cells as an immune evasion strategy.21 We observed no changes in PD-L1 on MM cells after treatment (data not shown). However, a significant reduction was observed in CD47 expression on CD138+ MM cells after treatment (n = 5; P < .05). The downregulation of CD47 expression on CD138+ MM cells was only significant in the bone marrow (Figure 5B, left), at the tumor site, and not in the PB of patients with MM (Figure 5B, right). These results suggest that MM cells after treatment with CyBorD DARA may be more susceptible to phagocytosis in the tumor microenvironment.
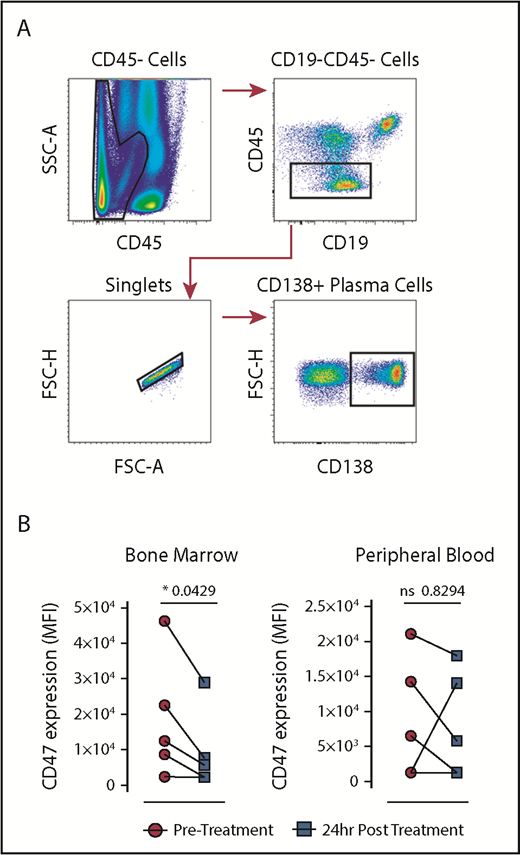
Multicolor flow cytometry for the identification and expression of CD47 on plasma cells pretreatment and posttreatment with CyBorD DARA. (A) Representative dot plots are shown to illustrate the gating strategy for the identification of CD138 plasma cells. Plasma cells were identified by surface expression of CD138. (B) Dot plots indicate the mean fluorescence intensity (MFI) of CD47 expression pretreatment and posttreatment on CD138 MM cells from the bone marrow (n = 5) (left) and PB (n = 5) (right). Lines between dots indicate paired samples. Wilcoxon matched pairs signed rank test and paired Student t tests were used to detect statistically significant differences between pretreatment and posttreatment samples; *P < .05.
Multicolor flow cytometry for the identification and expression of CD47 on plasma cells pretreatment and posttreatment with CyBorD DARA. (A) Representative dot plots are shown to illustrate the gating strategy for the identification of CD138 plasma cells. Plasma cells were identified by surface expression of CD138. (B) Dot plots indicate the mean fluorescence intensity (MFI) of CD47 expression pretreatment and posttreatment on CD138 MM cells from the bone marrow (n = 5) (left) and PB (n = 5) (right). Lines between dots indicate paired samples. Wilcoxon matched pairs signed rank test and paired Student t tests were used to detect statistically significant differences between pretreatment and posttreatment samples; *P < .05.
Discussion
The addition of DARA to CyBorD in the current study did not increase toxicity compared with that previously reported with CyBorD alone.9,22 In addition, the tolerability of CyBorD DARA compares favorably with previous reports of other frontline DARA-containing regimens. In the ALCYONE study, 39.9% of patients in the DARA group experienced >grade 3 neutropenia, compared with 6% with CyBorD DARA.3 In the MAIA study, 50% of patients in the DARA group experienced grade 3 and higher neutropenia. However, it should be recognized that both of these studies involved the treatment of an older, transplant-ineligible population, who may be more susceptible to toxicity. The rate of grade 3 or 4 infections was 23.1% in the DARA group, with pneumonia (13.7%) the most common grade 3 or 4 infection.4,5 In the current study, 2 patients discontinued treatment because of adverse events.
Given the small patient numbers, the results of the current study should be interpreted with caution. However, they compare favorably with results of similar regimens in the frontline setting and suggest that the addition of DARA to CyBorD is likely to be beneficial, inducing better responses in the absence of significant added toxicity. Up to 60% of patients would be expected to achieve ≥VGPR after 4 cycles of induction with CyBorD.9 Consistent with this, in a single institutional experience we observed ≥VGPR in 56% after 4 cycles of induction, which increased to 79% post-ASCT, with 24% of patients achieving CR post-ASCT.22 However, in the current study, with the addition of DARA (ITT analysis), 94% and 44% of patients achieved VGPR and CR after ASCT, respectively, with 57% of patients evaluable for response post-ASCT achieving CR. Our results also compare favorably with another widely used standard of care, lenalidomide, bortezomib, and dexamethasone. In the IFM2009 trial, the rate of VGPR/CR in the transplant arm was 47% after induction, which increased to 70% post-ASCT.23 Results of LYRA, a phase 2 study evaluating CyBorD DARA in a community setting, were recently published.24 In this study, after 4 induction cycles, investigators observed ≥VGPR in 44% (primary end point) of patients newly diagnosed with MM, with an overall response rate of 79%, which is lower than that previously reported with CyBorD alone. In the current study, the rate of VGPR and the overall response rate for all patients at the end of 4 cycles was 67% (12 of 18) and 94% (17 of 18). MRD data were not reported for the LYRA study. It is possible that the patients enrolled in the LYRA study had a higher risk profile than our study. For example, 36.6% of newly diagnosed patients enrolled in the LYRA study had high cytogenetic risk. In the recent publication, the authors also speculated that conduct of this study in a community setting may have affected the observed response rates. Finally, although unlikely to have greatly influenced the differences observed between the 2 studies, patients in the LYRA study received bortezomib on days 1, 8, and 15 only, whereas our patients received bortezomib on days 1, 8, 15, and 22, every 28 days.
What is most encouraging, however, is the depth of response achieved in the majority of patients in the current study. Ten (56%) of 18 patients achieved MRD negativity at a level of sensitivity of 10−5 within 30 to 60 days after ASCT, with 3 patients (25%) already negative at a level of 10−6. By comparison, in the MAIA study, after a median follow-up of 28 months, 24% of patients achieved MRD negativity at a level of 10−5.4
In reported clinical trials, longer overall survival was observed among patients in whom MRD is undetectable compared with those in whom MRD can be detected, regardless of the treatment given; as such, the achievement of MRD negativity is considered an important treatment target in MM. In the IFM2009 study, patients who were MRD negative at a level of sensitivity of at least 10−6 had a higher probability of prolonged progression-free survival than patients with detectable residual disease, regardless of cytogenetic risk profile or ISS disease stage at diagnosis.23 In the IFM2009 study, 79% of patients in the transplant arm achieved MRD negativity at a sensitivity 10−4; by NGS, however, MRD negativity (sensitivity of 10−6) was achieved at least once during maintenance in only 25% of patients.25 It should be noted that the International Myeloma Working Group guidelines recommend an MRD sensitivity threshold of 10−5 (not 10−6) when using NGS or the next-generation flow approach, and thus it is appropriate to use this level when comparing data from different studies.26
Not all patients in the current study benefited, however. One patient who had ISS stage III disease was primary refractory to treatment, with evidence of progressive renal impairment with a rise in creatinine from normal at baseline to >200 μmol/L, along with a significant increase in involved serum-free light chains during the fourth cycle of induction. Results of a renal biopsy were consistent with cast nephropathy, and the patient was taken off study. GEP using SKY92 can identify patients at high risk of progression, and this patient was identified as high risk according to GEP at baseline.27 A total of 3 patients were identified with high-risk GEP at baseline by SKY92, of whom only 1 patient managed to achieve MRD negativity at a level of 10−5. One patient, who had high-risk fluorescence in situ hybridization as well as high-risk GEP, achieved VGPR post-ASCT and was MRD negative at a level of 10−4 only. Despite double maintenance with bortezomib and DARA, this patient’s disease progressed within 10 months of ASCT. Although our data are limited, it suggests that in the presence of high-risk GEP, even a potent quadruplet regimen such as CyBorD DARA may be insufficient to overcome drug resistance. Whether this theory will be borne out with greater experience and whether PI/IMiD DARA combinations would be any more effective in this respect remains to be seen.28
From the CASTOR study, it is known that bortezomib is synergistic with DARA.1 What then is the likely contribution of cyclophosphamide to our regimen? With progression to MM, there are an increasing number of tumor-associated macrophages (TAMs) in the bone marrow.29 These are predominantly of an M2 phenotype, which promotes tumor survival and immune suppression leading to disease progression and inferior survival. A predominance of M2 macrophages as well as T-cell exhaustion have been linked to resistance to DARA/IMiD combinations.30 Although TAMs are generally considered to be undesirable, under certain circumstances, it is possible to harness their antitumor potential. Indeed, macrophages are believed to be critical effectors of monoclonal antibody therapy, and their depletion has been associated with reduced in vivo efficacy of antibodies.31 This finding may be particularly important in the context of DARA, which leads to rapid depletion of CD38-positive NK cells, lasting up to 6 months after the cessation of treatment.12 Therefore, to maximize the effect of DARA, a sufficient number of activated TAMs may be required. We hypothesized, based on previous research, that we could achieve this goal by using cyclophosphamide.7 DARA has Fc-dependent immune effector mechanisms, such as complement-dependent cytotoxicity, ADCC, and ADCP. Inhibition of ectoenzymatic function and direct apoptosis induction may also contribute to the efficacy of the antibodies to kill MM cells. The CD38 antibodies also improve host antitumor immunity by the elimination of regulatory T cells, regulatory B cells, and myeloid-derived suppressor cells.11 Given DARA-mediated NK cell depletion, ADCC may play a lesser role than originally thought. As alternate effector cells, this suggests an increased importance for macrophages. Indeed, a sufficient number of activated TAMs may be required to maximize the effect of DARA in vivo. We believe our data indicate that CyBorD DARA leads to monocyte/macrophage-mediated enhanced ADCP and a switch of macrophages from a tumor-promoting to an antitumor, proinflammatory phenotype.32
Aside from its alkylating effect, cyclophosphamide has important immunomodulatory effects with low doses able to selectively eliminate regulatory T cells leading to immune activation.33 In several studies in MM, the addition of cyclophosphamide led to remarkable improvements in outcome.34-36 Analyzing patient bone marrow samples, we observed a significant reduction in CD47, the “don’t eat me antigen” on MM cells, and an increase in CD64 on bone marrow macrophages, suggesting a more activated phenotype, 24 hours after CyBorD exposure. These findings suggest that MM cells may be more vulnerable to phagocytosis by macrophages after treatment with cyclophosphamide and DARA. In conjunction with this scenario, we observed a significant increase in the levels of both TNF-α and IFN-γ in serum 24 hours after treatment, consistent with a proinflammatory, antitumor response.
In conclusion, we present the first results combining CyBorD with DARA in the transplant setting. Our results indicate this regimen to be highly active and well tolerated, with a potentially unique mechanism of action. In our view, it deserves further evaluation as an induction regimen in the treatment of patients newly diagnosed with MM who are eligible for ASCT. A randomized trial comparing CyBorD DARA vs a combination of bortezomib, thalidomide, and dexamethasone is planned.37
The full-text version of this article contains a data supplement.
Acknowledgments
The authors thank the patients who participated in the CyBorD DARA study and their families, the study coinvestigators, research nurses, and coordinators at each of the clinical sites.
This study was supported by clinical trial and research funding from Janssen Research & Development. Grant support to M.O. was provided by Science Foundation Ireland and the Irish Cancer Society (14/ICS/B3042 Blood Cancer Network Ireland), and grant support to A.E.R. was provided by the Irish Cancer Society (CRF12RYA) and Science Foundation Ireland (15/SIRG/3456) and Galway University Foundation. All flow cytometry experiments were performed in the NUI Galway Flow Cytometry Core Facility, which is supported by funds from NUI Galway, Science Foundation Ireland, the Irish Government’s Programme for Research in Third Level Institutions, Cycle 5, and the European Regional Development Fund.
Authorship
Contribution: M.O., R.H., M.R.C., P.M., V.M., J.Q., C.M., J.K., J.W., E.L., T.K., A.H., G.H., I.P., E.K., and G.G. contributed to the accrual and treatment of patients and data acquisition, interpretation, and analysis; A.E.R., S.D.N., R.H., A.N., K.L., and M.O. contributed to translational study data acquisition, interpretation, and analysis; and M.O. and A.E.R. wrote the manuscript and approved the final version.
Conflict-of-interest disclosure: M.O. and A.E.R. received research support from Janssen Pharmaceuticals. M.O. and J.Q. have received consultancy fees from Janssen and AbbVie. The remaining authors declare no competing financial interests.
Correspondence: M. O’Dwyer, Department of Hematology, University Hospital Galway, Newcastle Rd, Galway H91 NH7V, Ireland; e-mail: michael.odwyer@nuigalway.ie.

