

Key Points
The lack of DNAM-1 expression defines a new subset of mature NK cells in the human peripheral blood.
DNAM-1neg NK cells have limited killing activity and are poor producers of interferon-γ.

Abstract
Natural killer (NK) cells are a heterogeneous population of innate lymphocytes whose potent anticancer properties make them ideal candidates for cellular therapeutic application. However, our lack of understanding of the role of NK cell diversity in antitumor responses has hindered advances in this area. In this study, we describe a new CD56dim NK cell subset characterized by the lack of expression of DNAX accessory molecule-1 (DNAM-1). Compared with CD56bright and CD56dimDNAM-1pos NK cell subsets, CD56dimDNAM-1neg NK cells displayed reduced motility, poor proliferation, lower production of interferon-γ, and limited killing capacities. Soluble factors secreted by CD56dimDNAM-1neg NK cells impaired CD56dimDNAM-1pos NK cell–mediated killing, indicating a potential inhibitory role for the CD56dimDNAM-1neg NK cell subset. Transcriptome analysis revealed that CD56dimDNAM-1neg NK cells constitute a new mature NK cell subset with a specific gene signature. Upon in vitro cytokine stimulation, CD56dimDNAM-1neg NK cells were found to differentiate from CD56dimDNAM-1pos NK cells. Finally, we report a dysregulation of NK cell subsets in the blood of patients diagnosed with Hodgkin lymphoma and diffuse large B-cell lymphoma, characterized by decreased CD56dimDNAM-1pos/CD56dimDNAM-1neg NK cell ratios and reduced cytotoxic activity of CD56dimDNAM-1pos NK cells. Altogether, our data offer a better understanding of human peripheral blood NK cell populations and have important clinical implications for the design of NK cell–targeting therapies.
Introduction
Natural killer (NK) cells are innate lymphoid cells that play important roles in the elimination of malignant or virally infected cells.1 In addition to their cytotoxic functions, NK cells secrete cytokines and chemokines that contribute to the development of adaptive immune responses. NK cell activation is controlled by an array of receptors. Human NK cells express killer-cell immunoglobulin-like receptors (KIRs) that transmit negative signals upon binding to class I molecules of the major histocompatibility complex.2 Conversely, natural cytotoxicity receptors (NKp30, NKp44, and NKp46) and NKG2D sense stress-induced molecules and contribute to NK cell activation. NK cell activity results from the integration of signals provided by these receptors as well as coreceptors, adhesion molecules, and cytokines.
Human NK cells are usually defined as CD3negCD56pos cells and are divided into 2 main subsets: CD56bright and CD56dim NK cells.3 In the peripheral blood, ∼90% of NK cells are CD56dim, but CD56bright NK cells predominate in lymph nodes and most tissues.4 CD56dim NK cells express high levels of the Fcγ receptor III (CD16), whereas CD56bright NK cells are CD16dim/neg. Furthermore, CD56bright cells are CD62Lpos and express high levels of the inhibitory receptor CD94/NKG2A but are KIRneg, whereas CD56dim NK cells are CD62Lneg, CD94/NKG2Alow, and KIRhigh.5 There is convincing evidence that CD56bright NK cells are immature and differentiate into CD56dim NK cells under cytokine stimulation.6,7 CD56bright NK cells are generally seen as an immunoregulatory subset characterized by its high production of cytokines such interferon-γ (IFN-γ), granulocyte-macrophage colony stimulating factor (GM-CSF), and tumor necrosis factor–α, whereas CD56dim NK cells are endowed with high cytotoxic potential.3 Although NK cell diversity expands far beyond CD56dim and CD56bright subsets,8-10 the functional impact of this vast phenotypic diversity and the progeny relationship between NK cell subsets remain elusive.
DNAX accessory molecule-1 (DNAM-1, CD226) is an adhesion and costimulatory molecule known to promote NK cell cytotoxic activity and IFN-γ production upon binding to its ligands CD112 and CD155.11 DNAM-1 shares its ligands with the inhibitory molecules TIGIT and CD96.12 DNAM-1 has been involved in NK cell–mediated tumor immunosurveillance,13-16 control of metastatic disease,17 and defense against pathogens.18,19 Importantly, DNAM-1 expression identifies 2 distinct NK cell functional subsets in mice, with DNAM-1neg NK cells arising from DNAM-1pos NK cells.20 Although mouse DNAM-1pos NK cells produce high levels of inflammatory cytokines, have enhanced interleukin-15 (IL-15) signaling, and proliferate vigorously, their DNAM-1neg counterpart produces high amounts of macrophage inflammatory protein-1 (MIP-1) chemokines. In humans, DNAM-1 is expressed on the majority of peripheral blood NK cells, but bimodal DNAM-1 expression has been observed on lymphoid tissue–resident NK cells.21 Several studies reported a reduction in DNAM-1 expression on NK cells isolated from patients with cancer.22-26 Nevertheless, whether DNAM-1neg human NK cells represent a distinct NK cell subset with specific functions has not yet been studied.
In the current study, we established that human peripheral blood DNAM-1neg NK cells represent a distinct NK cell subset with a specific gene expression program. We showed that DNAM-1neg NK cells arise from DNAM-1pos NK cells and have limited effector functions. Moreover, proportions of DNAM-1neg NK cells are increased in the blood of patients with lymphoma, highlighting the necessity of considering this subset when designing immunotherapies.
Materials and methods
Sample collection and study subjects
This study was approved by the Human Research Ethics committee at QIMR Berghofer and the Princess Alexandra Hospital, Brisbane. Buffy coat blood packs were collected from healthy volunteer blood donors through the Australian Red Cross Blood Service (Queensland, Australia). Samples from patients with Hodgkin lymphoma (HL) and diffuse large B-cell leukemia (DLBCL) and from age- and sex-matched healthy donors were collected pretreatment at the Princess Alexandra Hospital, Brisbane. All samples used in this study have been supplied with written informed consent.
Cell preparation and functional assays
NK cells were enriched from cryopreserved peripheral blood mononuclear cells (PBMCs) by negative selection using an automated separator (Miltneyi Biotec). NK cell subsets were purified by using flow cytometry (FACSAria II; BD Biosciences). Cells were cultured in complete RPMI 1640. The supplemental Methods present details regarding the NK cell functional assays.
Flow cytometry and cytokine detection
Cells were stained according to standard protocols (supplemental Table 1). Zombie yellow (BioLegend) was used to gate out dead cells. Isotype or fluorescence-minus-one controls were used to set positive staining gates. Intracellular staining was performed by using the BD intracellular staining kit (BD Biosciences). Cell apoptosis was measured by using the BD Annexin V Apoptosis Detection Kit. Data were acquired by using the LSR Fortessa IV (BD Biosciences) and analyzed with FlowJo software (Tree Star). Cytokines in the supernatant of in vitro cultures were analyzed by using cytometric bead array technology according to the manufacturer’s instructions (BD Biosciences).
Live cell imaging and image analysis
NK cell motility and NK/target cell interactions were visualized by time-lapse microscopy with an Xcellence IX81 microscope (Olympus Corporation). Live cell images were taken at 40-second intervals over a 40- to 90-minute time period. Imaris version 8.2 software (Bitplane) was used to track live cells and generate motility data. Trajectory graphs were generated in Microsoft Excel using displacement data.
RNA sequencing
Details regarding RNA sequencing (RNAseq) are given in the supplemental Methods.
Telomere length measurement
The length of telomeric repeats was determined by quantitative flow–fluorescence in situ hybridization by using a telomere-specific, fluorescently labeled peptide nucleic acid probe according to the manufacturer’s instructions (DakoCytomation).
Statistical analysis
Statistical analysis was performed by using Prism 6 software (GraphPad). Data were compared by using either 1-way or 2-way analysis of variance (ANOVA) with Tukey multiple comparison post hoc testing. P < .05 was considered significant. P values are depicted as *P < .05, **P < .01, ***P < .001, and ****P < .0001.
Results
Identification of a new NK cell subset characterized by the absence of DNAM-1 expression
To determine whether, similarly to mice,20 distinct DNAM-1pos and DNAM-1neg NK populations exist in humans, we analyzed DNAM-1 expression on peripheral blood NK cells (CD3negCD56pos) from 13 healthy donors. In agreement with previous reports,25,27 most NK cells expressed DNAM-1 (Figure 1A; supplemental Figure 1A). However, although CD56bright NK cells were exclusively DNAM-1pos, a small population of DNAM-1neg NK cells was detected within the CD56dim subset. These CD56dimDNAM-1neg cells represented 5.6% ± 3.2% of the total peripheral blood NK cells (Figure 1B) and were detected in both fresh and cryopreserved samples (supplemental Figure 1B-C). The observations that CD56dimDNAM-1neg cells expressed both the NK cell–associated transcription factor Eomes and the NK cell linage marker CD122 and were negative for CD14 and CD19 confirmed their NK cell identity (supplemental Figure 1D-E). Hence, 3 human NK cell subsets were defined: CD56brightDNAM-1pos, CD56dimDNAM-1pos, and CD56dimDNAM-1neg NK cells. In agreement with previous reports,3 CD56brightDNAM-1pos NK cells expressed low levels of CD16, whereas CD56dimDNAM-1pos NK cells were mostly CD16pos. Intriguingly, CD16 expression was bimodal on CD56dimDNAM-1neg NK cells (Figure 1C).
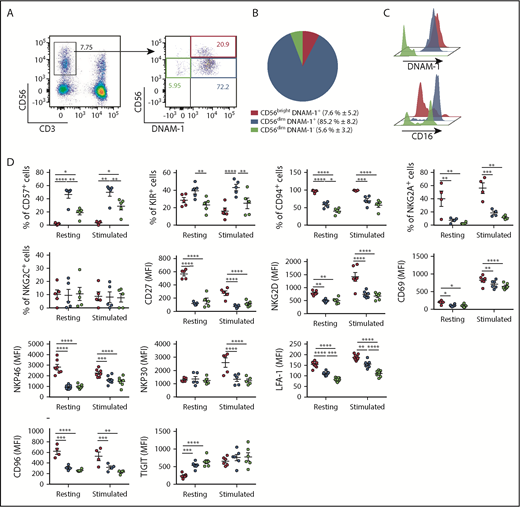
Low DNAM-1 expression defines a unique subset of CD56dimNK cells displaying reduced expression of CD57, inhibitory KIRs, and LFA-1. (A) Representative fluorescence-activated cell sorter staining of healthy donor peripheral blood lymphocytes displaying the gating strategy used to identify NK cells (left) and CD56brightDNAM-1pos, CD56dimDNAM-1pos, and CD56dimDNAM-1neg NK cell subsets (right). Numbers show percentages of the gated populations. (B) Proportions of NK cell subsets defined as in panel A are shown as mean percentage ± standard deviation from 13 healthy donors. (C) Histograms showing DNAM-1 and CD16 expression on the 3 NK cell subsets defined as in panel A; CD56brightDNAM-1pos (red histogram), CD56dimDNAM-1pos (blue histogram), and CD56dimDNAM-1neg (green histogram). (D) Marker expression by NK cell subsets pre- and postovernight stimulation with IL-12 (10 ng/mL), IL-15 (100 ng/mL), and IL-18 (50 ng/mL) is shown as percentages of positive cells or mean fluorescence intensity (MFI). Single data points represent the mean value of duplicate wells. Data are shown as mean ± standard error of the mean (SEM) from 4 to 9 healthy donor samples and were analyzed by using a 2-way ANOVA followed by a Tukey multiple comparisons post hoc test. *P < .05; **P < .01; ***P < .001; ****P < .0001.
Low DNAM-1 expression defines a unique subset of CD56dimNK cells displaying reduced expression of CD57, inhibitory KIRs, and LFA-1. (A) Representative fluorescence-activated cell sorter staining of healthy donor peripheral blood lymphocytes displaying the gating strategy used to identify NK cells (left) and CD56brightDNAM-1pos, CD56dimDNAM-1pos, and CD56dimDNAM-1neg NK cell subsets (right). Numbers show percentages of the gated populations. (B) Proportions of NK cell subsets defined as in panel A are shown as mean percentage ± standard deviation from 13 healthy donors. (C) Histograms showing DNAM-1 and CD16 expression on the 3 NK cell subsets defined as in panel A; CD56brightDNAM-1pos (red histogram), CD56dimDNAM-1pos (blue histogram), and CD56dimDNAM-1neg (green histogram). (D) Marker expression by NK cell subsets pre- and postovernight stimulation with IL-12 (10 ng/mL), IL-15 (100 ng/mL), and IL-18 (50 ng/mL) is shown as percentages of positive cells or mean fluorescence intensity (MFI). Single data points represent the mean value of duplicate wells. Data are shown as mean ± standard error of the mean (SEM) from 4 to 9 healthy donor samples and were analyzed by using a 2-way ANOVA followed by a Tukey multiple comparisons post hoc test. *P < .05; **P < .01; ***P < .001; ****P < .0001.
Overall, CD56dimDNAM-1neg NK cells appeared very similar to CD56dimDNAM-1pos NK cells: compared with CD56bright NK cells, both CD56dim subsets exhibited decreased expression levels of CD27, CD69, CD94, NKG2D, NKG2A, and natural cytotoxicity receptors (NKp30 and NKp46) (Figure 1D). CD96 and TIGIT also harbored similar expression patterns on DNAM-1pos and DNAM-1neg CD56dim NK cells and were, respectively, decreased and increased compared with CD56bright NK cells. However, expression levels of inhibitory KIRs were equivalent between CD56brightDNAM-1pos and CD56dimDNAM-1neg NK cells and were reduced compared with their CD56dimDNAM-1pos counterpart. Moreover, the maturation marker CD57 was expressed by one-half of CD56dimDNAM-1pos NK cells but only 20% to 30% of CD56dimDNAM-1neg NK cells. Finally, CD56dimDNAM-1neg NK cells expressed very low levels of the DNAM-1–associated adhesion molecule LFA-1.28 These data identify a new CD56dimDNAM-1neg NK cell population that differs phenotypically from CD56dimDNAM-1pos NK cells by exhibiting lower expression of CD57 and KIRs.
CD56dimDNAM-1neg NK cells display reduced motility
DNAM-1 is an adhesion molecule27 and might influence NK cell motility. We therefore investigated the migratory behavior of cytokine-activated NK cell subsets. We observed that DNAM-1pos NK cells were elongated compared with the majority of DNAM-1neg NK cells that appeared spherically symmetrical (Figure 2A). Compared with DNAM-1–expressing subsets, CD56dimDNAM-1neg NK cells displayed minimal motility and tended to move by involuntary drift (Figure 2B; supplemental Figure 2A-B). CD56brightDNAM-1pos and CD56dimDNAM-1pos NK cells were significantly faster (Figure 2C) and traveled longer tracks (Figure 2D) than CD56dimDNAM-1neg cells, even though no significant difference was observed regarding the displacement from origin (Figure 2E). Thus, CD56dimDNAM-1neg NK cells present an altered migratory behavior in vitro.

DNAM-1posNK cell subsets display more dynamic and deliberate migration behavior than CD56dimDNAM-1negNK cells. CD56brightDNAM-1pos, CD56dimDNAM-1pos, and CD56dimDNAM-1neg NK cell subsets were fluorescence-activated cell sorter purified from healthy donor PBMCs. Cells were stimulated overnight with IL-12 (10 ng/mL), IL-15 (100 ng/mL), and IL-18 (50 ng/mL). Time-lapse microscopy was performed by using an Olympus Xcellence IX81 microscope controlled by Xcellence RT software. Images were taken every 40 seconds for 40 to 90 minutes. Images were collected by using a 20× LUCPlanFLN lens with 0.45 NA and Olympus F-View II camera. (A) Representative images. (B) Single-cell tracking map of NK cell trajectories. Mean velocity (C), length of tracks (D), and displacement from origin (E) of individual NK cells were calculated. Each data point represents 1 single randomly selected NK cell tracked over 40 minutes. Results are displayed as the mean ± SEM of at least 6 representative time-lapse videos obtained from 3 independent experiments. Data were analyzed by using a 1-way ANOVA followed by a Tukey multiple comparisons post hoc test. ***P < .001; ****P < .0001.
DNAM-1posNK cell subsets display more dynamic and deliberate migration behavior than CD56dimDNAM-1negNK cells. CD56brightDNAM-1pos, CD56dimDNAM-1pos, and CD56dimDNAM-1neg NK cell subsets were fluorescence-activated cell sorter purified from healthy donor PBMCs. Cells were stimulated overnight with IL-12 (10 ng/mL), IL-15 (100 ng/mL), and IL-18 (50 ng/mL). Time-lapse microscopy was performed by using an Olympus Xcellence IX81 microscope controlled by Xcellence RT software. Images were taken every 40 seconds for 40 to 90 minutes. Images were collected by using a 20× LUCPlanFLN lens with 0.45 NA and Olympus F-View II camera. (A) Representative images. (B) Single-cell tracking map of NK cell trajectories. Mean velocity (C), length of tracks (D), and displacement from origin (E) of individual NK cells were calculated. Each data point represents 1 single randomly selected NK cell tracked over 40 minutes. Results are displayed as the mean ± SEM of at least 6 representative time-lapse videos obtained from 3 independent experiments. Data were analyzed by using a 1-way ANOVA followed by a Tukey multiple comparisons post hoc test. ***P < .001; ****P < .0001.
DNAM-1neg NK cells exhibit limited proliferation and are poor producers of IFN-γ in response to cytokine stimulation
We assessed the proliferation of sorted NK cell subsets after 5 days of culture in the presence of IL-2 and IL-15 (Figure 3A). We observed that CD56bright NK cells proliferated more than CD56dim NK cells (as shown by Romagnani et al7 ); within the CD56dim fraction, CD56dimDNAM-1neg NK cells exhibited reduced proliferation. We next measured IFN-γ production by using purified human NK cell subsets following in vitro stimulation with IL-12, IL-15, and IL-18. In agreement with previously published data,3 higher percentages of IFN-γ–producing cells were observed within the CD56bright NK cell subset compared with both CD56dim subsets (Figure 3B). Interestingly, CD56dimDNAM-1pos NK cells were better IFN-γ producers than CD56dimDNAM-1neg NK cells. Further to this, we analyzed cytokine secretion in the culture supernatant of 6 purified NK cells subsets based on DNAM-1, CD56, and CD16 expression (gated as in supplemental Figure 3). CD56brightCD16negDNAM-1pos NK cells secreted more IFN-γ and GM-CSF than the other subsets (Figure 3C). CD56dimCD16negDNAM-1pos also secreted relatively high levels of IFN-γ and GM-CSF, in agreement with the idea that this population might represent an intermediate phenotype between CD56brightCD16negDNAM-1pos and CD56dimCD16posDNAM-1pos NK cells.29 Importantly, both DNAM-1neg subsets (CD56dimCD16negDNAM-1neg and CD56dimCD16posDNAM-1neg), similarly to CD56dimCD16posDNAM-1pos NK cells, were poor producers of IFN-γ and GM-CSF in response to cytokine stimulation. Finally, CD16 expression seemed to determine NK cell ability to produce MIP chemokines. Indeed, within the 3 main NK subsets described in this study (CD56brightDNAM-1pos, CD56dimDNAM-1pos, and CD56dimDNAM-1neg), CD16pos cells always secreted more MIP-1α and MIP-1β than their CD16neg counterpart. Taken as a whole, these data show very limited proliferation and IFN-γ secretion of CD56dimDNAM-1neg NK cells in response to cytokine stimulation.
![Figure 3. CD56dim DNAM-1neg NK cells proliferate poorly and produce limited amount of IFN-γ and granulocyte-macrophage colony-stimulating factor (GM-CSF) in response to cytokine stimulation. (A) CD56brightDNAM-1pos (red), CD56dimDNAM-1pos (blue), and CD56dimDNAM-1neg (green) NK cell subsets were purified from healthy donor PBMCs and stained with carboxyfluorescein diacetate succinimidyl ester (CFSE). The proliferation of NK cell subsets was assessed by measuring CFSE dilution after 5 days of culture with IL-2 (500 IU) and IL-15 (10 ng/mL). One representative histogram from 4 individual donors is displayed. (B) CD56brightDNAM-1pos, CD56dimDNAM-1pos, and CD56dimDNAM-1neg NK cell subsets were purified from healthy donor PBMCs. Intracellular IFN-γ production was assessed after overnight stimulation with IL-12 (10 ng/mL), IL-15 (100 ng/mL), and IL-18 (50 ng/mL). Representative fluorescence-activated cell sorting plots and cumulative data are shown. Each data point represents the mean percentage of IFN-γ+ NK cells obtained from culture duplicates; data are shown as mean ± SEM from 4 donor samples. (C) Healthy donor NK cells were purified into 6 subsets based on their expression of CD16 (+ or –), CD56 (bright [b] or dim [d]) and DNAM-1 (+ or –) and were cultured overnight with (striped fill pattern) or without (no fill pattern) stimulation with IL-12 (10 ng/mL), IL-15 (100 ng/mL), and IL-18 (50 ng/mL). Concentrations of indicated cytokines in the culture supernatant were analyzed by cytometric bead array. Data were normalized to reflect the relative cytokine/chemokine production per 10 000 cells and are presented as mean ± SEM of duplicate wells from 20 individual donors over 10 independent experiments. Data were analyzed with a 1-way (B) or 2-way (C) ANOVA followed by a Tukey multiple comparison post hoc test. *P <. 05; **P < .01; ***P < .001; ****P <.0001. No significant difference between subsets was found in the nonstimulated samples in panel C.](https://ash.silverchair-cdn.com/ash/content_public/journal/bloodadvances/3/11/10.1182_bloodadvances.2018030676/2/m_advances030676f3.png?Expires=1765941061&Signature=JxIusWPXVH7x6jDB787e0ScQkvPTIMNOG6eqLyoFEY6J0SAffFs6p7XwOAzGBYPSovHBVSAXQzoz1i9TEeyz9JajRMqgRN7BSEMLysi2r95EiLPALhqjjWdTu-8hIjHrIpS4CrEYwLe4s7ZUYGuUv75pN2t-5kp7BDIC2F8Il1KHx3q3o~vajhWf7WV2Pi5cONRAuf~UsxCEd4EzGToxOdq3roMAW6mj7eIZXqoB8PUfuIqTPfAcRr6hCeUyWxrg0lOThgxIqDMti6~av~9neMeOd9PP1X4cbo6OP7hQwd8r8pbg-cLTcJKD1kai7J9nsuSOYfq0~Tyeg215xJ6z7A__&Key-Pair-Id=APKAIE5G5CRDK6RD3PGA)
CD56dimDNAM-1negNK cells proliferate poorly and produce limited amount of IFN-γ and granulocyte-macrophage colony-stimulating factor (GM-CSF) in response to cytokine stimulation. (A) CD56brightDNAM-1pos (red), CD56dimDNAM-1pos (blue), and CD56dimDNAM-1neg (green) NK cell subsets were purified from healthy donor PBMCs and stained with carboxyfluorescein diacetate succinimidyl ester (CFSE). The proliferation of NK cell subsets was assessed by measuring CFSE dilution after 5 days of culture with IL-2 (500 IU) and IL-15 (10 ng/mL). One representative histogram from 4 individual donors is displayed. (B) CD56brightDNAM-1pos, CD56dimDNAM-1pos, and CD56dimDNAM-1neg NK cell subsets were purified from healthy donor PBMCs. Intracellular IFN-γ production was assessed after overnight stimulation with IL-12 (10 ng/mL), IL-15 (100 ng/mL), and IL-18 (50 ng/mL). Representative fluorescence-activated cell sorting plots and cumulative data are shown. Each data point represents the mean percentage of IFN-γ+ NK cells obtained from culture duplicates; data are shown as mean ± SEM from 4 donor samples. (C) Healthy donor NK cells were purified into 6 subsets based on their expression of CD16 (+ or –), CD56 (bright [b] or dim [d]) and DNAM-1 (+ or –) and were cultured overnight with (striped fill pattern) or without (no fill pattern) stimulation with IL-12 (10 ng/mL), IL-15 (100 ng/mL), and IL-18 (50 ng/mL). Concentrations of indicated cytokines in the culture supernatant were analyzed by cytometric bead array. Data were normalized to reflect the relative cytokine/chemokine production per 10 000 cells and are presented as mean ± SEM of duplicate wells from 20 individual donors over 10 independent experiments. Data were analyzed with a 1-way (B) or 2-way (C) ANOVA followed by a Tukey multiple comparison post hoc test. *P <. 05; **P < .01; ***P < .001; ****P <.0001. No significant difference between subsets was found in the nonstimulated samples in panel C.
CD56dimDNAM-1negNK cells proliferate poorly and produce limited amount of IFN-γ and granulocyte-macrophage colony-stimulating factor (GM-CSF) in response to cytokine stimulation. (A) CD56brightDNAM-1pos (red), CD56dimDNAM-1pos (blue), and CD56dimDNAM-1neg (green) NK cell subsets were purified from healthy donor PBMCs and stained with carboxyfluorescein diacetate succinimidyl ester (CFSE). The proliferation of NK cell subsets was assessed by measuring CFSE dilution after 5 days of culture with IL-2 (500 IU) and IL-15 (10 ng/mL). One representative histogram from 4 individual donors is displayed. (B) CD56brightDNAM-1pos, CD56dimDNAM-1pos, and CD56dimDNAM-1neg NK cell subsets were purified from healthy donor PBMCs. Intracellular IFN-γ production was assessed after overnight stimulation with IL-12 (10 ng/mL), IL-15 (100 ng/mL), and IL-18 (50 ng/mL). Representative fluorescence-activated cell sorting plots and cumulative data are shown. Each data point represents the mean percentage of IFN-γ+ NK cells obtained from culture duplicates; data are shown as mean ± SEM from 4 donor samples. (C) Healthy donor NK cells were purified into 6 subsets based on their expression of CD16 (+ or –), CD56 (bright [b] or dim [d]) and DNAM-1 (+ or –) and were cultured overnight with (striped fill pattern) or without (no fill pattern) stimulation with IL-12 (10 ng/mL), IL-15 (100 ng/mL), and IL-18 (50 ng/mL). Concentrations of indicated cytokines in the culture supernatant were analyzed by cytometric bead array. Data were normalized to reflect the relative cytokine/chemokine production per 10 000 cells and are presented as mean ± SEM of duplicate wells from 20 individual donors over 10 independent experiments. Data were analyzed with a 1-way (B) or 2-way (C) ANOVA followed by a Tukey multiple comparison post hoc test. *P <. 05; **P < .01; ***P < .001; ****P <.0001. No significant difference between subsets was found in the nonstimulated samples in panel C.
DNAM-1neg NK cells represent an immunomodulatory subset with limited killing capabilities
We investigated the response of DNAM-1neg NK cells to receptor triggering through target cell stimulation. When incubated with the chronic myelogenous leukemia line K562, CD56dimDNAM-1neg NK cells expressed more CD107a than the other subsets (Figure 4A; supplemental Figure 4A). However, CD56dimDNAM-1pos NK cells killed K562 cells more effectively compared with both CD56brightDNAM-1pos cells and CD56dimDNAM-1neg NK cells (Figure 4B), in agreement with their high intracellular expression of granzyme B (supplemental Figure 4B). Analysis via time-lapse microscopy confirmed that CD56dimDNAM-1pos NK cells rapidly killed K562 cells, whereas CD56brightDNAM-1pos and CD56dimDNAM-1neg NK cells required a longer interaction time (Figure 4C). Thus, CD56dimDNAM-1neg NK cells respond to target cells, but this action does not translate to target cell killing.
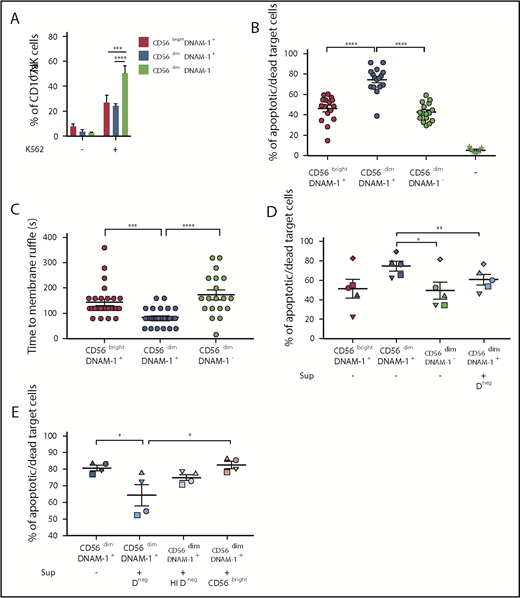
CD56dimDNAM-1negNK cells present poor killing capabilities and downregulate the killing activity of CD56dimDNAM-1posNK cells. (A) NK cells were enriched from PBMCs by Ficoll density gradient centrifugation followed by magnetic bead negative cell selection. K562 target cells were added to wells containing total NK cells in a 10:1 effector:target ratio. After 4 hours, cells were stained and analyzed for degranulation by quantifying the percentages of CD107a-positive cells after gating on CD56brightDNAM-1pos (red), CD56dimDNAM-1pos (blue), or CD56dimDNAM-1neg (green) NK cell subsets. Results are shown as percentages of positive cells ± SEM from 8 individual healthy donors, pooled from 2 independent experiments. (B-E) Fluorescence-activated cell sorting NK cell subsets were stimulated overnight in IL-12 (10 ng/mL), IL-15 (100 ng/mL), and IL-18 (50 ng/mL) and added to wells containing K562 target cells in a 10:1 effector:target ratio. (B) After 4 hours of culture, cytotoxicity of NK cell subsets against K562 target cells was quantified by flow cytometry with dead target cells identified as carboxyfluorescein diacetate succinimidyl ester (CFSE)neg Annexin V/propidium iodide (PI)pos. Target cells alone were used as control (–). Data are presented as mean ± SEM of percentages of Annexin V+ and/or PI+ target cells from 8 individual donors run in duplicate. Each dot represents one technical replicate. Data were pooled from 5 independent experiments. (C) The conjugation time between NK cells and target cells leading to target cell death was analyzed by using time-lapse microscopy. Time to membrane ruffle corresponds to the time (in seconds) between initial cell contact between the NK cell and the target cell and the first sign of target cell membrane ruffle. Results are shown as mean ± SEM from 20 to 30 individual NK cell:target cell conjugations pooled from at least 6 time-lapse videos obtained from 3 independent experiments. (D-E) Cytotoxicity of NK cell subsets was assessed as in panel B, but cells were cultured with (+) or without (–) supernatant from CD56dimDNAM-1neg (Dneg), heat-inactivated CD56dimDNAM-1neg (HI Dneg), or CD56brightDNAM-1pos (CD56bright) NK cells that had been stimulated overnight in IL-12 (10 ng/mL), IL-15 (100 ng/mL), and IL-18 (50 ng/mL). Each graph shows the mean ± SEM of percentages Annexin V+ and/or PI+ target cells from 4 individual donors pooled from 2 independent experiments. Individual dots represent the mean value of duplicate wells for 1 donor. Data obtained from 1 individual donor are depicted with the same symbol. Data were analyzed by 2-way (A) or 1-way ANOVA without pairing (B-C) or a 1-way ANOVA with pairing (D-E) followed by a Tukey multiple comparison post hoc test. *P < .05; **P<.01; ***P < .001; ****P < .0001.
CD56dimDNAM-1negNK cells present poor killing capabilities and downregulate the killing activity of CD56dimDNAM-1posNK cells. (A) NK cells were enriched from PBMCs by Ficoll density gradient centrifugation followed by magnetic bead negative cell selection. K562 target cells were added to wells containing total NK cells in a 10:1 effector:target ratio. After 4 hours, cells were stained and analyzed for degranulation by quantifying the percentages of CD107a-positive cells after gating on CD56brightDNAM-1pos (red), CD56dimDNAM-1pos (blue), or CD56dimDNAM-1neg (green) NK cell subsets. Results are shown as percentages of positive cells ± SEM from 8 individual healthy donors, pooled from 2 independent experiments. (B-E) Fluorescence-activated cell sorting NK cell subsets were stimulated overnight in IL-12 (10 ng/mL), IL-15 (100 ng/mL), and IL-18 (50 ng/mL) and added to wells containing K562 target cells in a 10:1 effector:target ratio. (B) After 4 hours of culture, cytotoxicity of NK cell subsets against K562 target cells was quantified by flow cytometry with dead target cells identified as carboxyfluorescein diacetate succinimidyl ester (CFSE)neg Annexin V/propidium iodide (PI)pos. Target cells alone were used as control (–). Data are presented as mean ± SEM of percentages of Annexin V+ and/or PI+ target cells from 8 individual donors run in duplicate. Each dot represents one technical replicate. Data were pooled from 5 independent experiments. (C) The conjugation time between NK cells and target cells leading to target cell death was analyzed by using time-lapse microscopy. Time to membrane ruffle corresponds to the time (in seconds) between initial cell contact between the NK cell and the target cell and the first sign of target cell membrane ruffle. Results are shown as mean ± SEM from 20 to 30 individual NK cell:target cell conjugations pooled from at least 6 time-lapse videos obtained from 3 independent experiments. (D-E) Cytotoxicity of NK cell subsets was assessed as in panel B, but cells were cultured with (+) or without (–) supernatant from CD56dimDNAM-1neg (Dneg), heat-inactivated CD56dimDNAM-1neg (HI Dneg), or CD56brightDNAM-1pos (CD56bright) NK cells that had been stimulated overnight in IL-12 (10 ng/mL), IL-15 (100 ng/mL), and IL-18 (50 ng/mL). Each graph shows the mean ± SEM of percentages Annexin V+ and/or PI+ target cells from 4 individual donors pooled from 2 independent experiments. Individual dots represent the mean value of duplicate wells for 1 donor. Data obtained from 1 individual donor are depicted with the same symbol. Data were analyzed by 2-way (A) or 1-way ANOVA without pairing (B-C) or a 1-way ANOVA with pairing (D-E) followed by a Tukey multiple comparison post hoc test. *P < .05; **P<.01; ***P < .001; ****P < .0001.
We explored the possibility that this CD56dimDNAM-1neg population might have a regulatory function. To test this hypothesis, we performed a killing assay in which CD56dimDNAM-1pos NK cells were incubated with K562 target cells in the presence of conditioned medium (CM) from cytokine-stimulated CD56dimDNAM-1neg cultures (Figure 4D-E). The addition of CD56dimDNAM-1neg NK cell CM, but not heat-inactivated CM or CD56bright NK cell CM, decreased CD56dimDNAM-1pos NK cell–killing capacity. These results suggest that soluble factors secreted by CD56dimDNAM-1neg NK cells may regulate the cytotoxic activity of CD56dimDNAM-1pos NK cells. Overall, our data indicate that the CD56dimDNAM-1neg NK cell subset presents limited effector functions but is endowed with immunomodulatory potential.
CD56dimDNAM-1neg NK cells constitute a mature NK cell subset with a specific gene signature
To better understand the relationship between CD56brightDNAM-1pos, CD56dimDNAM-1pos and CD56dimDNAM-1neg NK cell populations, we analyzed their gene expression profiles by using RNAseq. We confirmed that Ncam1 (CD56) messenger RNA (mRNA) was highly expressed within the CD56bright subset compared with the 2 CD56dim subsets (Figure 5A). Interestingly, DNAM-1 downregulation in CD56dimDNAM-1neg NK cells was detected at the mRNA level, indicating that the absence of DNAM-1 expression on human CD56dimDNAM-1neg NK cells is not a consequence of internalization following ligand binding but likely results from repression of the cd226 gene.
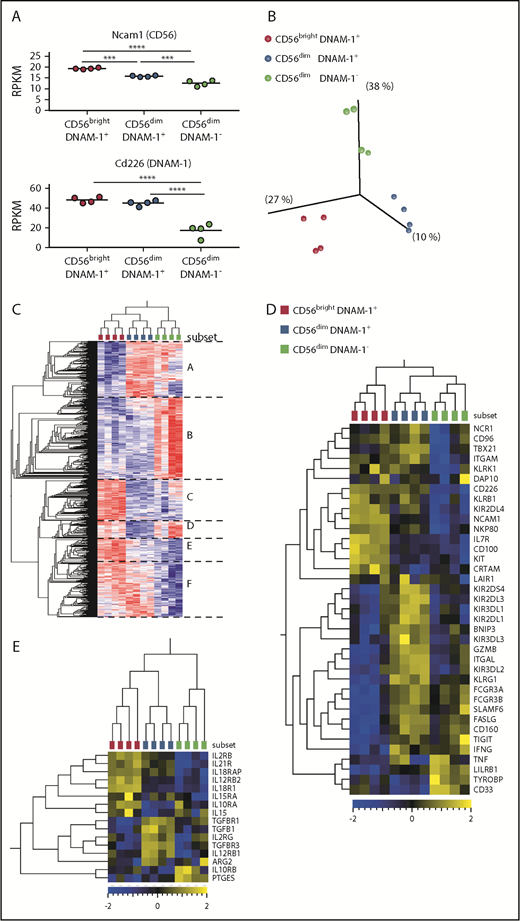
CD56brightDNAM-1pos, CD56dimDNAM-1pos, and CD56dimDNAM-1negNK cell populations display distinct gene expression profiles. CD56brightDNAM-1pos, CD56dimDNAM-1pos, and CD56dimDNAM-1neg NK cell subsets were purified from healthy donor PBMCs, and their gene expression profiles were analyzed by using RNAseq. Four independent samples, each one consisting of NK cell mRNAs pooled from 10 to 20 donors, were analyzed for each population. (A) Relative expression of Ncam1 and Cd226 mRNAs in reads per kilobase million (RPKM). Data were analyzed with a 1-way ANOVA followed by a Tukey multiple comparison post hoc test. (B) Unsupervised principal component analysis revealed 3 clusters corresponding to the 3 NK cell populations (Benjamini-Hochberg corrected P value, q = 0.05). (C) Heat map and hierarchical clustering of the most differentially expressed genes between the 3 populations (q = 0.05). Genes can be divided into 6 groups (A-F) according to their pattern of expression. (D) Heat map displaying selected NK cell-related genes. (E) Heat map displaying selected genes related to inflammation and immunosuppression. ***P < .001; ****P < .00001.
CD56brightDNAM-1pos, CD56dimDNAM-1pos, and CD56dimDNAM-1negNK cell populations display distinct gene expression profiles. CD56brightDNAM-1pos, CD56dimDNAM-1pos, and CD56dimDNAM-1neg NK cell subsets were purified from healthy donor PBMCs, and their gene expression profiles were analyzed by using RNAseq. Four independent samples, each one consisting of NK cell mRNAs pooled from 10 to 20 donors, were analyzed for each population. (A) Relative expression of Ncam1 and Cd226 mRNAs in reads per kilobase million (RPKM). Data were analyzed with a 1-way ANOVA followed by a Tukey multiple comparison post hoc test. (B) Unsupervised principal component analysis revealed 3 clusters corresponding to the 3 NK cell populations (Benjamini-Hochberg corrected P value, q = 0.05). (C) Heat map and hierarchical clustering of the most differentially expressed genes between the 3 populations (q = 0.05). Genes can be divided into 6 groups (A-F) according to their pattern of expression. (D) Heat map displaying selected NK cell-related genes. (E) Heat map displaying selected genes related to inflammation and immunosuppression. ***P < .001; ****P < .00001.
Unsupervised hierarchical clustering revealed that the 3 NK cell subsets clustered independently (Figure 5B), with both DNAM-1pos subsets clustering together apart from CD56dimDNAM-1neg cells (Figure 5C). Analysis of the genes differentially expressed between the 3 NK cell subsets identified 6 groups of genes. In total, 2712 genes (groups B and F) were differentially expressed between DNAM-1pos and DNAM-1neg NK cells. Analysis of NK cell–related genes revealed high levels of Kit and Il7r mRNAs in CD56brightDNAM-1pos cells and high expression of gzmb (granzyme B) in CD56dimDNAM-1pos cells (Figure 5D), thereby confirming published observations.4 Interestingly, although KIRs and Tigit mRNA expression matched our cytometry data, cd96 mRNA was expressed on both DNAM-1pos subsets, indicating that posttranscriptional mechanisms might regulate CD96 expression on the surface of CD56dimDNAM-1pos cells. Tbx21 mRNA (encoding T-bet) was downregulated in the CD56dimDNAM-1neg subset, but these cells still expressed high levels of Ifnγ mRNA. CD56dimDNAM-1neg NK cells also expressed high levels of Tnf mRNA.
We analyzed selected genes encoding immunosuppressive molecules along with receptors for inflammatory cytokines and confirmed the high expression of cytokine receptors in the CD56brightDNAM-1pos subset (Figure 5E). The CD56dimDNAM-1pos subset expressed high levels of mRNAs encoding for subunits of the receptor to transforming growth factor β, a cytokine known to suppress NK cell activity.30 CD56dimDNAM-1neg NK cells expressed high levels of prostaglandin E synthase mRNA, suggesting that the synthesis of prostaglandin E231 might contribute to the immunoregulatory activity of CD56dimDNAM-1neg NK cells.
Pathway network analyses confirmed the immaturity of CD56bright cells, as pathways related to mitosis and Notch signaling32 were preferentially expressed in this subset (supplemental Figure 5). Expression of pathways related to NK cell cytotoxicity, cell differentiation, receptor signaling, and intracellular signaling in the CD56dimDNAM-1pos subset suggested that these cells have been activated and have acquired killing capacities. CD56dimDNAM-1neg NK cells also appeared as a mature/activated subset that expressed pathways related to receptor/intracellular signaling. However, in contrast to CD56dimDNAM-1pos cells, pathways specific to this subset emphasized binding, either through cell adhesion or binding to immune compounds (immunoglobulins). Very interestingly, pathways related to inflammation (eg, inflammatory/immune response, cytokine/chemokine signaling, response to oxygen-containing compounds) were specifically expressed in CD56dimDNAM-1neg cells, suggesting that CD56dimDNAM-1neg NK cells might emerge in inflammatory conditions. Taken as a whole, these data established that CD56brightDNAM-1pos, CD56dimDNAM-1pos, and CD56dimDNAM-1neg NK cells represent 3 distinct NK cell subsets with different gene expression programs.
CD56dimDNAM-1neg NK cells constitute a subset of terminally differentiated NK cells
To assess the developmental relationship between CD56brightDNAM-1pos, CD56dimDNAM-1pos, and CD56dimDNAM-1neg NK cells, these subsets were purified from healthy donor PBMCs and cultured for 4 days in the presence of IL-2 only or a combination of IL-12, IL-15, and IL-18 (Figure 6A-B; supplemental Figure 6A). In both conditions, CD56brightDNAM-1pos NK cells gave rise to CD56dimDNAM-1pos NK cells and a minority of CD56dimDNAM-1neg NK cells. The appearance of CD56brightDNAM-1pos cells in CD56dimDNAM-1pos NK cell cultures in the presence of IL-2 might reflect CD56 upregulation after activation.33 Importantly, a CD56dimDNAM-1neg NK cell population emerged in CD56dimDNAM-1pos NK cell cultures, suggesting that CD56dimDNAM-1neg NK cells derive from the CD56dimDNAM-1pos subset. Of note, the lower proliferative capacity of CD56dimDNAM-1neg NK cells excludes the possibility that a few contaminant CD56dimDNAM-1neg cells may have overgrown in these cultures. Finally, the vast majority of purified CD56dimDNAM-1neg NK cells conserved a stable phenotype, indicating that this subset represents a terminally differentiated stage that does not convert into any of the 2 other NK cell subsets. Of note, the pattern of expression of KIRs and CD57 in the 3 populations obtained postculture matched the phenotypes shown in Figure 1 (supplemental Figure 6B-C).
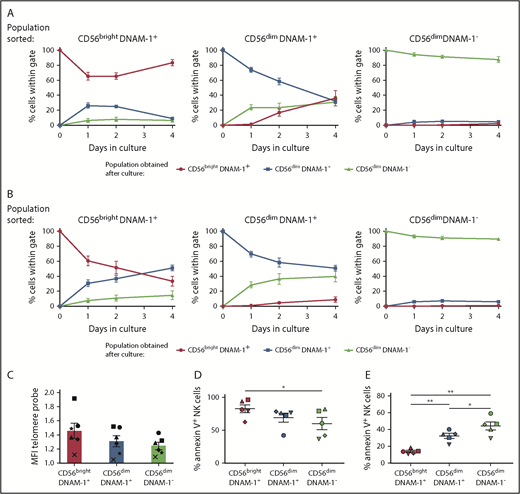
CD56dimDNAM-1negNK cells are terminally differentiated. (A-B) CD56brightDNAM-1pos, CD56dimDNAM-1pos, and CD56dimDNAM-1neg NK cell subsets were purified from healthy donor PBMCs and cultured for 4 days in the presence of IL-2 (600 IU) (A) or IL-12 (10 ng/mL), IL-15 (100 ng/mL), and IL-18 (50 ng/mL) (B). At days 1, 2, and 4, NK cells were analyzed by using flow cytometry for surface expression of CD56 and DNAM-1. Results are displayed as the percentage of cells falling within CD56brightDNAM-1pos, CD56dimDNAM-1pos, or CD56dimDNAM-1neg gates. Data are shown as the mean ± SEM of duplicate wells from 5 individual donors pooled from 3 independent experiments. (C) Telomere length was determined by hybridization of a fluorescein isothiocyanate–labeled peptide nucleic acid probe to telomeric repeats in the DNA of NK cell subsets. For each NK cell subset, mean fluorescence intensity (MFI) values of the incorporated probe was normalized to K562 control cell fluorescence. Data are shown as mean ± SEM values obtained for 6 individual donors and are pooled from 3 independent experiments, with each symbol representing one individual donor. No significant difference was found by using a 1-way ANOVA on paired values. (D-E) Purified CD56brightDNAM-1pos, CD56dimDNAM-1pos, and CD56dimDNAM-1neg NK cells were cultured overnight in the absence (D) or presence (E) of IL-12 (10 ng/mL), IL-15 (100 ng/mL), and IL-18 (50 ng/mL). Apoptosis was determined by measuring Annexin V uptake by using flow cytometry. Data are shown as mean ± SEM from 5 individual donors. Individual dots represent the mean value of duplicate wells, with each symbol representing one individual donor. Data were analyzed by using a 1-way ANOVA on paired values followed by a Tukey multiple comparison post hoc test. *P < .05; **P < .01.
CD56dimDNAM-1negNK cells are terminally differentiated. (A-B) CD56brightDNAM-1pos, CD56dimDNAM-1pos, and CD56dimDNAM-1neg NK cell subsets were purified from healthy donor PBMCs and cultured for 4 days in the presence of IL-2 (600 IU) (A) or IL-12 (10 ng/mL), IL-15 (100 ng/mL), and IL-18 (50 ng/mL) (B). At days 1, 2, and 4, NK cells were analyzed by using flow cytometry for surface expression of CD56 and DNAM-1. Results are displayed as the percentage of cells falling within CD56brightDNAM-1pos, CD56dimDNAM-1pos, or CD56dimDNAM-1neg gates. Data are shown as the mean ± SEM of duplicate wells from 5 individual donors pooled from 3 independent experiments. (C) Telomere length was determined by hybridization of a fluorescein isothiocyanate–labeled peptide nucleic acid probe to telomeric repeats in the DNA of NK cell subsets. For each NK cell subset, mean fluorescence intensity (MFI) values of the incorporated probe was normalized to K562 control cell fluorescence. Data are shown as mean ± SEM values obtained for 6 individual donors and are pooled from 3 independent experiments, with each symbol representing one individual donor. No significant difference was found by using a 1-way ANOVA on paired values. (D-E) Purified CD56brightDNAM-1pos, CD56dimDNAM-1pos, and CD56dimDNAM-1neg NK cells were cultured overnight in the absence (D) or presence (E) of IL-12 (10 ng/mL), IL-15 (100 ng/mL), and IL-18 (50 ng/mL). Apoptosis was determined by measuring Annexin V uptake by using flow cytometry. Data are shown as mean ± SEM from 5 individual donors. Individual dots represent the mean value of duplicate wells, with each symbol representing one individual donor. Data were analyzed by using a 1-way ANOVA on paired values followed by a Tukey multiple comparison post hoc test. *P < .05; **P < .01.
Telomere shortening is a process usually associated with cell replication, and terminally differentiated/memory lymphocyte subsets harbor shorter telomeres.7 Although no significant difference was observed, CD56brightDNAM-1pos cells had the longest telomeres, whereas CD56dimDNAM-1neg had reduced telomeres (Figure 6C). When analyzing NK cell apoptosis in 2 different assays, we found that CD56dimDNAMneg NK cells were more resistant than the other subsets to cytokine starvation (Figure 6D), whereas a high proportion of CD56dimDNAM-1neg NK cells underwent apoptosis when cultured with inflammatory cytokines (Figure 6E). Taken as a whole, these results support a linear maturation pathway in which CD56brightDNAM-1pos NK cells differentiate into CD56dimDNAM-1pos NK cells that finally lose DNAM-1 expression to become CD56dimDNAM-1neg NK cells.
Proportions of CD56dimDNAM-1pos and CD56dimDNAM-1neg cell subsets are altered in the peripheral blood of patients with hematologic malignancies
We analyzed NK cell populations in the peripheral blood of a cohort of patients diagnosed with HL or DLBCL. Total NK cell percentages were reduced in the blood of patients with lymphoma compared with healthy donors (Figure 7A-B). This finding might be explained by a dramatic reduction of CD56dimDNAM-1pos NK cells in these patients (Figure 7C). In patients with DLBCL, decreased percentages in CD56dimDNAM-1pos NK cells among the whole NK cell population were associated with increased percentages in CD56dimDNAM-1neg NK cells; a similar trend, albeit not significant, was observed in patients with HL. Overall, the ratio of CD56dimDNAM-1pos NK cells over CD56dimDNAM-1neg NK cells was significantly reduced in both HL and DLBCL patients (Figure 7D). Marker analysis on the 3 NK cell populations revealed additional phenotypic alterations of NK cells in HL and DLBCL patients (supplemental Figure 7). An in vitro cytotoxicity assay against K562 target cells confirmed the limited killing capacity of CD56brightDNAM-1pos and CD56dimDNAM-1neg NK cells and indicated that the killing capacity of these 2 subsets was equivalent between healthy donors and patients with lymphoma (Figure 7E). Strikingly, the cytotoxic activity of CD56dimDNAM-1pos cells was decreased in patients with HL and DLBCL.
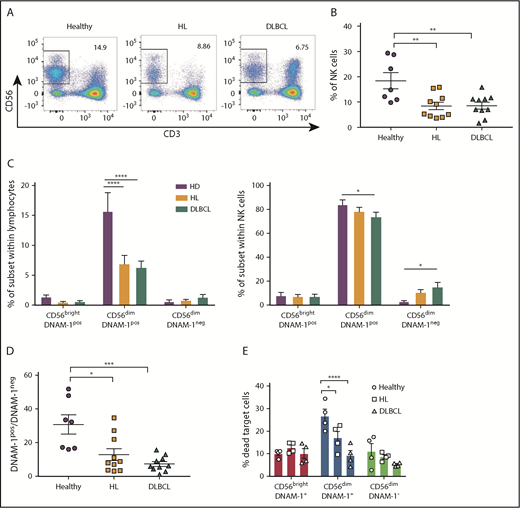
CD56dimDNAM-1negNK cells are enriched in the peripheral blood of patients with hematologic malignancies. (A-B) NK cell proportions in peripheral blood of patients with HL or DLBCL compared with that of age- and sex-matched healthy control donors was determined via flow cytometry by gating on live CD3negCD56pos NK cells. Representative fluorescence-activated cell sorter plots (A) and the mean ± SEM of duplicate wells from 7 to 10 individual donors (B) from each group are shown. (C) NK cell subset distribution was determined by flow cytometry from healthy donor and HL and DLBCL patient samples. Results are shown as the mean ± SEM of subset frequencies within the whole lymphocyte population (left) or the NK cell population (right). (D) Graph shows the ratio of CD56dimDNAM-1pos over CD56dimDNAM-1neg NK cell as mean ± SEM. (E) CD56brightDNAM-1pos, CD56dimDNAM-1pos, and CD56dimDNAM-1neg NK cell subsets were purified from healthy donor and HL or DLBCL PBMCs and stimulated overnight in IL-12 (10 ng/mL), IL-15 (100 ng/mL), and IL-18 (50 ng/mL). The following day, cells were added to wells containing K562 target cells in a 10:1 effector:target ratio. After 4 hours of culture, cytotoxicity of NK cell subsets against K562 target cells was measured by fluorescence-activated cell sorter staining for Annexin V/PI. Results are shown as mean ± SEM from 4 individual donors run in duplicate and pooled from 2 independent experiments. Individual dots represent the mean value of duplicate wells. Data were analyzed with a 1-way ANOVA (B,D) or a 2-way ANOVA (C,E) followed by a Tukey multiple comparison post hoc test. *P < .05; **P < .01; ***P < .001; ****P < .0001.
CD56dimDNAM-1negNK cells are enriched in the peripheral blood of patients with hematologic malignancies. (A-B) NK cell proportions in peripheral blood of patients with HL or DLBCL compared with that of age- and sex-matched healthy control donors was determined via flow cytometry by gating on live CD3negCD56pos NK cells. Representative fluorescence-activated cell sorter plots (A) and the mean ± SEM of duplicate wells from 7 to 10 individual donors (B) from each group are shown. (C) NK cell subset distribution was determined by flow cytometry from healthy donor and HL and DLBCL patient samples. Results are shown as the mean ± SEM of subset frequencies within the whole lymphocyte population (left) or the NK cell population (right). (D) Graph shows the ratio of CD56dimDNAM-1pos over CD56dimDNAM-1neg NK cell as mean ± SEM. (E) CD56brightDNAM-1pos, CD56dimDNAM-1pos, and CD56dimDNAM-1neg NK cell subsets were purified from healthy donor and HL or DLBCL PBMCs and stimulated overnight in IL-12 (10 ng/mL), IL-15 (100 ng/mL), and IL-18 (50 ng/mL). The following day, cells were added to wells containing K562 target cells in a 10:1 effector:target ratio. After 4 hours of culture, cytotoxicity of NK cell subsets against K562 target cells was measured by fluorescence-activated cell sorter staining for Annexin V/PI. Results are shown as mean ± SEM from 4 individual donors run in duplicate and pooled from 2 independent experiments. Individual dots represent the mean value of duplicate wells. Data were analyzed with a 1-way ANOVA (B,D) or a 2-way ANOVA (C,E) followed by a Tukey multiple comparison post hoc test. *P < .05; **P < .01; ***P < .001; ****P < .0001.
Discussion
We have identified a minor population of terminally differentiated NK cells that are characterized by a lack of DNAM-1 expression. This study expands to humans our previous findings that DNAM-1 expression patterns distinguish 2 mouse NK cell subsets with specific functions and gene expression profiles.20
The question of subset correspondence between mouse and human NK cells has recently been addressed by Crinier et al,10 who used single-cell RNAseq to identify 2 NK cell subsets (NK1 and NK2) conserved across organs and species. The direct comparison of NK1 and NK2 signatures with our gene expression data set confirmed the validity of our RNAseq analysis, with CD56brightDNAM-1pos and CD56dimDNAM-1pos NK cells overexpressing the NK2 and NK1 signatures, respectively (supplemental Figure 8A-B). Interestingly, there was no correspondence between CD56dimDNAM-1neg NK cells and any of the blood or spleen subsets defined by Crinier et al, indicating that CD56dimDNAM-1neg NK cells constitute a new NK cell subset. We suggest that, in both mouse and human, DNAM-1 expression might allow the definition of alternative NK cell subsets that do not fall into the NK1/NK2 categories. Using the published mouse DNAM-1neg NK cell signature,20 we have defined a 6-gene DNAM-1neg NK cell signature conserved across species (supplemental Figure 8C).
In addition to a specific gene signature, human DNAM-1neg NK cells share several functional characteristics with their mouse counterpart: they arise from DNAM-1pos NK cells, they display limited proliferative capacity, and they are poor producers of IFN-γ and GM-CSF. However, this report also highlights differences between the 2 species. Although DNAM-1neg NK cells account for approximately one-half of mouse splenic NK cells,20 DNAM-1neg NK cells represent a minor population in the human peripheral blood. In mice, DNAM-1neg NK cells are high producers of MIP chemokines.20 By contrast, we found that in humans, MIP-producing NK cells are defined by the expression of CD16, regardless of whether they express DNAM-1. Finally, mouse DNAM-1pos and DNAM-1neg NK cell subsets display equivalent cytotoxic activity,20 whereas in humans, CD56dimDNAM-1pos NK cells are much more potent killers than CD56dimDNAM-1neg NK cells.
The consensus that conventional NK cells originate via a linear differentiation model has been challenged by some research suggesting that CD56bright and CD56dim NK cells might belong to different lineages.34 Our in vitro differentiation experiments confirm the well-accepted linear model of NK cell maturation and add an additional step: immature CD56bright NK cells give rise to CD56dimDNAM-1pos NK cells that ultimately become CD56dimDNAM-1neg NK cells. In agreement of the concept of a progressive maturation program, we identified a group of genes (Figure 5C, cluster E) showing high expression in CD56bright NK cells, moderate expression in CD56dim DNAM-1pos cells, and low expression in CD56dimDNAM-1neg. Nevertheless, we did not completely rule out the possibility that some CD56dimDNAM-1neg NK cells might directly arise from CD56bright NK cells. In this regard, the low percentage of KIR+ cells and the common gene expression program (Figure 5C, cluster D) shared by CD56brightDNAM-1pos and CD56dimDNAM-1neg NK cells might be seen as an indication of a differentiation pathway independent from CD56dimDNAM-1pos NK cells.
Our data indicate that CD56dimDNAM-1neg NK cells are terminally differentiated cells: their phenotype remains stable upon cytokine stimulation, their telomeres are shorter than those of DNAM-1pos NK cell subsets, and they are highly prone to apoptosis in inflammatory microenvironments but more resistant to cytokine withdrawal. However, surprisingly, only 20% to 30% of CD56dimDNAM-1neg NK cells express CD57, a marker commonly believed to mark one of the final steps in NK cell maturation.35-37 We propose that loss of DNAM-1 on both CD56dimCD57pos and CD56dimCD57neg NK cells represents an alternative maturation pathway that is associated with the acquisition of immunomodulatory functions. In this model, lower frequencies of CD57pos cells within the DNAM-1neg population might be explained by the reduced proliferative capacity of CD56dimCD57pos compared with CD56dimCD57neg cells.35
Intriguingly, increased CD107a expression observed on the membrane of K562-stimulated CD56dimDNAM-1neg NK cells did not translate into effective cytotoxicity. Several hypotheses can explain these contradictory results. First, the granules released by CD56dimDNAM-1neg NK cells may not contain the cytotoxic molecules required for target cell killing, a hypothesis supported by the low expression of granzyme B of CD56dimDNAM-1neg NK cells. Alternatively, limited expression of LFA-1 on CD56dimDNAM-1neg cells coupled with the absence of DNAM-1–triggered inside-out LFA-1 signaling might have led to nonpolarized degranulation and limited killing of target cells.38,39 Finally, similarly to what has been described for CD16,40 NK cells might downregulate DNAM-1 after degranulation. In this case, higher percentage of CD107a+ cells within the CD56dimDNAM-1neg NK cell population might only be a consequence of their terminal differentiation from degranulating CD56dimDNAM-1pos NK cells.
Although CD56dimDNAM-1neg NK cells were limited in their ability to perform “classical” NK cell functions (ie, killing and IFN-γ secretion), our data indicate that these cells might represent an immunomodulatory subset. Although NK cells are known to play an immunoregulatory role in autoimmune diseases by the elimination of chronically activated immune cells,41,42 this study is the first to indicate the self-regulation of NK cell cytotoxicity by the secretion of soluble factors from a terminally differentiated NK cell subset. The soluble factors implicated in this process remain to be identified. One main candidate is prostaglandin E231,43,44 as our RNAseq analysis identified increased expression of ptges in CD56dimDNAM-1neg NK cells.
We observed a profound decline in the ratio of CD56dimDNAM-1pos over CD56dimDNAM-1neg NK cell subsets in the blood of patients with HL and DLBCL that may be attributed to decreased numbers of CD56dimDNAM-1pos NK cells. In addition, we showed that, in patients with lymphoma, CD56dimDNAM-1pos NK cells present reduced cytotoxic activity. The decreased numbers and functionality of cytotoxic CD56dimDNAM-1pos NK cells associated with overrepresentation of potentially immunosuppressive CD56dimDNAM-1neg NK cells are likely to affect the efficacy of NK cell–targeting strategies in patients with lymphoma.
In conclusion, we identified a population of terminally differentiated CD56dimDNAM-1neg circulating human NK cells that are proportionally more represented in the blood of patients with HL and DLBCL. Because CD56dimDNAM-1neg NK cells are poor effectors and potentially immunosuppressive, this population is likely to affect the quality of ex vivo expanded NK cells for autologous cell transfer therapies. Future research should investigate whether depleting the CD56dimDNAM-1neg NK cells before culturing could improve the killing activity of patient NK cells and show better antilymphoma effect.
The full-text version of this article contains a data supplement.
Acknowledgments
The authors thank the Flow Cytometry and Imaging Facility at QIMR Berghofer Medical Research Institute, the ACRF Centre for Comprehensive Biomedical Imaging, and the members of the Immunology in Cancer and Infection Laboratory for helpful suggestions and discussion. The authors acknowledge the specimen donors and thank the Red Cross Blood Service for their supply of buffy coats for this project.
C.G. was supported by a National Health and Medical Research Council (NHMRC) of Australia Early Career Fellowship (1107417), and M.J.S. was supported by an NHMRC Senior Principal Research Fellowship (1078671). This project was funded by a Priority-driven Collaborative Cancer Research Scheme project grant from Cancer Australia, Cure Cancer Australia, and Can Too (1122183) attributed to C.G., a project seed grant from QIMR Berghofer Medical Research Institute attributed to C.G., and an NHMRC Program Grant (1132519) attributed to M.J.S.
Authorship
Contribution: K.A.S., M.K.G., M.J.S., and C.G. were responsible for study conception and design; K.A.S. and N.J.W. were responsible for acquisition of data; K.A.S., S.L., N.J.W., M.J.S., and C.G. performed analysis and interpretation of data; K.A.S. and C.G. drafted the manuscript; S.L., F.V., L.C., M.K.G., L.M., and M.J.S. performed critical revisions and editing; and M.J.S. and C.G. were responsible for supervision.
Conflict-of-interest disclosure: M.J.S. has research agreements with Bristol-Myers Squibb, Tizona Therapeutics, and Aduro Biotech. M.K.G. has financial relationships with BMS (research grant), Celgene (research grant), MSD (advisory board), Janssen (advisory board), Gilead (honorarium and research grant), Roche (honoria and travel), and Amgen (honorarium). The remaining authors declare no competing financial interests.
The current affiliation for C.G. is Cancer Immunotherapies Laboratory, Mater Research Institute, The University of Queensland, Translational Research Institute, Woolloongabba, QLD, Australia.
Correspondence: Camille Guillerey, Cancer Immunotherapies Laboratory, Mater Research Institute, The University of Queensland, Translational Research Institute, Woolloongabba, QLD 4102, Australia; e-mail: camille.guillerey@mater.uq.edu.au; or Mark J. Smyth, QIMR Berghofer Medical Research Institute, 300 Herston Rd, Herston, QLD 4006, Australia; e-mail: mark.smyth@qimrberghofer.edu.au

