

Key Points
The addition of bortezomib to decitabine did not result in improved outcomes in newly diagnosed elderly patients with AML.
Induction with 10-day decitabine cycles resulted in higher remission rates than previous CALGB trials of newly diagnosed older AML patients.

Abstract
Novel treatment strategies are needed for older patients with acute myeloid leukemia (AML). This randomized phase 2 trial compared the efficacy and safety of 20 mg/m2 of IV decitabine on days 1 to 10 alone (arm A) with those of 1.3 mg/m2 of subcutaneous bortezomib (arm B) on days 1, 4, 8, and 11 for up to 4 10-day cycles followed by monthly 5-day cycles. Previously untreated AML patients age ≥60 years (excluding those with FLT3 mutations and favorable-risk cytogenetics) without restrictions in performance status (PS) or organ function were eligible. Median age was 72.4 years (range, 60.5-92.3 years); 31 patients (19%) had baseline PS ≥2, 35 (22%) had an antecedent hematological disorder, 58 had (39%) adverse cytogenetics, and 7 (5%) and 23 (14%) had abnormal cardiac or renal function. There were no statistically significant differences in overall survival (OS) or responses between the 2 treatment arms. The overall response rate (complete remission + complete remission with incomplete blood count recovery) was 39% (n = 64), with median OS of 9.3 months. Nineteen responders (31%) underwent allogeneic stem cell transplantation. The most common adverse event was febrile neutropenia, and there were no unexpected toxicities. Adding bortezomib to decitabine did not improve outcomes, but responses were better than those in previous trials using 5-day decitabine cycles. This trial was registered at www.clinicaltrials.gov as #NCT01420926.
Introduction
Outcomes for older patients with acute myeloid leukemia (AML) are poor, and novel treatment strategies are needed. Although complete remission (CR) can be attained in 45% to 55% of a selected minority of AML patients age >60 years using intensive chemotherapy, median survival is only 8 to 12 months, and outcomes are worse in patients age >70 years, with unfavorable cytogenetics, and/or with poor performance status (PS).1 Data from 1525 older AML patients treated with intensive chemotherapy in Cancer and Leukemia Group B (CALGB) trials show median overall survival (OS) of ∼10 months for patients age 60 to 69 years, 7 months for those age 70 to 79 years, and 2 months for those age >80 years (Richard A. Larson, Alliance for Clinical Trials in Oncology [Alliance] database, personal communication, 8 January 2018). Of note, these trials enrolled only patients with baseline Eastern Cooperative Oncology Group PS ≤2, and there were only 68 patients age >80 years among the 1525 patients. Two-year survival for patients with normal cytogenetics was 20%; it was <10% for patients with an unfavorable karyotype. At the MD Anderson Cancer Center, 8-week mortality was 36% and median survival was 4.6 months for 446 AML patients age ≥70 years treated with cytarabine-based intensive chemotherapy between 1990 and 2008.2
The hypomethylating agent decitabine (5-aza-2′-deoxycytidine; Dacogen) has been approved by the US Food and Drug Administration for the treatment of myelodysplastic syndrome and by the European Medicines Agency for the treatment of AML, based on data showing efficacy with a favorable toxicity profile in older AML patients. Decitabine is activated intracellularly by deoxycytidine kinase and other nucleotide kinases to the active metabolite 5-aza-2′-deoxycytidine-triphosphate that is incorporated into DNA during the S phase of the cell cycle. Decitabine is believed to exert its antineoplastic effects by inhibition of DNA methyltransferases, causing DNA hypomethylation and expression of tumor suppressor genes involved in differentiation or apoptosis. Decitabine demonstrated promising single-agent efficacy in older patients with AML, with a complete remission (CR) rate of 25%, 30-day mortality of 7%, median OS of 7.7 months, and tolerable toxicity when administered using a schedule of 20 mg/m2 over 1 hour daily for 5 days.3 Of note, patients in that multicenter study received a median of 3 cycles of treatment (range, 1-25 cycles). Several subsequent, single-center trials demonstrated CR rates between 40% and 47% when decitabine was administered at 20 mg/m2 over 1 hour daily for 10 days. Across these studies, induction mortality was <15%, and median survival ranged from 9 to 13 months.4-6 CR was achieved in patients with unfavorable features, including TP53 mutation, complex karyotype, and baseline leukocytosis.
Bortezomib, which is US Food and Drug Administration approved for the treatment of multiple myeloma and mantle cell lymphoma, is a dipeptidyl boronic acid proteasome inhibitor that blocks proteasome ubiquitin–mediated intracellular protein degradation. IΚB, a target of the proteasome complex, regulates expression and activity of NF-κB, which is constitutively activated in AML.7 It has also been shown that bortezomib results in global DNA hypomethylation by interfering with the interplay of Sp1, a ubiquitously expressed transcription factor, and NF-κB.8 Preclinical studies demonstrated bortezomib-induced miR-29b upregulation in AML blasts. High miR-29b expression has been associated with clinical responses to 10 days of decitabine. Therefore, bortezomib was combined with decitabine in a phase 1 trial of adults with relapsed or refractory AML or patients age >60 years with previously untreated AML who were ineligible for or refused standard induction therapy. Among the previously untreated patients (age ≥65 years), 5 of 10 achieved CR (n = 4) or CR with incomplete count recovery (CRi; n = 1); overall, 7 of 19 patients achieved CR/CRi.9
On the basis of these results, the Alliance initiated a randomized phase 2 trial to investigate the efficacy of a 10-day schedule of decitabine in the cooperative group setting and compare outcomes using decitabine alone (arm A) vs decitabine in combination with bortezomib (arm B). In an effort to reflect real-world clinical experience with older AML patients, the study did not exclude patients based on PS or organ function. CALGB is now a part of the Alliance.
Patients and methods
Eligibility criteria and study design
Inclusion criteria included patients age ≥60 years with newly diagnosed AML based on World Health Organization diagnostic criteria. Patients with acute promyelocytic leukemia were excluded. Because of competing Alliance trials, patients with core binding factor leukemias, including t(8;21)(q22;q22), RUNX1-RUNXT1, inv(16)(p13.1q22) or t(16;16)(p13.1;q22), CBFB-MYH11, or FLT3 mutation (internal tandem duplication or point mutation), were excluded unless they were age ≥75 years and/or had an ejection fraction of <40% and/or Eastern Cooperative Oncology Group PS >2. Patients without these specific molecular features were eligible for study participation regardless of PS or organ function. Patients with antecedent hematological disorders were eligible as long as they had not been treated with cytotoxic chemotherapy, decitabine, or bortezomib. Patients with therapy-related myeloid neoplasms were eligible as long as they had not received radiation therapy or chemotherapy for the primary malignancy within the preceding 6 months. This trial was registered at www.clinicaltrials.gov as #NCT01420926 and was approved by the institutional review boards of all participating institutions. The study was performed in accordance with the Declaration of Helsinki, and all participants provided written informed consent.
The study was a phase 2 randomized, multicenter trial in newly diagnosed AML patients age ≥60 years. AML patients were preregistered and screened in CALGB 20202, a companion molecular study to assess FLT3 mutational and core binding factor status. Subsequently, eligible patients signed informed consent for the treatment study. Patients who received at least 1 dose of protocol therapy were evaluable for the primary end point.
Treatment and dose modifications
Patients randomized to arm A were treated with 20 mg/m2 of decitabine for 10 consecutive days in 28-day cycles. Patients randomized to arm B were treated with 20 mg/m2 of IV decitabine for 10 consecutive days plus 1.3 mg/m2 of subcutaneous bortezomib on days 1, 4, 8, and 11. Patients could receive up to 4 10-day treatments with decitabine ± bortezomib to achieve remission. Bone marrow aspiration and biopsy were performed after cycle 2 to assess initial response. Those who did not achieve CR or CRi were treated with 2 more 10-day cycles of decitabine or decitabine plus bortezomib, after which bone marrow aspiration and biopsy were repeated. Thereafter, patients were treated with ongoing monthly 5-day cycles of decitabine or decitabine ± bortezomib (1.3 mg/m2 subcutaneously on day 1) regardless of whether they had achieved remission. For patients in CR/CRi, the postremission monthly 5-day cycles were called maintenance cycles. Patients who did not achieve CR or CRi were eligible to continue on study at investigator discretion and receive ongoing monthly continuation cycles. Maintenance or continuation cycles were continued until disease progression, death, or patient/investigator withdrawal for any reason.
No interruption of therapy for hematological toxicity was recommended during the first 4 cycles with the 10 days of decitabine ± bortezomib induction treatment, except for neutropenia in the presence of hypocellular marrow (<10% cellularity). After achievement of CR/CRi, treatment in the maintenance cycles could be delayed if the absolute neutrophil count was <1 × 10⁹/L and/or platelets <100 × 109/L on day 1 of the maintenance cycle. Treatment could be delayed for up to 42 days to allow for count recovery, after which a bone marrow biopsy was recommended. There was no interruption for hematological toxicity for patients treated on continuation cycles unless marrow hypocellularity was achieved. For grade 3 or 4 drug-related nonhematological toxicities, treatment with decitabine and/or bortezomib was held until the resolution of the toxicity to grade <3, after which treatment was resumed. Missed doses were replaced whenever feasible. For patients treated in arm B, dose reductions for grade 3 neurotoxicity attributed to bortezomib were specified in the protocol, and bortezomib was discontinued for any grade 4 neurotoxicity.
Criteria for response and toxicity
CR was defined as bone marrow biopsy ≥20% cellularity with <5% blasts at the time of hematological recovery (neutrophils >1 × 10⁹/L and/or platelets >100 × 109/L). CRi was defined as CR with the exception of neutropenia <1 × 10⁹/L or thrombocytopenia <100 × 109/L. The National Cancer Institute Common Toxicity Criteria (version 4.0) were used to grade adverse events.
Cytogenetic and molecular analyses
Pretreatment cytogenetic analyses were performed by the institutional cytogenetic laboratories, and the results were confirmed by central karyotype review.10 A minimum of 20 evaluable metaphase cells were required for the karyotype to be considered adequate. A panel of myeloid mutations was evaluated centrally. The patients were classified according to the 2010 European LeukemiaNet classification.1
Randomization, quality control, and quality assurance
Patient registration, data collection, and statistical analyses were carried out by the Alliance Statistics and Data Center. Randomization to the 2 treatment arms was performed through a stratified block randomization scheme with 2 strata (age 60-69 and age ≥70 years). Records from each participating institution were reviewed, and data quality was ensured by review of data by the study chair and the Alliance Statistics and Data Center following Alliance policies.
Sequencing
Library preparation was performed using the TruSeq Custom Amplicon protocol without matching normal samples. Targeted enrichment was performed using the Rapid Heme Panel using 150-bp paired-end reads on an Illumina MiSeq instrument at 1500× mean depth of coverage as described.11 Demultiplexed reads were aligned to the human reference genome (hg19) using the onboard Illumina software. Recurrent known artifacts were filtered. The threshold for variant calling was variant allele fraction >5%. Variants were categorized into missense, splicing, frameshift, stop gain, inframe insertion, and inframe deletion. OncoPrint representation was produced using R/BioConductor12 and the ComplexHeatmap package.13
Statistical analysis
The primary objective of this randomized phase 2 study was to determine if treatment of older (age ≥60 years) AML patients with decitabine combined with bortezomib significantly improved OS compared with decitabine alone. OS was defined as time from randomization to date of death resulting from any cause. Patients alive at the time of analysis were censored for this end point. Assuming a median OS of 6 months in the decitabine arm, exponentially distributed OS times, and follow-up of at least 8.5 months for all patients, 86 evaluable patients per arm (172 total) with an expected 126 events would be needed to detect a hazard ratio of 1.58 comparing decitabine alone vs decitabine plus bortezomib. This would provide a power of 90% with a 1-sided type 1 error rate of 10% using a stratified log-rank test. A planned futility analysis was incorporated after 43 patients were randomized and followed for a minimum of 4 months. If the OS rate at 4 months in the decitabine plus bortezomib arm were at least 5% less than the rate in the decitabine alone arm, the accrual would be terminated.
Kaplan-Meier survival curves and log-rank tests were used to compare the survival distributions between the 2 treatment arms. In addition, Cox proportional hazards models were used to evaluate differences in OS between the treatment arms, with stratification by age. Patients who underwent hematopoietic stem cell transplantation were not censored for outcomes in the primary analysis.
Rates of CR/CRi were compared between the 2 arms using the Mantel-Hansel χ2 test, stratified by age group. The corresponding 95% confidence intervals (CIs) were also estimated for the CR/CRi rates assuming a binomial distribution. Log-rank statistics (2 sided except for primary end point analysis) and Kaplan-Meier plots were used for all time-to-event analyses of secondary end points. Fisher’s exact tests were used to compare the rates of adverse events, mortality, and mutations between the treatment arms and other predefined subgroups.
Results
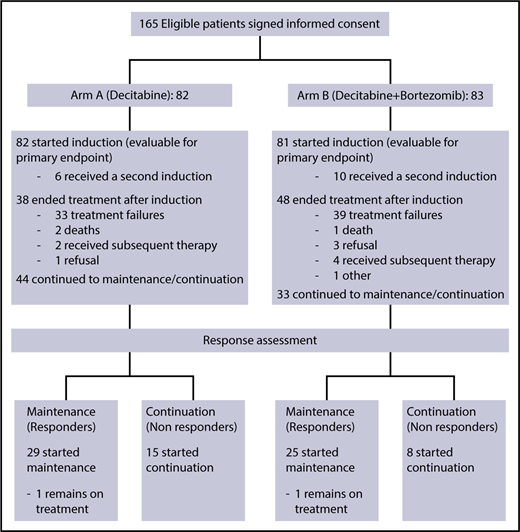
From November 2011 to March 2013, 165 eligible patients signed informed consent for the treatment study and were randomized (CONSORT diagram shown in Figure 1). Two patients withdrew consent before receiving study drug and were deemed inevaluable and excluded from all analyses. Thus, a total of 163 patients were included in this analysis: 82 patients in arm A (decitabine) and 81 patients in arm B (decitabine plus bortezomib). Data for this analysis were frozen on 11 July 2017. The trial closed early after meeting a preplanned futility stopping rule.
Baseline patient characteristics by study arm are listed in Table 1. Median age for the study patients was 72.4 years (range, 60.5-92.3 years), and 113 (69%) were men. The arms were well balanced, except for sex (62% male in arm A vs 77% in arm B; P = .06). Adequate baseline karyotype was available for 147 patients, with 58 (39%) adverse and 41 (28%) intermediate-II, as classified by the European LeukemiaNet. Forty-eight patients (33%) had normal cytogenetics. Thirty-one patients (19%) had baseline PS ≥2, 35 (22%) had an antecedent hematological disorder, and 7 (5%) and 23 (14%) had abnormal baseline cardiac or renal function, respectively. The overall mean white blood cell count at study entry was 13.3 × 10⁹/L (standard deviation, 27.7; range 0.4 × 10⁹/L to 212.7 × 10⁹/L); there was no significant difference between the 2 arms.
Patient characteristics
| Characteristic | n (%) | P* | ||
|---|---|---|---|---|
| Arm A: decitabine (n = 82) | Arm B: decitabine + bortezomib (n = 81) | Total (N = 163) | ||
| Age stratification, y | 1.0 | |||
| 60-69 | 31 (37.8) | 31 (38.3) | 62 (38.0) | |
| ≥70 | 51 (62.2) | 50 (61.7) | 101 (62.0) | |
| Age, y | .59 | |||
| Median | 72.4 | 72.9 | 72.4 | |
| Range | 60.7-92.3 | 60.5-90.0 | 60.5-92.3 | |
| Sex | .06 | |||
| Male | 51 (62.2) | 62 (76.5) | 113 (69.3) | |
| Female | 31 (37.8) | 19 (23.5) | 50 (30.7) | |
| Race | 1.0 | |||
| Unknown | 3 (3.7) | 2 (2.5) | 5 (3.1) | |
| White | 74 (90.2) | 73 (90.1) | 147 (90.2) | |
| Black/African American | 3 (3.7) | 4 (4.9) | 7 (4.3) | |
| Asian | 0 (0.0) | 1 (1.2) | 1 (0.6) | |
| Native Hawaiian or Pacific Islander | 1 (1.2) | 0 (0.0) | 1 (0.6) | |
| Not reported | 1 (1.2) | 0 (0.0) | 1 (0.6) | |
| Multiple races reported | 0 (0.0) | 1 (1.2) | 1 (0.6) | |
| Ethnicity | .76 | |||
| Non-Hispanic | 77 (93.9) | 77 (95.1) | 154 (94.5) | |
| Not reported | 3 (3.7) | 1 (1.2) | 4 (2.5) | |
| Unknown | 2 (2.4) | 3 (3.7) | 5 (3.1) | |
| ECOG PS | .49 | |||
| 0 | 22 (26.8) | 21 (25.9) | 43 (26.4) | |
| 1 | 41 (50.0) | 48 (59.3) | 89 (54.6) | |
| 2 | 16 (19.5) | 11 (13.6) | 27 (16.6) | |
| 3 | 3 (3.7) | 1 (1.2) | 4 (2.5) | |
| Clinical onset of AML | .58 | |||
| De novo | 57 (69.5) | 53 (65.4) | 110 (67.5) | |
| Therapy related | 10 (12.2) | 8 (9.9) | 18 (11.0) | |
| MDS related/AHD | 15 (18.3) | 20 (24.7) | 35 (21.5) | |
| ELN classification | n = 71 | n = 76 | n = 147 | .37 |
| Normal | 20 (28.2) | 28 (36.8) | 48 (32.7) | |
| Intermediate-II | 19 (26.8) | 22 (28.9) | 41 (27.9) | |
| Adverse | 32 (45.1) | 26 (34.2) | 58 (39.5) | |
| Creatinine, mg/dL | n = 82 | n = 80 | n = 162 | .24 |
| Median | 0.9 | 1.0 | 1.0 | |
| Range | 0.0-7.0 | 0.0-2.2 | 0.0-7.0 | |
| ≥1.5 | 12 (14.6) | 11 (13.8) | 23 (14.2) | 1.0 |
| LVEF, % | n = 79 | n = 76 | n = 155 | .68 |
| Median | 61.0 | 60.0 | 60.0 | |
| Range | 30.0-74.0 | 29.0-81.0 | 29.0-81.0 | |
| <45 | 3 (3.8) | 4 (5.3) | 7 (4.5) | .72 |
AHD, antecedent hematologic disorder; ECOG, Eastern Cooperative Oncology Group; ELN, European LeukemiaNet; LVEF, left ventricular ejection fraction; MDS, myelodysplastic syndrome.
For continuous variables, Kruskal-Wallis test; for discrete variables, Fisher’s exact test.
Patients who received at least 1 dose of protocol therapy were evaluable for the primary end point. Figure 2 shows the Kaplan-Meier survival curves for the 2 treatment arms. With a median follow-up of 50.3 months (range, 1.0-55.1 months) for alive patients (including patients who were lost to follow-up/withdrew consent for follow-up), OS was not statistically different between the treatment arms, without censoring for transplantation (median OS, 9.3 months [95% CI, 5.8-12.2] vs 8.9 months [95% CI, 3.8-14.3] for arms A and B, respectively; 1-sided stratified log-rank P = .18; Table 2). The results were not different if patients were censored at the time of transplantation (2-sided stratified log-rank P = .66).
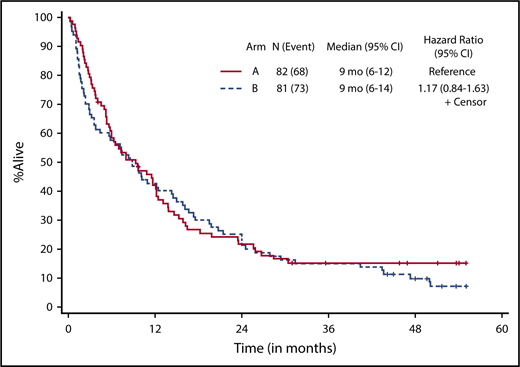
Kaplan-Meier estimate of OS by treatment arm. Arm A, decitabine; arm B, decitabine + bortezomib.
Kaplan-Meier estimate of OS by treatment arm. Arm A, decitabine; arm B, decitabine + bortezomib.
Patient outcomes
| Arm A: decitabine (n = 82) | Arm B: decitabine + bortezomib (n = 81) | P (2 sided) | |
|---|---|---|---|
| n (%; 95% CI) achieving CR + CRi rate | 32 (39; 28-50) | 31 (38; 28-50) | .91* |
| Median (range) time to response, mo | 3.6 (0.9-17.2) | 2.3 (1.7-7.9) | .32† |
| Median (95% CI) duration of response, CR + CRi, mo‡ | 10.9 (5.7-19.6) | 15.3 (10.4-NA) | .15§ |
| Median (95% CI) OS, mo‡ | 9.3 (5.8-12.2) | 8.9 (3.8-14.3) | .18‖ |
| Median (95% CI) OS after transplantation, mo¶ | NA (n = 9) | 31.1 (4.6-NA) | .98§ |
NA, not attained.
Mantel-Haenszel test.
Two-sided rank sum test.
Kaplan-Meier estimate.
Two-sided stratified log-rank test.
One-sided stratified log-rank test.
Landmark Kaplan-Meier estimate from time of transplantation to death resulting from any cause.
Responses are listed in Table 2. The overall response rate (CR + CRi) was 39% (63 of 163), and there was no statistically significant difference in response between the 2 arms, with a CR/CRi rate of 39% (95% CI, 28-50) in arm A and 38% (95% CI, 28-50; P = .91) in arm B. Seventy-two patients (44%) had treatment failure, defined as inability to complete 4 cycles of induction therapy because of progression of disease, death, or other causes, and 17% of patients completed 4 cycles of induction but had no response to treatment. Nineteen responders (31%) underwent allogeneic stem cell transplantation in remission, with a median age of 62.2 years (range, 60.5-72.9 years). Median time to CR/CRi was 3.6 months (range, 0.9-17.2 months) and 2.3 months (range, 1.7-7.9 months) for arms A and B, respectively. Overall, patients received a median of 4.1 months of treatment (range, 0.2-56.7 months). Responders received a median of 5.2 months of maintenance cycles (range, 0.9-52 cycles), and nonresponders received 2.8 months (range, 0.13-29 months) of continuation therapy. There were no statistical differences between the 2 arms with respect to response rate, number of treatment cycles received, or time to response. Among responders (CR + CRi), OS was 11.6 months (95% CI, 8.3-21.9) for arm A and 15.8 months (95% CI, 9.2-22.5) for arm B (2-sided stratified log-rank P = .60).
Of the 163 patients treated, 161 were evaluable for adverse events. Table 3 summarizes nonhematological adverse events in >10% of patients, regardless of attribution. Hematological toxicities were as expected and observed in all patients. Febrile neutropenia was also observed in all patients at some point during their treatment. There were no statistically significant differences between arms A and B in the incidence of maximum grade 3 (20 [25%] vs 28 [35%]; Fisher’s exact P = .17), maximum grade 4 (25 [31%] vs 18 [23%]; P = .29), or maximum grade 5 events (28 [35%] vs 27 [34%]; P = 1.0). Thirty-, 60-, and 90-day mortality rates were 4% vs 5% (P = .5), 11% vs 25% (P = .03), and 20% vs 33% (P = .05) in arms A and B, respectively.
Nonhematological adverse events in >10% of patients, regardless of attribution
| Adverse event* by arm† | n (%) | |||
|---|---|---|---|---|
| Grade 3 | Grade 4 | Grade 5 | Total | |
| Fatigue | ||||
| A | 12 (14.8) | 0 | 0 | 12 (14.8) |
| B | 16 (20) | 0 | 0 | 16 (20) |
| Infections and infestations | ||||
| A | 10 (12.3) | 1 (1.2) | 1 (1.2) | 12 (14.7) |
| B | 10 (12.5) | 0 | 1 (1.3) | 11 (13.8) |
| Sepsis | ||||
| A | 0 | 11 (13.6) | 5 (6.2) | 16 (19.8) |
| B | 0 | 5 (6.3) | 6 (7.5) | 11 (13.8) |
| Lung infection | ||||
| A | 16 (19.8) | 2 (2.5) | 2 (2.5) | 20 (24.8) |
| B | 20 (25) | 0 | 2 (2.5) | 22 (27.5) |
| Hyperglycemia | ||||
| A | 10 (12.3) | 3 (3.7) | 0 | 13 (16) |
| B | 13 (16.3) | 0 | 0 | 13 (16.3) |
| Hypoalbuminemia | ||||
| A | 16 (19.8) | 0 | 0 | 16 (19.8) |
| B | 10 (12.5) | 0 | 0 | 10 (12.5) |
| Hypocalcemia | ||||
| A | 7 (8.6) | 3 (3.7) | 0 | 10 (12.3) |
| B | 3 (3.8) | 1 (1.3) | 0 | 4 (5.1) |
| Hypokalemia | ||||
| A | 10 (12.3) | 3 (3.7) | 0 | 13 (16) |
| B | 12 (15) | 1 (1.3) | 0 | 13 (16.3) |
| Hypophosphatemia | ||||
| A | 9 (11.1) | 0 | 0 | 9 (11.1) |
| B | 6 (7.5) | 0 | 0 | 6 (7.5) |
| Peripheral sensory neuropathy | ||||
| A | 0 | 0 | 0 | 0 |
| B | 8 (10) | 2 (2.5) | 0 | 10 (12.5) |
| Dyspnea | ||||
| A | 9 (11.1) | 0 | 0 | 9 (11.1) |
| B | 10 (12.5) | 1 (1.3) | 0 | 11 (13.8) |
| Hypoxia | ||||
| A | 6 (7.4) | 1 (1.2) | 0 | 7 (8.6) |
| B | 8 (10) | 0 | 1 (1.3) | 9 (11.3) |
| Hypertension | ||||
| A | 6 (7.4) | 0 | 0 | 6 (7.4) |
| B | 14 (17.5) | 0 | 0 | 14 (17.5) |
| Hypotension | ||||
| A | 11 (13.6) | 3 (3.7) | 0 | 14 (17.3) |
| B | 10 (12.5) | 4 (5) | 0 | 14 (17.5) |
Excludes hematological toxicity and febrile neutropenia, which were observed in all patients.
Regardless of attribution, per National Cancer Institute Common Toxicity Criteria (version 4.0).
161 patients were evaluated for adverse events: arm A (decitabine), n = 81; arm B (decitabine + bortezomib), n = 80.
Figure 3 shows the mutational oncoprint plot for patients enrolled in the study for whom mutational analyses were available (n = 118). Mutations in the following genes were seen in >10% of patients: ASXL1 (23%), TP53 (22%), DNMT3A (20%), SRSF2 (19%), U2AF1 (18%), TET2 (17%), RUNX1 (16%), NPM1 (15%), and IDH2 (15%). Only 6 patients did not have identifiable mutations, and there was a median of 2 mutations (range, 0-7 mutations) per patient (Table 4). The frequencies of individual mutations were distributed equally among the 2 treatment groups, and there were no statistically significant differences in outcomes between the treatment arms by mutational status (Table 5). In the overall study population, patients with IDH2 mutations had better 1-year survival rates than patients without the mutation (70% vs 40%; P = .03), and patients with TP53 mutations had worse 1-year survival than those without the mutation (19% vs 51%; P = .004; supplemental Table 1).
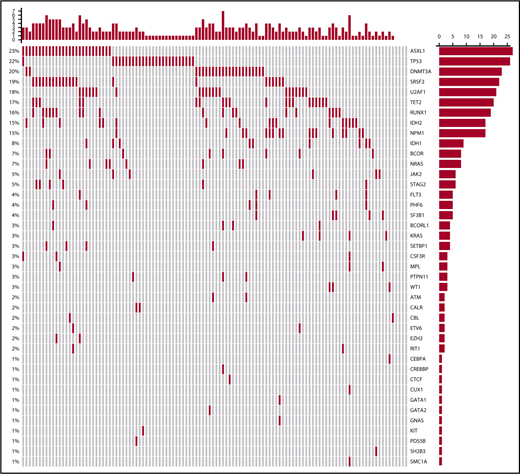
Oncoprint of mutations found in all treated patients. Each column corresponds to an individual patient, and each row corresponds to a specific mutation, the frequency of which is indicated as a percentage on the left of the figure and as a bar graph on the right. The bar plot on the right indicates the number of mutated patients. The bar plot at the top indicates the number of mutations in each patient.
Oncoprint of mutations found in all treated patients. Each column corresponds to an individual patient, and each row corresponds to a specific mutation, the frequency of which is indicated as a percentage on the left of the figure and as a bar graph on the right. The bar plot on the right indicates the number of mutated patients. The bar plot at the top indicates the number of mutations in each patient.
Number of mutations per patient by treatment arm
| No. of mutations per patient | n (%) | ||
|---|---|---|---|
| Arm A: decitabine (n = 56) | Arm B: decitabine + bortezomib (n = 62) | All patients (N = 118) | |
| 0 | 2 (3.6) | 4 (6.5) | 6 (5.1) |
| 1 | 15 (26.8) | 12 (19.4) | 27 (22.9) |
| 2 | 13 (23.2) | 19 (30.6) | 32 (27.1) |
| 3 | 16 (28.6) | 8 (12.9) | 24 (20.3) |
| 4 | 7 (12.5) | 12 (19.4) | 19 (16.1) |
| 5 | 2 (3.6) | 4 (6.5) | 6 (5.1) |
| 6 | 1 (1.8) | 2 (3.2) | 3 (2.5) |
| 7 | 0 (0.0) | 1 (1.6) | 1 (0.8) |
| Median (range) | 2 (0-6) | 2 (0-7) | 2 (0-7) |
CR and 1-y survival by mutational status and treatment arm
| Mutation | n (%; 95% CI) of patients | Fisher’s exact P (2 sided) | |
|---|---|---|---|
| Arm A: decitabine (n = 56) | Arm B: decitabine + bortezomib (n = 62) | ||
| ASXL1 | n = 14 | n = 13 | |
| CR* | 2 (14; 2-43) | 2 (15; 2-45) | 1.0 |
| 1-y survival† | 6 (43; 23-79) | 7 (54; 33-89) | .71 |
| No ASXL1 | n = 42 | n = 49 | |
| CR* | 8 (19; 9-34) | 13 (27; 15-41) | .46 |
| 1-y survival† | 16 (42; 29-60) | 23 (47; 35-63) | .52 |
| DNMT3A | n = 9 | n = 14 | |
| CR* | 1 (11; 0-48) | 3 (21; 5-51) | 1.0 |
| 1-y survival† | 3 (33; 7-70) | 7 (50; 23-77) | .67 |
| No DNMT3A | n = 47 | n = 48 | |
| CR* | 9 (19; 9-33) | 12 (25; 14-40) | .62 |
| 1-y survival† | 19 (40; 26-56) | 23 (48; 33-63) | .54 |
| IDH2 | n = 8 | n = 9 | |
| CR* | 2 (25; 3-65) | 2 (22; 3-60) | 1.0 |
| 1-y survival† | 5 (63; 24-91) | 7 (78; 40-97) | .62 |
| No IDH2 | n = 48 | n = 53 | |
| CR* | 8 (17; 7-30) | 13 (25; 14-40) | .46 |
| 1-y survival† | 17 (35; 22-51) | 23 (43; 30-58) | .42 |
| NPM1 | n = 6 | n = 11 | |
| CR* | 2 (33; 4-78) | 3 (27; 6-61) | 1.0 |
| 1-y survival† | 3 (50; 12-88) | 7 (64; 31-89) | .64 |
| No NPM1 | n = 50 | n = 51 | |
| CR* | 8 (16; 7-29) | 12 (24; 13-37) | .46 |
| 1-y survival† | 19 (38; 25-53) | 23 (45; 31-60) | .55 |
| RUNX1 | n = 9 | n = 10 | |
| CR* | 2 (22; 3-60) | 1 (10; 0-45) | .58 |
| 1-y survival† | 5 (56; 21-86) | 5 (50; 19-81) | 1.0 |
| No RUNX1 | n = 47 | n = 52 | |
| CR* | 8 (17; 8-31) | 14 (27; 67-41) | .33 |
| 1-y survival† | 17 (36; 23-51) | 25 (48; 34-62) | .31 |
| TET2 | n = 8 | n = 12 | |
| CR* | 1 (13; 0-53) | 3 (25; 5-57) | .62 |
| 1-y survival† | 3 (38; 9-76) | 6 (50; 21-79) | .67 |
| No TET2 | n = 48 | n = 50 | |
| CR* | 9 (19; 9-33) | 12 (24; 13-38) | .63 |
| 1-y survival† | 19 (40; 26-55) | 24 (48; 34-63) | .42 |
| TP53 | n = 14 | n = 12 | |
| CR* | 3 (21; 5-51) | 2 (17; 2-48) | 1.0 |
| 1-y survival† | 3 (27; 11-66) | 2 (17; 5-59) | 1.0 |
| No TP53 | n = 42 | n = 50 | |
| CR* | 7 (17; 7-31) | 13 (26; 15-40) | .32 |
| 1-y survival† | 19 (47; 34-65) | 28 (56; 44-72) | .40 |
Binomial estimate for subgroups with ≤10 patients in a comparison.
Kaplan-Meier estimate.
Discussion
This study was the first cooperative group trial investigating the safety and efficacy of repeated 10-day cycles of decitabine in newly diagnosed older patients with AML. The overall response rate was 39%, with a median OS of 9.3 months. As is often the case with multicenter trials, the outcomes were slightly worse than those observed with single-center studies using 10-day schedules of decitabine (CR, 40%-47%; median OS, 9-13 months). However, the results in this trial were better than the 25% CR rate and median OS of 7.7 months achieved in a previous multicenter trial using 5-day cycles of decitabine. Furthermore, the present study confirms that older AML patients with adverse clinical and biological features can achieve remission with 10-day cycles of decitabine and proceed to allogeneic stem cell transplantation. Despite a strong scientific rationale and favorable phase 1 data, the addition of bortezomib to decitabine did not lead to improved outcomes. Instead, there seemed to be a small increase in 60-day mortality in the investigational arm.
Intensive chemotherapy is not feasible for many older patients with AML because of poor PS and/or medical comorbidities. Standard lower-intensity alternatives include decitabine, azacitidine, and low-dose cytarabine, all of which have better tolerability and overall toxicity compared with standard anthracycline- and cytarabine-based strategies. However, patients treated with standard schedules of 10 to 14 days of low-dose cytarabine, 5 days of decitabine, or 7 days of azacitidine have had CR/CRi rates of only 10% to 25% and median OS of <1 year, depending on the study. Although achievement of CR does not always translate into improved OS for older patients with AML treated in clinical trials, most clinicians and patients believe that both quality and length of life are improved if remission is achieved. In our study, as in most AML studies, responders lived significantly longer than nonresponders. Also, although this study was not designed to evaluate posttransplantation outcomes, emerging data suggest that older AML patients who are able to proceed to allogeneic stem cell transplantation have longer survival than those who do not. In this study, 30% of responders underwent allogeneic transplantation. An ongoing trial by the European Organisation for Research and Treatment of Cancer (registered at www.clinicaltrials.gov as #NCT02172872) is randomizing older patients with AML to standard chemotherapy (induction) vs 10 days of decitabine (inDACtion), followed by allogeneic stem cell transplantation for eligible responding patients. Results of this trial are eagerly anticipated.
A recent study by Welch et al14 showed specific efficacy of decitabine administered according to a 10-day schedule in patients with TP53 mutations and/or unfavorable cytogenetics. In their analysis, 46% of patients (n = 116) had clearance of bone marrow blasts to <5%, as well as significant mutational clearance. Responses were actually higher among patients with a TP53 mutation (100% vs 41%), and OS was the same as for AML patients with intermediate-risk cytogenetics treated with the same regimen. Our study did not confirm a significantly higher rate of remission in patients with a TP53 mutation, but some patients with adverse and complex karyotypes did achieve CR. Unfortunately, there are no published data directly comparing induction with 5 vs 10 days of decitabine in older patients with AML. The data from Welch et al,14 combined with the outcomes reported in the present clinical trial and the 4 previously referenced single-arm trials using decitabine in a 10-day schedule, suggest that 10 days of decitabine results in higher response rates for older patients with AML and that further investigation, preferably in a randomized manner, is warranted. Because ongoing trials of novel agents (eg, venetoclax; registered at www.clinicaltrials.gov as #NCT02203773) combined with decitabine seem promising, it may also be worthwhile to investigate if outcomes with these agents could be further improved using an extended schedule of decitabine. Finally, because the rates of CR/CRi, OS, and stem cell transplantation in CALGB 11002 are higher than those in previous CALGB trials of older AML patients, the 10-day decitabine treatment regimen can serve as a comparator or control arm for additional cooperative group trials.
The full-text version of this article contains a data supplement.
Acknowledgments
This work was supported by the National Cancer Institute of the National Institutes of Health under awards U10CA180821 and U10CA180882 to the Alliance for Clinical Trials in Oncology, U10CA180836, U10CA180850, U10CA180866, U10CA180867, and P30CA033572, and in part by Millennium Pharmaceuticals, Inc. (now owned by Takeda Pharmaceutical Company Limited).
The content is solely the responsibility of the authors and does not necessarily represent the official views of the National Institutes of Health.
The following institutional networks participated in this study: Cancer Research Consortium of West Michigan National Cancer Institute (NCI) Community Oncology Research Program (NCORP), Grand Rapids, MI, Kathleen Yost, UG1CA189860; Dana-Farber/Partners CancerCare Lead Academic Participating Site (LAPS), Boston, MA, Harold Burstein, U10CA180867; Dartmouth College–Norris Cotton Cancer Center LAPS, Lebanon, NH, Konstantin Dragnev, U10CA180854; Delaware/Christiana Care NCORP, Newark, DE, Gregory Masters, UG1CA189819; Eastern Maine Medical Center Cancer Care, Brewer, ME, Thomas Openshaw; MedStar Georgetown University Hospital, Washington, DC, Chaitra Ujjani; Mount Sinai Hospital, New York, NY, Lewis Silverman; NCORP of the Carolinas (Greenville Health System NCORP), Greenville, SC, Jeffrey Giguere, UG1CA189972; NorthShore University HealthSystem–Evanston Hospital, Evanston, IL, David Grinblatt; Ohio State University Comprehensive Cancer Center LAPS, Columbus, OH, Claire Verschraegen, U10CA180850; Roswell Park Cancer Institute LAPS, Buffalo, NY, Ellis Levine, U10CA180866; Southeast Clinical Oncology Research (SCOR) Consortium NCORP, Winston-Salem, NC, James Atkins, UG1CA189858; UNC Lineberger Comprehensive Cancer Center LAPS, Chapel Hill, NC, Thomas Shea, U10CA180838; University of Chicago Comprehensive Cancer Center LAPS, Chicago, IL, Hedy Kindler, U10CA180836; University of Iowa/Holden Comprehensive Cancer Center, Iowa City, IA, Laith Abushahin; University of Missouri–Ellis Fischel, Columbia, MO, Puja Nistala; Wake Forest University Health Sciences, Winston-Salem, NC, Heidi Klepin; and Weill Medical College of Cornell University, New York, NY, Scott Tagawa.
Authorship
Contribution: G.J.R., S.J.M., G.M., and R.M.S. designed the research; G.J.R., E.C.A., P.D., A.R.W., E.S.W., J.E.K., B.L.P., W.S., G.M., R.M.S., and R.A.L. performed research; L.G., D.C.H., J.J.-V., M.B., and A.T. contributed vital new reagents or analytical tools; G.J.R., S.J.M., K.L., and J.K. collected data; G.J.R., S.J.M., K.L., J.K., K.M., C.D.B., D.C.H., and R.A.L. analyzed and interpreted data; S.J.M., K.L., and J.K. performed statistical analysis; and G.J.R. wrote the manuscript.
Conflict-of-interest disclosure: G.J.R. has consulted for AbbVie, Actinium, Amphivena, Argenx, Array BioPharma, Astex, Astellas, Bayer, Celgene, Celltrion, CTI BioPharma, Daiichi Sankyo, Eisai, Janssen, Jazz, MedImmune, MEI Pharma, Novartis, Orsenix, Otsuka, Pfizer, Roche/Genentech, Sunesis, Sandoz, and Takeda and received compensation. E.C.A. is currently employed by and has equity ownership in Agios. L.G. is currently employed by Eli Lilly and Company and has ownership interests in Foundation Medicine and Tango Therapeutics. The remaining authors declare no competing financial interests.
The current affiliation for E.C.A. is Agios Pharmaceuticals, Cambridge, MA.
The current affiliation for L.G. is Eli Lilly and Company, Indianapolis, IN.
Correspondence: Gail J. Roboz, Weill Cornell Medical College, New York Presbyterian Hospital, 520 East 70th St, New York, NY 10021; e-mail: gar2001@med.cornell.edu.

