

Key Points
p53 directly and indirectly represses CD46 expression and MV infection in myeloma cells.
p53-deficient myeloma cells are highly sensitive to MV.

Abstract
In this study, we assessed the sensitivity of myeloma cells to the oncolytic measles virus (MV) in relation to p53 using 37 cell lines and 23 primary samples. We showed that infection and cell death were correlated with CD46 expression, which was associated with TP53 status; TP53abn cell lines highly expressed CD46 and were preferentially infected by MV when compared with the TP53wt cell lines (P = .046 and P = .045, respectively). Infection of myeloma cells was fully dependent on CD46 expression in both cell lines and primary cells. In the TP53wt cell lines, but not the TP53abn cell lines, activation of the p53 pathway with nutlin3a inhibited both CD46 expression and MV infection, while TP53 silencing reciprocally increased CD46 expression and MV infection. We showed using a p53 chromatin immunoprecipitation assay and microRNA assessment that CD46 gene expression was directly and indirectly regulated by p53. Primary myeloma cells overexpressed CD46 as compared with normal cells and were highly infected and killed by MV. CD46 expression and MV infection were inhibited by nutlin3a in primary p53-competent myeloma cells, but not in p53-deficient myeloma cells, and the latter were highly sensitive to MV infection. In summary, myeloma cells were highly sensitive to MV and infection inhibition by the p53 pathway was abrogated in p53-deficient myeloma cells. These results argue for an MV-based clinical trial for patients with p53 deficiency.
Introduction
TP53 is the most frequently deleted and/or mutated gene in cancers, and these deletions and mutations are associated with resistance to therapy in numerous cancers, including multiple myeloma (MM). In MM patients and B-cell malignancies, del(17p) and TP53 mutations are frequently associated.1,2 Although treatments for these diseases have improved in the past decade, patients with t(4;14) and/or deletion of the short arm of chromosome 17 (del(17p)) have a reduced response to all treatments.3,4 Although the role of p53 loss in tumor emergence was recently shown to be related to its loss of DNA repair coordination, resistance to therapy is assumed to be related to the inability of the p53-defective protein to transactivate apoptotic genes such as BBC3 (Puma), PMAIP1 (Noxa), and BAX.5 While alkylating agents and proteasome inhibitors form the backbone of therapies for MM, p53-deficient myeloma cells are more resistant to these drugs than p53 normal myeloma cells.6 Thus, there is an obvious need for compounds that bypass or circumvent the defective p53 pathway. While a p53 deficiency provides a resistant phenotype to the tumors, this deficiency could also represent a therapeutic vulnerability, as p53 has numerous functions, including the control of viral infection. Indeed, vesicular stomatitis virus infection and replication were reported to be directly dependent on p53; mice expressing an additional TP53 copy were resistant to vesicular stomatitis virus, while those lacking TP53 were highly sensitive.7 It is well known that several viral proteins, such as ubiquitin ligase (E6-AP) or ubiquitin peptidase (HAUSP), inhibit the p53 pathway, preventing the antiviral response.8,9 Tumor cells are known to be highly sensitive to viruses, although the mechanism is not fully understood.10-15 On the one hand, p53 deficiency in tumor cells might favor virus replication, because (1) p53 is involved in the antiviral response16,17 and (2) p53 is involved, along with DNA methylation, in the silencing of junk DNA of viral origin, whose re-expression induces a type I interferon (IFN) response, as shown by Leonova and Kudkov in mouse embryonic fibroblast cells.18 Thus, the emergence of p53-deficient hypomethylated tumors might imply that cells have lost their type I IFN response, making them unable to respond to viral infections. On the other hand, tumor cells often overexpress negative regulators of complement binding, such as CD55, CD59, and CD46, which are thought to prevent the complement-mediated lysis of tumor cells.19,20 CD46 is a receptor for many viruses and is the main receptor for the vaccine strains of the measles virus (MV).21 CD46 overexpression is reported to be related to the activated STAT3, NF-κB, and ERK pathways; interleukin production; the tumor microenvironment,; and chromosome 1q amplification in myeloma.22-25 Myeloma cells, which overexpress CD46, were shown to be highly sensitive to vaccine MV Edmonston strain.13,20 This first study demonstrated that an MV-based treatment of patients was feasible, and 1 patient reached a stable remission. Recently, the same group at Mayo Clinic completed a phase 1 study showing that MV administered IV to patients with advanced MM selectively propagated in myeloma deposits throughout the body.26
In the present work, we evaluated the role of p53 in the sensitivity of myeloma cells to the MV Schwarz strain across a collection of 37 human myeloma cell lines (HMCLs) and in 23 independent primary samples characterized for TP53 status to assess whether MV could be of interest for p53-deficient myeloma cells.
Materials and methods
HMCLs and primary samples
All cell lines used in this study have been extensively characterized.27-31 TP53 and RAS mutations were performed by whole-exon sequencing32 and confirmed by direct sequencing of reverse transcription polymerase chain reaction (RT-PCR) products.29 p53 deficiency was confirmed by resistance to nutlin3a.30,31,33 After obtaining informed consent, blood or bone marrow samples from patients with MM were collected at the Department of Hematology of the Nantes University Hospital (ethical approval number DC-2011-1399). Plasma cells were obtained after gradient density centrifugation using Ficoll-Hypaque. del(17p) was assessed by fluorescence in situ hybridization.1 Gene expression in the myeloma cells and the cell lines was assessed using microarray, HMCLs (TABM-937 and E-TABM-1088), MM, bone marrow plasma cells from healthy donors, monoclonal gammopathy of undetermined significance, and smoldering myeloma (accession numbers GSE5900 and GSE4581).
Reagents and antibodies
Live-attenuated Schwarz vaccine strains of the MV, recombinant or not for enhanced green fluorescent protein (MV-GFP), were produced at the Pasteur Institute.21 Anti-CD138–allophycocyanin (APC), immunoglobulin G1–APC, anti-CD46–phycoerythrin (PE) and control immunoglobulin G1–PE monoclonal antibodies (mAbs) were purchased from BD Biosciences (Le Pont de Claix, France), and anti-DR5-PE and anti-CD150-PE were purchased from Clinisciences (Paris, France) and Miltenyi (Paris, France), respectively. Anti-p53, anti-MDM2, anti-p21, and anti-actin antibodies were purchased from Oncogene Science (Life Technologies, Paris, France), R&D Systems Europe (Lille, France), Cell Signaling (Ozyme, St Quentin en Yvelines, France), and Millipore Bioscience Research Reagents (Molsheim, France), respectively. Small interfering RNAs (siRNAs; On-Target plus smart pool) were purchased from Dharmacon (Thermo Fisher Scientific, Villebon sur Yvette, France). Blocking anti-CD46 mAb was purchased from Hycult Biotech (CliniSciences, Nanterre, France).
Quantitative RT-PCR and siRNA experiments
CD46 and TNFRSF10B (DR5) messenger RNA (mRNA) expression was assessed by quantitative RT-PCR using TaqMan assays with Hs00611247_m1 and Hs00366278_m1 probes, respectively (Applied Biosystems, Thermo Fischer Scientific). Transient CD46 or TP53 silencing was performed in BCN and LP1 myeloma cells using Amaxa technology or Lipofectamine, respectively, as previously reported.31
To quantify the MV copy number in cells, total RNA was extracted 3 days after infection, and the level of nucleocapsid gene (N) mRNA was assessed by quantitative RT-PCR as previously described (with modifications developed by the Measles Virus French National Reference Center).34
Infection and cell death assays
Cell lines (25 000 cells) were incubated with MV-GFP (multiplicity of infection [MOI] = 1) for 2 hours in 50 μL (culture medium) and were then cultured for 4 days at 125 000 cells/mL. Unpurified primary cells (500 000 cells) were incubated for 2 hours with MV-GFP (MOI = 1) in 100 μL (culture medium) and then cultured for 4 days at 1500 000 cells/mL. GFP fluorescence and cell viability were assessed using flow cytometry (Cytocell; SFR Bonamy, Nantes, France). The fluorescence acquisition and analysis were performed using FACsCalibur with Cell Quest software (Becton Dickinson) or FlowJo software (Ashland, OR). Evaluation of cell death in HMCLs and primary cells was performed by altered morphology (decreased forward scatter [FSC] and increased side scatter [SSC] or Live/Dead staining, Molecular Probes, Thermo Fisher Scientific) and loss of CD138 staining, respectively.30,31
ChIP assays
Cells (15 × 106) were treated or not for 5 hours with 10 μM nutlin3a. Chromatin immunoprecipitation (ChIP) was conducted following supplier’s protocol (Active Motif, La Hulpe, Belgium) using anti-p53 mAb (Diagenode, Seraing, Belgium). PCR amplification of p53-BS in the CD46 gene was conducted before (input) and after ChIP assays with specific primers (forward 5′ATTATGACAAGGCCGAGCAC-3′ and reverse 5′-TCCTGAGTGGCTGGGATTAC-3′) generating a 189-pb amplicon that overlapped p53-BS located at −44 420 bp.35 As a negative control, we performed PCR amplification in a nearby region (−43 320 bp) lacking the p53-binding site (forward 5′-TCTTGGAAGCAGAGGGAGAA-3′ and reverse 5′-AAGCCAGGCTGACACCTAAA-3′, 210-pb amplicon). PCR amplification in the TNFRSF10B gene was conducted as previously reported.30
IFN assays
Four days after MV-GFP addition, supernatants were collected, centrifuged at 3000 rpm, and kept at −80°C. Concentrations of IFN-α and IFN-β were determined using the VeriKine Human Interferon Alfa and β ELISA assays (Merck Millipore, St Quentin en Yvelines, France).
Statistical analyses
Statistical analyses were performed using the Kruskal-Wallis, Student t, Spearman, Mann-Whitney U, and paired Wilcoxon matched-paired signed rank tests, as indicated in the of figure legends (GraphPad Prism 7).
Results
HMCLs sensitivity to MV correlates with CD46 expression and TP53 status
MV infection and cell death were assessed in 37 HMCLs displaying different 14q32 translocations, TP53 and RAS statuses (Table 1). The live-attenuated Schwarz strain MV was previously modified to express GFP (MV-GFP).21 Cell death and GFP assays were performed 4 days after infection (MOI=1) using flow cytometry. HMCLs displayed a heterogeneous sensitivity to MV-GFP, ranging from 1% to more than 80% of GFP+ cells (Table 1). Live attenuated Schwarz strain MV is known to bind to CD46, CD150 and nectin4.11,36 CD46 but not SLAMF1 (CD150) or PVLR4 (nectin 4) was expressed in all HMCLs although at varying levels (Table 1; supplemental Figure 1A; supplemental Table 1A). Expression of CD46 directly correlated with both GFP fluorescence and cell death (P = .025 and P = .0006, respectively), which were directly correlated (P < .0001) (Figure 1A). As shown in Figure 1B, expression of GFP and CD46 correlated with TP53 status (P = .0449 and P = .0457, respectively), and cell death showed a correlation trend with TP53 status (P = .1309). Indeed, compared with TP53wt, TP53abn HMCL-overexpressed CD46 (median 54 vs 27.5), were significantly more GFP positive (median 15% vs 4.5%) and were more sensitive to MV-GFP (median 14.4% vs 3%). By contrast, CD46 expression or MV sensitivity was not correlated to recurrent translocations or RAS status, Figure 1C-D.
HMCL characteristics and response to MV-GFP
| HMCL characteristics | MV-GFP response | |||||
|---|---|---|---|---|---|---|
| p53 status and name | TP53 | RAS (H/N/K) | CD46 MFIR | GFP, % | Cell death, % | IFN-α, pg/mL |
| TP53wt | ||||||
| NAN9 | WT | WT | 21 | 4.5 | 0.3 | 0 |
| SBN | WT | WT | 6 | 0.1 | 1.6 | 0 |
| BCN | WT | WT | 64 | 36.5 | 63.6 | 550 |
| AMO1 | WT | K_A146T | 11 | 1.1 | 1.0 | 0 |
| MDN | WT | N_G13D | 28 | 4.4 | 0.6 | 0 |
| MM1S | WT | K_G12A | 110 | 22.9 | 29.0 | 8 |
| NAN11 | WT | H_G13V | 76 | 15.5 | 21.0 | 80 |
| NCI-H929 | WT | N_G13D | 27 | 1.6 | 4.2 | 0 |
| XG3 | WT | N_Q61K | 17 | 1.6 | 0.5 | 0 |
| XG6 | WT | K_Q61E | 80 | 0.7 | 1.8 | 0 |
| XG7 | WT | K_G12C | 33 | 61.5 | 28.2 | 350 |
| XG10 | WT | K_G13C | 20 | 17.0 | 57.0 | 0 |
| TP53abn | ||||||
| ANBL6 | Q331*/− | WT | 31 | 8.5 | 11.0 | 0 |
| JIM3 | R273C/− | WT | 30 | 61.3 | 20.9 | 0 |
| KMS11 | −/− | WT | 137 | 72.7 | 84.5 | 0 |
| KMS12BM | R337L/− | WT | 53 | 79.1 | 14.1 | 80 |
| KMS12PE | R337L/− | WT | 45 | 60.0 | 31.7 | 34 |
| LP1 | E286K/− | WT | 48 | 81.6 | 44.0 | 160 |
| NAN6 | Δ exons 7-8-9/− | WT | 55 | 11.0 | 10.0 | 0 |
| NAN8 | D21Y/- | WT | 22 | 1.0 | 6.2 | 0 |
| OPM2 | R175H/− | WT | 38 | 11.6 | 7.0 | 0 |
| SKMM2 | K132N/− | WT | 30 | 20.5 | 13.5 | 17 |
| XG5 | R282W/− | WT | 105 | 39.5 | 21.3 | 0 |
| NAN1 | E180*/− | WT | 21 | 10.0 | 13.5 | 0 |
| U266 | A161T/− | WT | 17 | 5.6 | 19.1 | 43 |
| JJN3 | −/− | N_G12D | 66 | 47.7 | 49.3 | 0 |
| KARPAS620 | C135Y/− | K_G12D | 56 | 9.3 | 8.9 | 450 |
| KMM1 | C135F/S241F | N_G12A | 62 | 17.4 | 20.9 | 0 |
| L363 | S261T/− | N_Q61H | 54 | 14.4 | 12.3 | 0 |
| NAN10 | A161D/− | N_G12R | 51 | 13.8 | 4.6 | 0 |
| NAN3 | R248Q/− | N_Q61K | 80 | 5.0 | 17.0 | 0 |
| NAN7 | Δ exon 11/− | N_G12D | 29 | 1.0 | 1.6 | 0 |
| RPMI8226 | E285K/− | K_G12A | 165 | 48.5 | 31.0 | 0 |
| XG1 | Y126N/− | N_G12R | 100 | 28.5 | 14.4 | 96 |
| XG2 | C176Y/R213* | K_G12A | 145 | 5.5 | 13.0 | 0 |
| XG11 | C135Y/− | K_K117N | 83 | 66.7 | 65.9 | 0 |
| XG16 | Y220C/− | N_Q61H | 87 | 15.0 | 22.0 | 0 |
The response to MV-GFP response was assessed 4 days after infection (MOI = 1) using flow cytometry. Infected cells were determined using GFP fluorescence (expressed as the percentage of positive cells). Cell death was measured using Live/Dead staining or by the altered morphology (reduced FSC and increased SSC). Results represent the mean of 4 to 5 independent experiments. CD46 expression was expressed as the mean fluorescence intensity ratio (MFIR). CD46 and control MFI values are provided in supplemental Table 1A).
−, deletion; WT, wild-type.
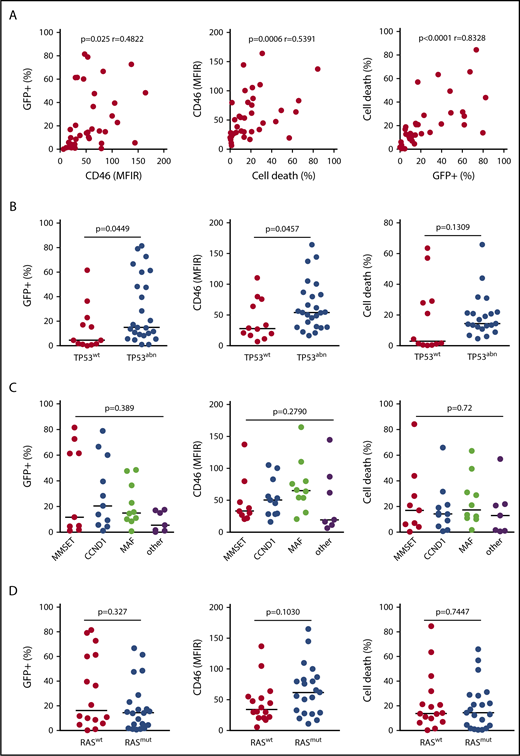
HMCLs with abnormalities in the TP53 gene are highly sensitive to MV. Cells (25 000 in 200 μL) were incubated with MV-GFP (MOI = 1) for 4 days, and GFP expression (Fl1) was assessed by flow cytometry. The data represent the means of at least 3 independent experiments in 37 cell lines (each point represents 1 cell line). (A) Results were analyzed according to GFP expression, CD46 expression, and cell death. CD46 expression and cell death were assessed respectively by fluorescence (MFIR, or specific staining over control staining) and altered morphology (reduced FSC and increased SSC) using flow cytometry. The statistical analyses were performed using the Spearman test. (B-D) Results were analyzed according to TP53 status, 14q32 translocations, and RAS status, respectively. 14q32 translocations are indicated by their respective deregulated gene (MAF includes c-MAF and MAFB).29 Statistical analyses were performed using the Mann-Whitney U test.
HMCLs with abnormalities in the TP53 gene are highly sensitive to MV. Cells (25 000 in 200 μL) were incubated with MV-GFP (MOI = 1) for 4 days, and GFP expression (Fl1) was assessed by flow cytometry. The data represent the means of at least 3 independent experiments in 37 cell lines (each point represents 1 cell line). (A) Results were analyzed according to GFP expression, CD46 expression, and cell death. CD46 expression and cell death were assessed respectively by fluorescence (MFIR, or specific staining over control staining) and altered morphology (reduced FSC and increased SSC) using flow cytometry. The statistical analyses were performed using the Spearman test. (B-D) Results were analyzed according to TP53 status, 14q32 translocations, and RAS status, respectively. 14q32 translocations are indicated by their respective deregulated gene (MAF includes c-MAF and MAFB).29 Statistical analyses were performed using the Mann-Whitney U test.
To confirm that GFP expression relied on the virus quantity, quantitative RT-PCR assays of nucleocapsid (N) mRNA expression were performed in several cell lines displaying various levels of GFP expression at day 4 (AMO1, BCN, JIM3, and LP1). As shown in supplemental Figure 1B, quantitative RT-PCR expression of gene N directly correlated with both the proportion of GFP+ cells and the intensity level. To assess whether resistance of cells relied on a weak MOI or was related to IFN secretion, MOI was increased and IFN production was determined in the supernatants. Despite an infection with an MOI = 10, AMO1, NAN8, and XG6 remained resistant to MV-GFP (supplemental Figure 1C). While HMCLs did not secrete IFN-β (data not shown), 11 of them secreted IFN-α at concentrations ranging from 8 to 550 pg/mL (Table 1). However, IFN-α production was related to neither MV-GFP resistance nor cell death in HMCLs, and MV-induced cell death was not related to apoptosis, as z-VAD-fmk did not prevent cell death (supplemental Figure 2A-B). As shown in supplemental Figure 2C, MV-GFP infection induced syncytium formation.
p53 negatively modulates CD46 expression and susceptibility to MV-GFP
To confirm the direct role of CD46, a blocking anti-CD46 mAb and CD46 silencing assays were used in several HMCLs. In both BCN and LP1, anti-CD46 mAb inhibited the percentage of GFP-positive cells and MV-induced cell death by >90% (Figure 2A). Moreover, decreasing CD46 expression using siRNA transfection inhibited GFP expression in BCN and LP1; CD46 and GFP expression was reduced by 76% ± 9% and 89% ± 4% in BCN, respectively, and by 44% ± 3% and 71% ± 9% in LP1, respectively (Figure 2B). Cell death was inhibited in both cell lines by >90%.
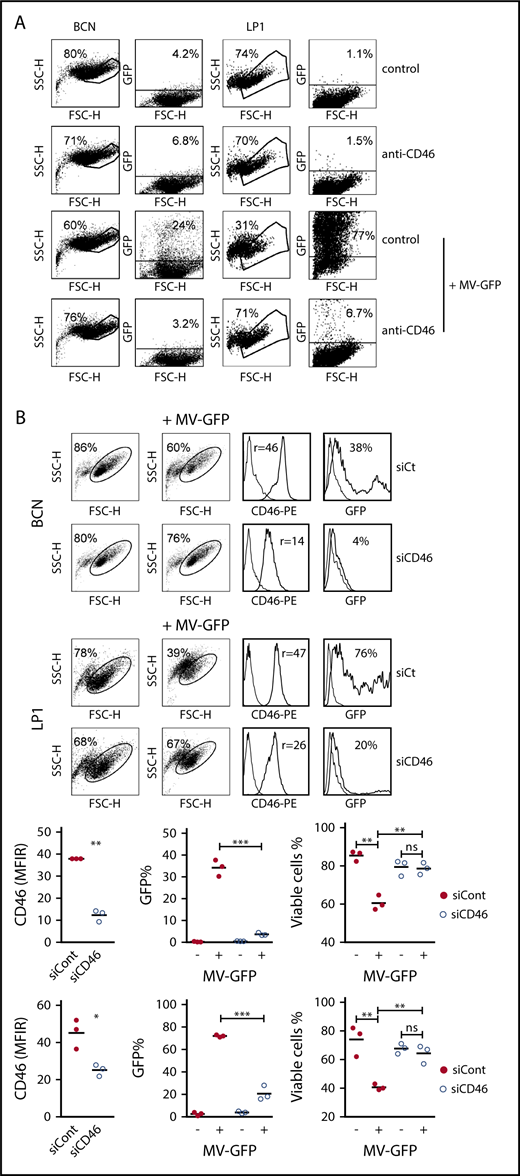
Infection and replication of MV depends on CD46 expression. (A) BCN and LP1 cells were incubated or not with a blocking anti-CD46 mAb (final concentration of 10 μg/mL) for 1 hour prior to infection with MV-GFP. Fluorescence was assessed after 3 days by flow cytometry. Cell death was assessed by the percentage of cells excluded from the living gate. (B) BCN and LP1 cells were transfected with siControl (siCont) or siCD46. On day 1, CD46 expression was assessed by flow cytometry and MV-GFP (MOI = 1) was added to the cultures (no removal of siRNAs). GFP expression was assessed 48 hours after MV-GFP addition. Viability is expressed as the percentage of cells in the living gate. The histograms represent the GFP fluorescence in the total population. One representative experiment (triplicate wells) out of 2 is shown. CD46 histograms: thin line, control staining; thick line, CD46 staining. GFP histograms: thin line, noninfected cells; thick line, MV-GFP infected cells. Statistical analyses were performed using the paired Student t test. *P < .05; **P < .01; ***P < .001. ns, not significant.
Infection and replication of MV depends on CD46 expression. (A) BCN and LP1 cells were incubated or not with a blocking anti-CD46 mAb (final concentration of 10 μg/mL) for 1 hour prior to infection with MV-GFP. Fluorescence was assessed after 3 days by flow cytometry. Cell death was assessed by the percentage of cells excluded from the living gate. (B) BCN and LP1 cells were transfected with siControl (siCont) or siCD46. On day 1, CD46 expression was assessed by flow cytometry and MV-GFP (MOI = 1) was added to the cultures (no removal of siRNAs). GFP expression was assessed 48 hours after MV-GFP addition. Viability is expressed as the percentage of cells in the living gate. The histograms represent the GFP fluorescence in the total population. One representative experiment (triplicate wells) out of 2 is shown. CD46 histograms: thin line, control staining; thick line, CD46 staining. GFP histograms: thin line, noninfected cells; thick line, MV-GFP infected cells. Statistical analyses were performed using the paired Student t test. *P < .05; **P < .01; ***P < .001. ns, not significant.
To investigate whether p53 was involved in CD46 regulation, p53 stabilization was induced using the MDM2 inhibitor nutlin3a (24 hours, 5 and 10 μM in TP53wt and TP53abn HMCLs, respectively) in 15 HMCLs, and results were illustrated in TP53wt BCN and TP53abn LP1 HMCLs. As previously described and as shown in Figure 3A and supplemental Table 2, nutlin3a induced an increase in DR5 expression in 10 TP53wt, but not 5 TP53abn, HMCLs (mean change ratio for fold changes of treated over control cells, 1.60 ± 0.27 and 1.04 ± 0.05, respectively; P < .001).30,33 Similarly, nutlin3a induced a decrease in CD46 expression in TP53wt, but not TP53abn, HMCLs, and the mean fold changes of treated over control cells were 0.55 ± 0.08 and 0.97 ± 0.03, respectively (P = .0027; Figure 3B; supplemental Table 2). Of note, the p53 dependent regulation of both DR5 and CD46 was also found in other tumor cell types (mantle cell lymphoma cell lines and HCT116; supplemental Figure 3).
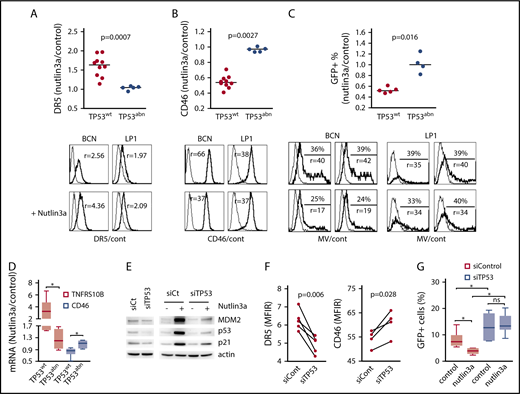
The p53 pathway modulates CD46 expression and sensitivity to MV. Cells were treated for 24 hours with 5 or 10 μM nutlin3a (in TP53wt and TP53abn cell lines, respectively). (A-B) DR5 (A) and CD46 (B) staining was performed at 24 hours in 10 TP53wt and 5 TP53abn cell lines. DR5 and CD46 expression was assessed by flow cytometry and expressed as the MFIR. Results are expressed as the fold changes of MFIR (nutlin3a-treated cells over control cells). Histograms represent the expression of DR5, CD46, and GFP after treatment with nutlin3a in the TP53wt BCN and TP53abn LP1 cell lines. Thin line, control staining; thick line, specific staining. r, MFIR. Statistical analyses were performed using the Mann-Whitney U test. (C) After 24 hours of nutlin3a treatment, cells (5 TP53wt and 4 TP53abn cell lines) were washed and incubated with MV-GFP (MOI = 1). The percentage of GFP-positive cells was assessed 2 days later, and results are expressed as the fold changes of the percentage of GFP-positive cells in nutlin3a-treated over control (cont) cells. The histograms represent the expression of GFP after treatment with nutlin3a (duplicate wells are shown) in the TP53wt BCN and TP53abn LP1 cell lines (MOI = 2 or MOI = 0.5, respectively). Thin line, GFP in noninfected cells; thick line, GFP in MV-GFP infected cells. Statistical analyses were performed using the Mann-Whitney U test. (D) CD46 and TNFRSF10B (DR5) mRNA expression in nutlin3a-treated HMCLs. Cells were treated for 24 hours with 5 or 10 μM nutlin3a (in TP53wt and TP53abn cell lines, respectively). mRNA expression was assessed using quantitative RT-PCR and results are expressed as the fold change of treated over control cells. Each point represents the mean of 2 experiments performed in triplicate wells in each cell line. Statistical analyses were performed using the Mann-Whitney U test. (E) Western blotting analysis of p53 expression in TP53-silenced BCN cells. p53 expression and p53 pathway activation were assessed with and without nutlin3a (24 hours, 5 μM). (F) TP53 silencing induced a decrease in DR5 expression and an increase in CD46 expression. BCN cells were transfected with siControl or siTP53, and expression of receptors was assessed by flow cytometry after 24 hours. Statistical analyses were performed using the paired Student t test. (G) TP53 silencing increased MV-GFP infection in TP53wt BCN cells. BCN cells were transfected with siControl or siTP53 for 2 days. For the last 24 hours, nutlin3a was added prior to washes and MV-GFP infection. GFP expression was assessed 24 hours later. The data represent 2 independent experiments. Statistical analyses were performed using the paired Wilcoxon matched-paired signed rank test. *P < .05. siCt, siControl mRNA.
The p53 pathway modulates CD46 expression and sensitivity to MV. Cells were treated for 24 hours with 5 or 10 μM nutlin3a (in TP53wt and TP53abn cell lines, respectively). (A-B) DR5 (A) and CD46 (B) staining was performed at 24 hours in 10 TP53wt and 5 TP53abn cell lines. DR5 and CD46 expression was assessed by flow cytometry and expressed as the MFIR. Results are expressed as the fold changes of MFIR (nutlin3a-treated cells over control cells). Histograms represent the expression of DR5, CD46, and GFP after treatment with nutlin3a in the TP53wt BCN and TP53abn LP1 cell lines. Thin line, control staining; thick line, specific staining. r, MFIR. Statistical analyses were performed using the Mann-Whitney U test. (C) After 24 hours of nutlin3a treatment, cells (5 TP53wt and 4 TP53abn cell lines) were washed and incubated with MV-GFP (MOI = 1). The percentage of GFP-positive cells was assessed 2 days later, and results are expressed as the fold changes of the percentage of GFP-positive cells in nutlin3a-treated over control (cont) cells. The histograms represent the expression of GFP after treatment with nutlin3a (duplicate wells are shown) in the TP53wt BCN and TP53abn LP1 cell lines (MOI = 2 or MOI = 0.5, respectively). Thin line, GFP in noninfected cells; thick line, GFP in MV-GFP infected cells. Statistical analyses were performed using the Mann-Whitney U test. (D) CD46 and TNFRSF10B (DR5) mRNA expression in nutlin3a-treated HMCLs. Cells were treated for 24 hours with 5 or 10 μM nutlin3a (in TP53wt and TP53abn cell lines, respectively). mRNA expression was assessed using quantitative RT-PCR and results are expressed as the fold change of treated over control cells. Each point represents the mean of 2 experiments performed in triplicate wells in each cell line. Statistical analyses were performed using the Mann-Whitney U test. (E) Western blotting analysis of p53 expression in TP53-silenced BCN cells. p53 expression and p53 pathway activation were assessed with and without nutlin3a (24 hours, 5 μM). (F) TP53 silencing induced a decrease in DR5 expression and an increase in CD46 expression. BCN cells were transfected with siControl or siTP53, and expression of receptors was assessed by flow cytometry after 24 hours. Statistical analyses were performed using the paired Student t test. (G) TP53 silencing increased MV-GFP infection in TP53wt BCN cells. BCN cells were transfected with siControl or siTP53 for 2 days. For the last 24 hours, nutlin3a was added prior to washes and MV-GFP infection. GFP expression was assessed 24 hours later. The data represent 2 independent experiments. Statistical analyses were performed using the paired Wilcoxon matched-paired signed rank test. *P < .05. siCt, siControl mRNA.
To assess whether the CD46 decrease in TP53wt cells was associated with a decrease in MV infection, MV-sensitive HMCLs were pretreated for 24 hours with nutlin3a (5 and 10 μM in TP53wt and TP53abn HMCLs, respectively), washed, and further incubated for 2 additional days with MV-GFP. As expected, the decrease in CD46 expression was associated with a decrease in MV-GFP replication in TP53wt, but not TP53abn, HMCLs, and the mean fold changes of treated over control cells were 0.53 ± 0.05 and 1.02 ± 0.18, respectively (P = .016, Figure 3C; supplemental Table 2). Regulation of DR5, CD46, and GFP expression was positively or negatively correlated (supplemental Figure 4). As shown in Figure 3D, the nutlin3a-induced regulation of DR5 and CD46 expression was at the mRNA level. Reciprocally, TP53 silencing was performed in the TP53wt BCN HMCL using siRNA. As shown in Figure 3E, both constitutive and nutlin3a-induced p53 expression was reduced in siTP53 cells. Expression of DR5 and CD46 was significantly decreased and increased, respectively, in siTP53 cells (fold change, 0.78 and 1.12, respectively; Figure 3F). Cells were then treated or not with nutlin3a for 24 hours before MV-GFP infection. GFP assessment was performed 24 hours after infection. TP53 silencing significantly increased MV-GFP infection (fold change, 1.82 ± 0.28) that was not prevented by nutlin3a (Figure 3G).
p53 directly and indirectly regulates CD46 expression
To decipher the molecular regulations, we assessed whether CD46 was a p53 target gene, as a binding site was found upstream to CD46 by ChIP-sequencing assays in HCT116 cells.35 p53 ChIP assays were performed in untreated and nutlin3a-treated TP53wt NCI-H929 cells. We confirmed that nutlin-3a increased the amount of p53 bound to p53-BS in TNFRSF10B.30 Similarly, we showed that nutlin3a increased the amount of p53 bound to p53-BS, and not to a control sequence nearby p53-BS, upstream of the CD46 gene (Figure 4A).
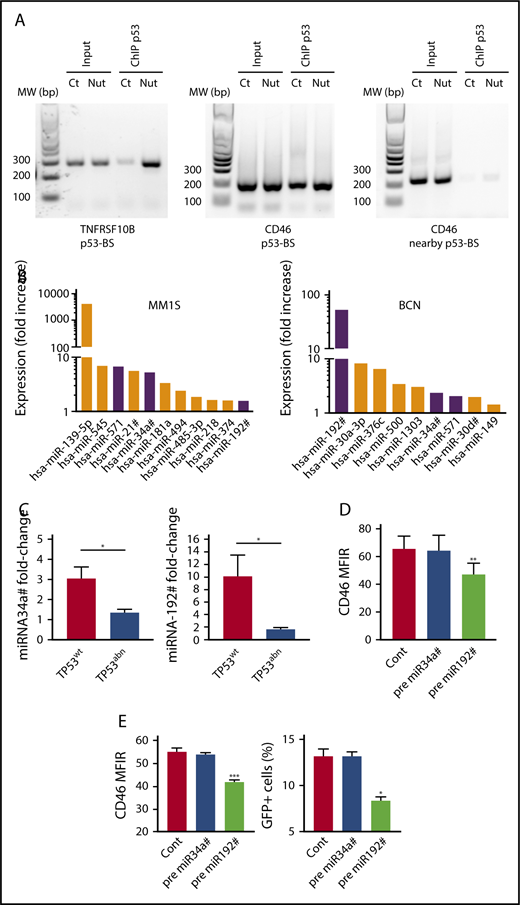
Direct and indirect regulation of CD46 by p53. (A) p53 bound to the CD46 and TNFRSF10B genes. ChIP assays were performed in TP53wt NCI-H929 HMCL treated (Nut) or not (Ct) for 5 hours with 10 μM nutlin3a, as described in Materials and methods. (B) p53 upregulated miRNAs predicted to target CD46. MM1S and BCN were treated with nutlin3a overnight, and miRNA expression was assessed by RT-PCR. Shared miRNAs are indicated by purple color. (C) Nutlin3a-induced miRNA upregulation was restricted to TP53wt HMCLs. TP53wt (BCN, XG6, and NCI-H929) and TP53abn (KMS12PE, NAN8, OPM2, and LP1) HMCLs were treated 24 hours with nutlin3a, and miRNA expression was assessed by RT-QPCR. *P = .05. (D) miRNA192# regulated CD46 expression in TP53wt and TP53abn HMCLs. TP53wt (BCN, MM1S, and XG6) and TP53abn (LP1, OMP2, KMM1, and U266) HMCLs were transfected or not (Cont) with miRNA precursors, and CD46 expression was assessed using flow cytometry 24 hours after transfection. Statistical analyses were performed using paired Student t tests. (E) Transfection of miRNA192# precursor decreased MV infection. BCN cells were transfected or not (Cont) with miRNAs precursors and exposed to MV-GFP 24 hours after transfection. CD46 expression was assessed 24 hours after transfection, and GFP expression was assessed 2 days later. Statistical analyses were performed using paired Student t tests. *P < .05; **P < .01; ***P < .001.
Direct and indirect regulation of CD46 by p53. (A) p53 bound to the CD46 and TNFRSF10B genes. ChIP assays were performed in TP53wt NCI-H929 HMCL treated (Nut) or not (Ct) for 5 hours with 10 μM nutlin3a, as described in Materials and methods. (B) p53 upregulated miRNAs predicted to target CD46. MM1S and BCN were treated with nutlin3a overnight, and miRNA expression was assessed by RT-PCR. Shared miRNAs are indicated by purple color. (C) Nutlin3a-induced miRNA upregulation was restricted to TP53wt HMCLs. TP53wt (BCN, XG6, and NCI-H929) and TP53abn (KMS12PE, NAN8, OPM2, and LP1) HMCLs were treated 24 hours with nutlin3a, and miRNA expression was assessed by RT-QPCR. *P = .05. (D) miRNA192# regulated CD46 expression in TP53wt and TP53abn HMCLs. TP53wt (BCN, MM1S, and XG6) and TP53abn (LP1, OMP2, KMM1, and U266) HMCLs were transfected or not (Cont) with miRNA precursors, and CD46 expression was assessed using flow cytometry 24 hours after transfection. Statistical analyses were performed using paired Student t tests. (E) Transfection of miRNA192# precursor decreased MV infection. BCN cells were transfected or not (Cont) with miRNAs precursors and exposed to MV-GFP 24 hours after transfection. CD46 expression was assessed 24 hours after transfection, and GFP expression was assessed 2 days later. Statistical analyses were performed using paired Student t tests. *P < .05; **P < .01; ***P < .001.
Because p53 is known to increase transcription of many microRNAs (miRNAs), we wondered whether some miRNAs could be involved in CD46 decrease, as miR31 and miR128 were shown to regulate PVRL4 expression and MV infection in nohematopoietic cells.37-39 We treated 2 TP53wt HMCLs with nutlin3a for 15 hours and analyzed miRNA expression using an miRNA PCR array (supplemental Table 3). Expression of 11 and 9 miRNAs with a significant score against CD46 was increased more than 1.4-fold in MM1S and BCN, respectively, and 3 were shared between the 2 HMCLs (miR34a#, miR192#, and miR571) (Figure 4B). We confirmed that expression of miR34a# and miR192# was significantly induced by nutlin3a in TP53wt, but not TP53abn, HMCLs (Figure 4C). By contrast, we could not detect constitutive miR571 expression or significant induction in the presence of nutlin3a (data not shown). To determine whether these miRNAs efficiently targeted CD46, premature miRNAs were transfected in 7 HMCLs (3 TP53wt and 4 TP53abn), and CD46 expression was followed using flow cytometry. Transfection with miR192# precursor, but not miR34A# precursor, significantly decreased CD46 expression in all HMCLs (Figure 4D) and decreased MV infection (Figure 4E). These results showed that p53 indirectly regulates CD46 expression through miR192# expression.
Primary myeloma cells are highly sensitive to MV
Monoclonal gammopathy of undetermined significance and myeloma cells overexpressed CD46 as compared with normal plasma cells (supplemental Figure 5A).20,25 MM cells also expressed SLAMF1 (CD150) (albeit weakly), but not PVRL4 (Nectin4). To assess MV efficacy in primary myeloma cells, bone marrow, peripheral blood, or pleural effusion mononuclear cells from patients with MM, plasma cell leukemia (PCL), or pleural effusion were incubated for 4 days with MV-GFP (MOI=1). GFP fluorescence was assessed in myeloma cells (CD138++) and nonmyeloma cells (CD138−), and myeloma cell death was calculated by the decrease in the CD138++ population (Figure 5A-B).30,31 In all the samples, the proportion of CD138++ was decreased (median death, 58%), and the remaining CD138++ population was GFP+ (median, 60%), as summarized in Table 2 and illustrated in supplemental Figure 5B. When compared with nonmyeloma cells (FSClow, SSClow, CD138−), CD138++ cells overexpressed CD46 (median, 124 vs 44) and were preferentially infected by MV-GFP in terms of both the proportion of cells and the GFP level (median, 68% vs 26% and 17 vs 7.4, respectively) (Figure 5A-B; supplemental Figure 5B). As observed in HMCLs, a blocking anti-CD46 mAb inhibited infection and cell death in myeloma cells and infection in nonmyeloma cells (Figure 5B). Although both CD46 and GFP expression was high in the 4 samples harboring del(17p) when compared with the 10 samples without del(17p), the differences were not statistically significant (Table 2; Figure 5C).
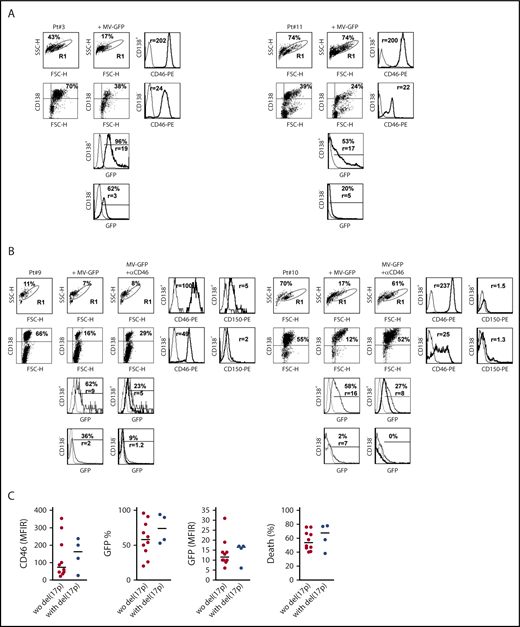
MV induces massive cell death in primary myeloma cells. Mononuclear cells from bone marrow, pleural effusion, or peripheral blood from patients with MM were stained with APC-CD138 and PE-control or PE-CD46 or PE-CD150 mAbs, and fluorescence was analyzed by flow cytometry. (A) Cells were incubated for 4 days with MV-GFP (MOI = 1). Cells were washed and stained with APC-CD138 mAb prior to flow cytometry analysis. GFP expression was assessed in CD138+ myeloma cells and CD138− cells (FSClow SSClow CD138−). Myeloma cell death was assessed at day 4 by the loss of CD138 staining, as previously described.30,31 (B) Anti-CD46 mAb prevented MV-GFP infection in primary cells. Prior to MV-GFP infection (performed as described in panel A), mononuclear cells were incubated for 2 hours with the blocking anti-CD46 mAb (final concentration, 10 μg/mL). GFP histograms represent GFP expression in noninfected cells (dashed line), in MV-GFP–infected cells (thin line), and in MV-GFP–infected cells in the presence of anti-CD46 mAb (thick line). (C) Myeloma cells with or without del(17p) were similarly sensitive to MV-GFP. The graphs represent the expression of CD46 and GFP. CD46 staining was assessed in double staining with anti-CD138 mAb before incubation with MV-GFP (MFIR, which was calculated by dividing the mean fluoresence intensity of specific staining over that of control staining). GFP expression was reported as the percentage of positive cells and the expression level (MFIR), which was the FL1 expression level in infected GFP-positive CD138+ cells over paired control samples. The statistical analyses were performed using the Mann-Whitney U test.
MV induces massive cell death in primary myeloma cells. Mononuclear cells from bone marrow, pleural effusion, or peripheral blood from patients with MM were stained with APC-CD138 and PE-control or PE-CD46 or PE-CD150 mAbs, and fluorescence was analyzed by flow cytometry. (A) Cells were incubated for 4 days with MV-GFP (MOI = 1). Cells were washed and stained with APC-CD138 mAb prior to flow cytometry analysis. GFP expression was assessed in CD138+ myeloma cells and CD138− cells (FSClow SSClow CD138−). Myeloma cell death was assessed at day 4 by the loss of CD138 staining, as previously described.30,31 (B) Anti-CD46 mAb prevented MV-GFP infection in primary cells. Prior to MV-GFP infection (performed as described in panel A), mononuclear cells were incubated for 2 hours with the blocking anti-CD46 mAb (final concentration, 10 μg/mL). GFP histograms represent GFP expression in noninfected cells (dashed line), in MV-GFP–infected cells (thin line), and in MV-GFP–infected cells in the presence of anti-CD46 mAb (thick line). (C) Myeloma cells with or without del(17p) were similarly sensitive to MV-GFP. The graphs represent the expression of CD46 and GFP. CD46 staining was assessed in double staining with anti-CD138 mAb before incubation with MV-GFP (MFIR, which was calculated by dividing the mean fluoresence intensity of specific staining over that of control staining). GFP expression was reported as the percentage of positive cells and the expression level (MFIR), which was the FL1 expression level in infected GFP-positive CD138+ cells over paired control samples. The statistical analyses were performed using the Mann-Whitney U test.
Sensitivity of primary myeloma cells to MV-GFP
| Sample | Status | del(17p), % | CD138+, % | CD46 MFIR | Death, % | GFP, % | GFP MFIR |
|---|---|---|---|---|---|---|---|
| 1 | MM | 0 | 13 | 46 | 58 | 54 | 10 |
| 2 | PCL | 0 | 30 | 47 | 65 | 68 | 10 |
| 3 | PCL | 0 | 34 | 202 | 46 | 96 | 19 |
| 4 | PCL | 0 | 7 | 36 | 47 | 42 | 6 |
| 5 | PCL | 0 | 16 | 60 | 76 | 50 | 14 |
| 6 | MM | 0 | 19 | 300 | 49 | 20 | 10 |
| 7 | MM | 0 | 60 | 353 | 40 | 80 | 14 |
| 8 | PCL | 0 | 63 | 87 | 67 | 91 | 31 |
| 9 | PE | 0 | 73 | 22 | 41 | 26 | 13 |
| 10 | MM | 11 | 7 | 100 | 76 | 62 | 9 |
| 11 | PCL | 88 | 40 | 237 | 78 | 58 | 16 |
| 12 | PCL | 89 | 29 | 200 | 38 | 53 | 17 |
| 13 | PCL | 94 | 41 | 26 | 58 | 90 | 6 |
| 14 | PCL | 100 | 21 | 124 | 77 | 94 | 17 |
CD46 expression was assessed in double staining with anti-CD138 mAb after isolation of mononuclear cells. Total mononuclear cells were incubated for 4 days with MV-GFP (MOI = 1). GFP expression in CD138+ cells represents the percentage of positive cells and the fluorescence intensity of the positive population. Cell death was determined by the percentage of loss of CD138+ cells. MFIR, CD46, and control mean fluorescence intensity values are provided in supplemental Table 1B.
PE, pleural effusion.
Nutlin3a decreases CD46 expression and MV infection in primary myeloma cells with functional p53 pathway
To assess whether nutlin3a modulated CD46 expression in primary cells and MV-GFP infection, total mononuclear cells were treated for 24 hours with 10μM nutlin3a, washed, and further infected with MV-GFP (MOI = 1) for 2 additional days (supplemental Table 4). Activation of the p53 pathway was attested by the increase in DR5 expression in myeloma and nonmyeloma cells.30,31,33 In nonmyeloma cells, nutlin3a significantly induced an increase in DR5 expression (median fold change, 1.72; n = 10) and a decrease in both CD46 expression (median fold change, 0.59; n = 10) and GFP expression (median fold change, 0.77; n = 7) (supplemental Figure 5C). In myeloma cells from 8 samples without del(17p), nutlin3a significantly increased DR5 expression and decreased both CD46 expression and MV-GFP infection (percentage of positive cells and intensity [MFIR]); the respective median fold changes were 2.03, 0.61, 0.725, and 0.765 (P = .0078, P = .0078, P = .0078, and P = .0078, respectively; n = 8) (Figure 6A; supplemental Figure 6; supplemental Table 4). By contrast, in myeloma cells from 5 samples with del(17p), nutlin3a did not significantly modulate expression of DR5, CD46, and GFP (median fold change, 1, 0.85, 1.01, and 1, respectively). The regulations were significantly different between samples with and without del(17p) (Figure 6B). Taking all samples together, CD46, DR5, and GFP expression was positively or negatively correlated (Figure 6C). These data showed that transient p53 activation in myeloma cells harboring a competent p53 pathway decreased MV infection.
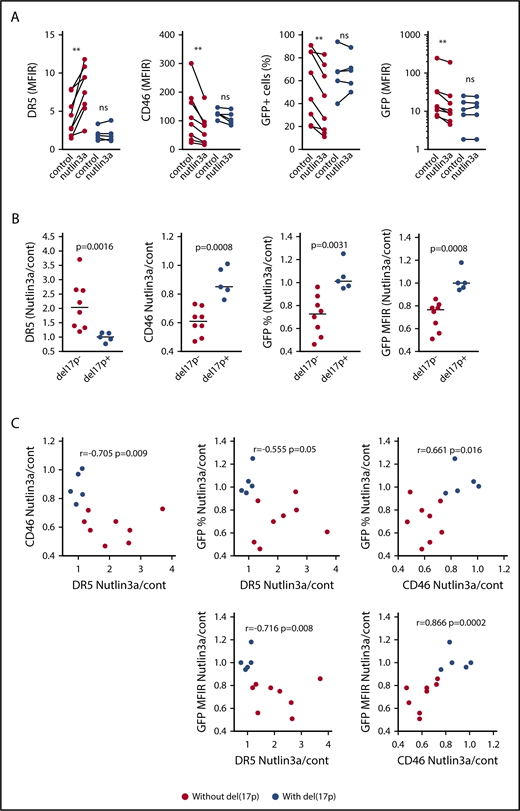
Activation of the p53 pathway in myeloma cells without del(17p) represses CD46 expression and MV-GFP infection. (A) Total mononuclear cells from 13 patients with or without del(17)p were incubated for 24 hours with or without nutlin3a (10 μM) prior to DR5 and CD46 staining. After washing to remove nutlin3a, cells were subjected to infection as described in the Figure 5A legend. GFP expression was assessed 2 days later. Expression of DR5 or CD46 (MFIR) in CD138+ cells was assessed in double staining with anti-CD138 mAb before incubation with MV-GFP. GFP expression in CD138+ cells is reported as the percentage of positive cells and the MFIR, which was the FL1 expression level in infected GFP-positive CD138+ cells over paired control samples (without and with nutlin3a). Statistical analyses were performed using the Wilcoxon matched-paired sign rank test. (B) Nutlin3a-induced regulation of DR5, CD46, and GFP expression occurred in samples without del(17)p. The DR5, CD46, and GFP fold-changes (nutlin3a/cont) represent the MFIR ratio in nutlin3a-treated over control paired samples (see supplemental Table 4). Statistical analyses were performed using the Mann-Whitney U test. (C) Nutlin3a induced a correlated regulation of DR5, CD46, and GFP. Fold changes of DR5, CD46, and GFP expression were plotted against each other, and correlations were calculated using the Spearman test. **P < .01.
Activation of the p53 pathway in myeloma cells without del(17p) represses CD46 expression and MV-GFP infection. (A) Total mononuclear cells from 13 patients with or without del(17)p were incubated for 24 hours with or without nutlin3a (10 μM) prior to DR5 and CD46 staining. After washing to remove nutlin3a, cells were subjected to infection as described in the Figure 5A legend. GFP expression was assessed 2 days later. Expression of DR5 or CD46 (MFIR) in CD138+ cells was assessed in double staining with anti-CD138 mAb before incubation with MV-GFP. GFP expression in CD138+ cells is reported as the percentage of positive cells and the MFIR, which was the FL1 expression level in infected GFP-positive CD138+ cells over paired control samples (without and with nutlin3a). Statistical analyses were performed using the Wilcoxon matched-paired sign rank test. (B) Nutlin3a-induced regulation of DR5, CD46, and GFP expression occurred in samples without del(17)p. The DR5, CD46, and GFP fold-changes (nutlin3a/cont) represent the MFIR ratio in nutlin3a-treated over control paired samples (see supplemental Table 4). Statistical analyses were performed using the Mann-Whitney U test. (C) Nutlin3a induced a correlated regulation of DR5, CD46, and GFP. Fold changes of DR5, CD46, and GFP expression were plotted against each other, and correlations were calculated using the Spearman test. **P < .01.
Discussion
In this paper, we assessed the viral permissiveness of myeloma cells to the oncolytic MV in relation to TP53 status. We showed that the p53 pathway regulated CD46 expression and viral infection in both HMCLs and primary myeloma cells, highlighting an increased sensitivity in p53-deficient cells. However, the correlation was not strict, suggesting that additional regulations are involved in viral sensitivity. We showed that in HMCLs, production of IFN-α was not related to resistance to infection but was associated with significant infection. These results suggest that the IFN pathway was altered despite IFN production, as recently reported in mesothelioma cells.40 Whole-exon sequencing of HMCLs showed numerous mutations in the IFN pathway across an HMCL collection targeting more than 15 genes involved in IFN binding (eg, IFNAR1/2), ISG (eg, DDX58 and DDX60), or nucleoporins (eg, NUP153 and NUP21032 ). In primary cells, high production of IFN-α was found in all samples assessed (n = 5; data not shown), because infection was performed in total mononuclear cells. In contrast to HMCLs, we did not find samples resistant to infection although the level of infection was variable.
To activate p53 pathway, we chose to use nutlin3a, which is highly specific for MDM2, instead of DNA damaging drugs that induce the activation of multiple pathways. We also excluded other p53 reactivating drugs, such as RITA and PRIMA-1Met, as we previously demonstrated their lack of specificity toward p53,31,33 which has been confirmed recently.41,42 Our results in both cell lines and primary samples clearly indicate that nutlin3a-induced p53 activation decreased the sensitivity of myeloma cells to MV infection. Reciprocally, TP53 silencing in HMCLs increased MV infection.
The vaccine MV strain, which is an attenuated strain obtained after the passaging of the Edmonston B strain in monkey kidney Vero cells or human HeLa cells in vitro,21 preferentially binds CD46, in contrast to the wild-type strain, which preferentially binds to CD150.43 Normal and malignant cells of B-cell origin do not express Nectin4, moderately express CD150, and express CD46. When compared with normal plasma cells, MM cells overexpressed CD46 and rather underexpressed CD150.20 Using blocking mAb and gene silencing, we confirmed that MV infection in MM was essentially related to CD46 expression. We demonstrated that p53 negatively regulates CD46 expression in myeloma cells as well as in TP53wt mantle cell lymphoma or colon carcinoma cell lines.
CD46 overexpression in myeloma cells appears to rely on different deregulations. CD46 is located on 1q32.2, and the CD46 locus appears to be involved in chromosome 1q21 amplification, which is frequent in myeloma cells.25,44 CD46 expression has also been reported to be regulated by the MAPK pathway, and p53 has been reported to decrease RAS expression and subsequent MAPK activation.45 However, we did not find any CD46 regulation in the presence of U0126, and nutlin3a did not inhibit ERK1/2 phosphorylation in TP53wt HMCLs, arguing against involvement of the RAS pathway in p53-induced CD46 regulation (data not shown).
Using ChIP assays, we showed that p53 bound near the TNFRSF10B and CD46 genes, as previously shown, and that nutlin3a increased its binding.30,35 By contrast to TNFRSF10B, CDKN1A, or MDM2, CD46 expression was decreased (not increased) by p53. A decrease in CD46 expression, although not complete, might be sufficient to prevent replication, because CD46 expression is involved in intercellular fusion, which is important for virus dissemination.46 We showed that CD46 was also regulated by miR192#, but not by miR34a#, which were both induced by nutlin3a.
MV infection and cell death were correlated across the HMCL collection. The mechanism of MV-induced cell death is not fully elucidated, and our results showed that z-VAD-fmk did not inhibit cell death. This apparent lack of apoptosis was further confirmed in a subclone of the XG5 cell line resistant to ABT199 displaying a BAX mutation and Bak silencing47 ; these cells deficient for apoptosis execution remained killed by MV (data not shown). As type I IFNs are well known to induce apoptosis, the lack of apoptosis despite IFN-α production further suggests that both IFN-α and apoptosis were not the main cell death mechanism.
In contrast to cell lines, no primary cells appeared resistant to the infection, regardless of their del(17p) status. CD46 expression level (assessed by flow cytometry using MFIR and not by mRNA expression) in primary cells was high in myeloma cells but not significantly different between samples with or without del(17p). CD46 expression might also be increased independently of p53 because of chromosome 1q amplification. Whatever the constitutive expression level, we showed that nutlin3a induced the decrease in both CD46 expression and MV infection in correlation with the increase in DR5 expression. Association of TP53 deletion with mutation is frequent in high-risk MM (especially in extramedullary disease) and is well known to be associated with a low response rate to therapies.2,3 Thus, MV is an attractive tool to target p53-deficient myeloma cells, for which no efficient therapies are available yet. The major concern is preexisting immunity and/or the impossibility of repeating viral injections in MV-naive patients. Although the vaccine MV strain has proven its safety in billions of people for more than 30 years, the virus load for cancer treatment is up to 106 higher than for vaccination.13 When inoculated with billions of viral particles, patients became febrile, hypotensive, and tachycardic, with severe nausea and vomiting. This pilot assay nevertheless demonstrated its feasibility in MV infection–naive patients, and the same Mayo Clinic team recently showed that MV efficiently replicated within myeloma cells in vivo.26 In good agreement with this in vivo observation, only MM cells were GFP positive in whole-patient samples in vitro, and GFP expression in HMCLs was not decreased upon coculture with HS5 stromal cells (supplemental Figure 7).
Several other oncolytic viruses, some of which also enter cells through CD46 (eg, herpesvirus 6), are under study for cancer therapy.48 Numerous trials assessing the safety and efficacy of oncolytic viruses (in combination or not with checkpoint inhibitors) for cancer therapy in solid and hematological cancers are ongoing (www.clinicaltrials.gov).
In summary, myeloma cells were highly sensitive to MV and infection inhibition by the p53 pathway was abrogated in p53-deficient myeloma cells. These results argue for an MV-based clinical trial for patients with p53 deficiency.
The full-text version of this article contains a data supplement.
Acknowledgments
The authors thank Berthe-Marie Imbert for helpful discussions and advice.
This work was supported by grants from the Ligue Régionale Contre le Cancer, DHU Oncogreffe, Actions Cancer 44, L'Héma-NexT (i-site NexT), and SIRIC ILIAD (INCa-DGOS-Inserm_12558).
Authorship
Contribution: G.D. and A.L. designed the study, performed experiments, and wrote the article; B.T. performed bioinformatics analyses and analyzed the mutation profile in HMCLs; D.C. performed experiments and designed the study; C.B. performed experiments; M.E., C.G., and Y.L.B. supervised hematological diagnosis, selected patients’ samples, and supervised the del(17p) assays; L.M. and S.B.-N. provided HCT116 TP53KO cells; M.G. and J.-F.F. provided help with the design of the MV experiments; A.V. supervised MV quantification; S.L.G. and P.M. participated in the study design; M.A. participated in the study design and reviewed the manuscript; F.T. provided the MV and MV-GFP and participated in the study design; A.M.-A. supervised ChIP assays, participated in the study design, and reviewed the manuscript; C.P.-D. designed the study and wrote the article; and all authors approved the manuscript.
Conflict-of-interest disclosure: F.T. and M.G. are founders and shareholders of Oncovita. The remaining authors declare no competing financial interests.
Correspondence: Catherine Pellat-Deceunynck, Equipe 10, Centre de Recherches en Cancérologie et Immunologie Nantes Angers, INSERM, CNRS, IRS-UN, 8, quai Moncousu, Nantes BP70721 44007, France; e-mail: catherine.pellat-deceunynck@univ-nantes.fr; and Anne Lok, Service d'Hématologie, CHU de Nantes, 1 Place Alexis Ricordeau, 44093 Nantes cedex 01, France; e-mail: anne.lok@chu-nantes.fr.

