

Key Points
Predictability of the IPSSWM decreases over the disease course after first treatment.
Onset of progression and initiation of second-line treatment, but not response, determine survival after first treatment in WM patients.

Abstract
Few reports assess prognosis during follow-up of patients with symptomatic Waldenström macroglobulinemia (WM). In 121 WM patients treated between 1993 and 2016, we analyzed the prognostic role during the clinical course of the initial International Prognostic Scoring System for WM (IPSSWM). Then, we assessed onset of response, progression, and second treatment initiation coded as time-dependent covariates. High-risk IPSSWM was an adverse prognostic factor for survival after first treatment initiation (SAFTI). Nevertheless, the corresponding Dxy concordance index obtained in multiple landmark analyses decreased from 0.24 to 0.08 during the first 6 years, in accordance with a departure from the proportional hazard assumption. By contrast with onset of response (whatever its level), onset of progression and initiation of second-line treatment retained prognostic value for SAFTI (P = .02 and P = .006, respectively). These findings were confirmed in cause-specific Cox models for deaths related to WM, but not for unrelated deaths. Time to progression after first-line treatment and time to initiation of second-line treatment had no prognostic value for survival after these 2 events. These results were confirmed in an independent series of 119 patients homogeneously treated with chemoimmunotherapy. Finally, after second-line and third-line treatment, onset of progression had significant prognostic value for subsequent risk of related death only. Thus, taking initial IPSSWM and delayed response to treatment into account, only onset of progression and second treatment initiation provided additional prognostic information for SAFTI. Therefore, progression-free survival or time to next treatment may be satisfactory surrogate end points of SAFTI in WM.
Introduction
Waldenström macroglobulinemia (WM) is a rare chronic lymphoproliferative disorder characterized by the production of serum monoclonal immunoglobulin M (mIgM) and lymphoplasmacytic bone marrow infiltration.1 Initiating treatment according to Athens criteria2 defines another stage of the disease associated with an adverse prognostic value.3 Prognostic assessment at the time of first-line treatment mainly rests on the International Prognostic Scoring System for WM (IPSSWM).4 This system has been validated in patients treated with rituximab5 and in the Greek data set used to design the revised IPSSWM.6 Later during the evolution, high-risk IPSSWM before salvage treatment has also been associated with an adverse prognostic value for subsequent survival.7 Several authors emphasized the prognostic role of the quality of response achieved after treatment during the evolution of WM.8-10 Besides complete resolution or reduction of extramedullary disease (if present at baseline), standardized international response category and progression criteria are mainly defined by confirmed change in serum mIgM concentration (SMIC) with the recommendation to take into account the optimal response observed, which is sometimes many months after treatment completion. Minor response (MR), partial response (PR), and very good partial response (VGPR) require 25% to 50%, 50% to 90%, and >90% reduction in SMIC, respectively, and complete remission (CR) is rarely reported. Progression is defined by a confirmed observation of a >25% increase in SMIC from the lowest attained SMIC (with an increase of ≥5 g/L) or the initiation of new treatment (Figure 1).11
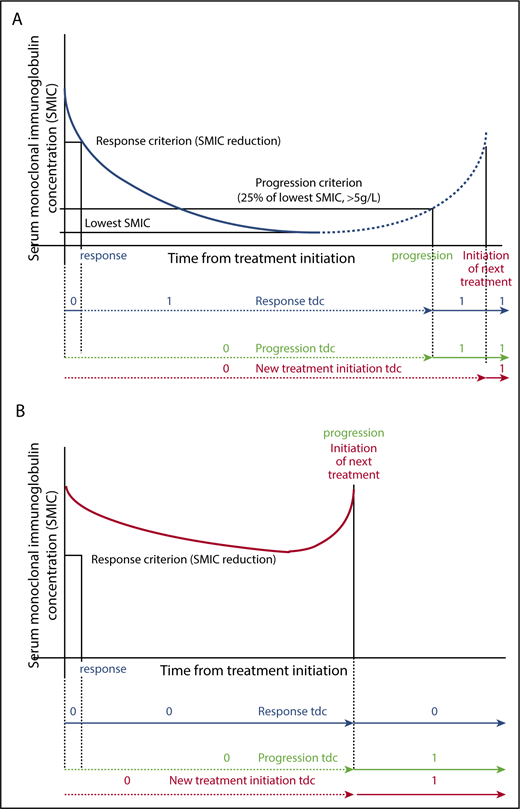
Definition of response, progression, and next treatment initiation coded as time-dependent covariates. Any time-dependent covariate is coded 0 until the occurrence of the event and 1 after, as shown in the figures. (A) Blue curves depict the evolution of SMIC in case of response (solid line) or in case of response followed by progression (solid line followed by dashed line). Time of onset of response, time of onset of failure (or progression), and time of next treatment initiation are available for computation as a time dependent covariate coded 0 or 1 as shown in the figure (respectively blue, green, and red lines). (B) Red curves depict the evolution of SMIC in a patient who failed to respond. In this case, the time of next treatment initiation for any criteria is similar to the time of progression (red and green lines). tdc, time-dependent covariate.
Definition of response, progression, and next treatment initiation coded as time-dependent covariates. Any time-dependent covariate is coded 0 until the occurrence of the event and 1 after, as shown in the figures. (A) Blue curves depict the evolution of SMIC in case of response (solid line) or in case of response followed by progression (solid line followed by dashed line). Time of onset of response, time of onset of failure (or progression), and time of next treatment initiation are available for computation as a time dependent covariate coded 0 or 1 as shown in the figure (respectively blue, green, and red lines). (B) Red curves depict the evolution of SMIC in a patient who failed to respond. In this case, the time of next treatment initiation for any criteria is similar to the time of progression (red and green lines). tdc, time-dependent covariate.
Molecular events likely drive the clinical behavior of the disease. Genome sequencing has identified highly prevalent somatic mutations involving MYD88 and CXCR4 genes, among others,1,12 with associated differences in transcription profiles13 and clinical characteristics.14 In addition, clonal evolution may occur during the course of the disease.15,16 By contrast, few reports described changes in clinical presentation during the evolution of WM,17 whereas specific statistical tools have already been used to decipher the clinical evolution of several chronic hematological malignancies.18-21 In the present study, we performed similar statistical analyses for identifying characteristics potentially useful for assessing mortality during the follow-up of patients with symptomatic WM. We supplemented with competing risk analyses because of the high frequency of deaths unrelated to WM. Besides risk factors at first-line treatment initiation, summed up using the IPSSWM, we more specifically focused on information cached during the evolution of WM, especially response to treatment and progression followed in most cases by the initiation of treatment.
Patients and methods
Inclusion criteria and data assessment in the derivation series
This study was conducted on a derivation series of 121 WM patients consecutively treated at the Service d’Hematologie Clinique of the Centre Hospitalier de Lens or the Centre Hospitalier Universitaire d’Amiens between 1993 and 2016. Inclusion criteria were (1) proven WM according to international workshop recommendations22 ; (2) symptomatic WM requiring the initiation of at least first-line treatment according to the criteria of the second international workshop2 (namely, in case of constitutional symptoms, cytopenia, symptomatic hepatomegaly, symptomatic splenomegaly, bulky and/or symptomatic lymphadenopathy, mIgM-related symptoms, or hyperviscosity syndrome); and (3) informed consent obtained according to the recommendations of the protocol approved by the institutional review board.
These symptomatic patients received one to 6 lines of treatment, but we focused on the first 3 lines of treatment, because only 19 patients received ≥4 lines of treatment. The same treatment initiation criteria were used during follow-up, before each line of treatment.
Optimal response category and progression were recorded during follow-up according to the sixth international workshop criteria mentioned above. Both had to be confirmed.11 Given the well-known delayed mIgM responses observed in some patients, categorical response could not be defined in 2 patients after first-line treatment, in 5 patients after second-line treatment, and in 7 patients after third-line treatment, because treatment had lasted for <6 months without change in SMIC at the time of analysis. The distribution of optimal response categories is shown in Table 1.
Characteristics of patients of the derivation series at the initiation of the first 3 lines of treatment
| Characteristic | First (n = 121) | Second (n = 66) | Third (n = 39) |
|---|---|---|---|
| Age, median (IQR), y | 70 (61-80) | 70.8 (63.4-78.4) | 69.6 (61.9-76.0) |
| ≤65 | 46 (38) | 19 (32) | 12 (31) |
| >65 | 75 (62) | 47 (68) | 27 (69) |
| Hemoglobin, median (IQR), g/dL | 9.4 (8.5-11.0) | 9.5 (8.4-11.2) | 9.8 (8.4-11.0) |
| <10 | 72 (64) | 37 (61) | 16 (52) |
| 10-11.5 | 17 (15) | 9 (15) | 10 (32) |
| >11.5 | 24 (21) | 15 (24) | 5 (16) |
| Missing | 8 | 5 | 8 |
| Platelet count, median (IQR), ×109/L | 230 (159-324) | 200 (125-287) | 176 (106-300) |
| ≤100 | 19 (17) | 13 (22) | 7 (23) |
| >100 | 94 (83) | 46 (78) | 24 (77) |
| Missing | 8 | 7 | 8 |
| Serum β2-microglobulin, median (IQR), mg/L | 3.2 (2.4-4.8) | 2.9 (2.3-5.5) | 3.18 (2.23-6.6) |
| ≤3 | 45 (43) | 21 (52.5) | 8 (42) |
| >3 | 59 (57) | 19 (47.5) | 11 (58) |
| Missing | 17 | 26 | 20 |
| Serum mIgM, median (IQR), g/L | 23 (14-35.7) | 24 (12.7-38.6) | 23.4 (12.3-34) |
| Missing | 6 | 2 | 2 |
| IPSSWM | |||
| Low or intermediate | 62 (60) | 32 (63) | 16 (59) |
| High | 42 (40) | 19 (37) | 11 (41) |
| Missing | 17 | 15 | 12 |
| Response* | |||
| CR, VGPR, and PR | 47† (41) | 25 (41) | 15 (47) |
| MR | 33 (30) | 12 (20) | 4 (13) |
| Stable | 23 (20) | 18 (29) | 9 (28) |
| Progression | 2 (2) | 3 (5) | 1 (3) |
| Death | 8 (7) | 3 (5) | 3 (9) |
| NA | 8 | 5 | 7 |
Values are number (percentage) of patients unless otherwise indicated.
IQR, interquartile range; NA, not available.
As reported by physician, according to international recommendations. Please note that categorical response could not be defined as stable before the first 6 months of treatment.
Including 2 CR and 9 VGPR.
In addition, clinical evaluation with SMIC assessment at the end of treatment and then at least every year or at any significant change was available from first-line treatment in 115 patients (complete monitoring subgroup). In the 6 remaining patients, this information was missing after first-line treatment, because it was not systematically retained in the medical records for earlier patients.
Inclusion criteria and data assessment in the independent validation series
An independent series of 119 consecutive patients treated in the Hematology Unit of the University Hospital of Toulouse and in the hospitals of the region Midi Pyrenee, France, from 2005 to 2015 with a rituximab-fludarabine combination23 or a cyclophosphamide, dexamethasone, and rituximab regimen24 was used for the validation of main results. Inclusion criteria were similar. The date, the depth of optimal response and the date of progression were recorded, but systematic SMIC monitoring was not available. Informed consent was also obtained from all patients.
Statistical analyses
Quantitative variables were expressed as median (interquartile range) and categorical variables as number (percentages). Overall survival curves from the date of initiation of the first 3 lines treatment were estimated using the Kaplan-Meier method. Related and unrelated death were 2 competing risks, and their cumulative incidence was estimated according to Prentice and Kalbfleisch.25
The prognostic value of the simplified IPSSWM (sIPSSWM; which combined low and intermediate risk categories7,26 ) on survival after first treatment initiation (SAFTI) was assessed using a Cox proportional hazard model. The proportional hazards assumption was assessed by plotting the Schoenfeld residuals and using the test proposed by Grambsch and Therneau.27 Since the proportional hazards assumption was violated, we determined the discrimination value of the sIPSSWM at yearly landmark time points by calculating the Harrell C index as well as Somers Dxy value.28
Cumulative incidences of response levels, progression, and second treatment initiation from the time of first-line treatment were estimated by treating death before these events as a competing risk using the Prentice and Kalbfleisch approach25 in the 115 patients of the complete monitoring subgroup.
Then, we assessed the prognostic values of onset of response, progression, and second treatment initiation on SAFTI using the Cox proportional hazard model and treating these variables as time-dependent covariates (see Figure 1 for a definition of time-dependent covariates) before and after adjustment for the sIPSSWM. To take into account the violation of proportional hazards assumption for the sIPSSWM, a time by sIPSSWM covariate was introduced in multivariable Cox regression models. The Harrell C index associated with the latter models was calculated as previously reported.28 We also assessed the prognostic values of these variables after second- and third-line treatment using the same approach.
In order to take into account the influence of death unrelated to WM, we introduced the onset of response, progression, and second treatment initiation, each coded as a time-dependent covariate, in cause-specific proportional hazards regression models27 with 2 competing events (death from WM [related] or an unrelated cause) as previously reported.19 In cases without a definitive conclusion regarding the relationship between cause of death and WM, survival data were censored at the time of last follow-up.
Furthermore, we also evaluated the prognostic value of time from first-line treatment initiation to progression occurrence by using this continuous covariate in a Cox proportional hazard model of subsequent survival using the date of progression as the starting date. The log-linearity assumption was assessed using a Martingale residual plot and tested using the restricted cubic spline functions (a likelihood ratio tested comparing the model including a linear term only to the model including linear and spline terms29 ). A similar approach was performed to assess the prognostic value of time from first-line to second-line treatment initiations in a Cox model of subsequent survival with the date of second-line treatment as the starting date.
Finally, we used the independent validation series to replicate the prognostic assessment of onset and time to first progression and second treatment initiation on survival and the cumulative incidence of related death after first-line treatment. Because of the limited number of deaths18 in the 95 patients in the validation series with available information, we could not validate the time-dependent Cox proportional hazard model adjusted for sIPSSWM, according to guidelines on the number of events per variable required in multivariate models.27 Analyses of the prognostic value of onset of response was not validated, because no systematic SMIC monitoring was available.
Statistical tests were performed using the 2-tailed α level of 0.05. Data were analyzed with the SAS software package, release 9.4 (2011; SAS Institute, Cary, NC) and R package release 3.4.1 (R Foundation for Statistical Computing, Vienna, Austria).
Results
Clinical characteristics and overall survival
The derivation series consisted of 121 symptomatic patients at the time of first-line initiation (median age, 70 years; range, 39-91 years; male to female ratio, 2.0). Main clinical characteristics at each line of treatment are summarized in Table 1. The IPSSWM was low, intermediate, high, and not available in 26, 36, 42, and 17 patients, respectively.
Chlorambucil was delivered as first-line treatment until 2007 (66 patients), except in 3 situations. From 2003 to 2005, patients were enrolled in the European Waldenström trial.30 After obtaining informed consent, and during this period, they received either chlorambucil or fludarabine alone (11 patients). During the same period, 4 high-risk patients (according to current prognostic systems) received a combination of fludarabine and cyclophosphamide (2 patients) or high-dose cytosine arabinoside, dexamethasone, and cisplatyl (2 patients) as first-line treatment. Finally, 1 patient was enrolled at the time of first-line treatment in the rituximab fludarabine trial of the WM Cooperative Trial Group.23 Since 2008, elderly patients or patients without life-threatening treatment criteria received a cyclophosphamide, dexamethasone, and rituximab regimen (28 patients),24 whereas 10 patients received a bortezomib, dexamethasone, and rituximab regimen31 either after enrolment in this European trial (6 patients) or because of severe hyperviscosity syndrome (4 patients). Finally, 1 patient with only anti-myelin–associated glycoprotein neuropathy received rituximab alone, and another patient received the bortezomib-dexamethasone combination. Sixty-six patients required at least a second line of treatment, and 39 required ≥3 lines of treatment. Four patients received autologous stem cell transplantation (first line, 1 patient; later, 3 patients).
Median follow-up was 42 months for patients alive at the stopping date, with 11 patients lost to follow-up. The median survival was 88 months after the first line of treatment. Seventy-two patients have died. The cause of death was a progression of the disease in 33 cases (including histological transformation [7] and suspected Bing-Neel syndrome [1]). Death was unrelated to the disease in 17 cases and related to another malignancy in 13 other cases. The relationship between the cause of death and WM was unavailable in 9 patients (infection while tapering cortisone therapy for associated autoimmune disorder [1 patient], concomitant worsening of cognitive disorder [3 patients], and unknown cause of death [5 patients]). The incidences of unrelated and related mortality are depicted in Figure 2D.
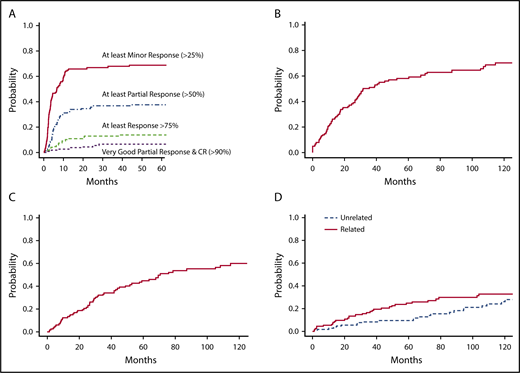
Competing risk analyses in 115 patients with available SMIC monitoring (69 patients have died). (A) Cumulative incidence of response categories after first-line treatment in patients with symptomatic WM. (B) Cumulative incidence of progression after first-line treatment (87 progressions were recorded, and 21patients died before the occurrence of progression). (C) Cumulative incidence of second treatment initiation after first-line treatment (64 patients required a second-line treatment, and 27 patients died before receiving second-line treatment). (D) Cumulative incidences of related and unrelated death (the competing risk was death unrelated or without definitive conclusion and death unrelated or without definitive conclusion, respectively).
Competing risk analyses in 115 patients with available SMIC monitoring (69 patients have died). (A) Cumulative incidence of response categories after first-line treatment in patients with symptomatic WM. (B) Cumulative incidence of progression after first-line treatment (87 progressions were recorded, and 21patients died before the occurrence of progression). (C) Cumulative incidence of second treatment initiation after first-line treatment (64 patients required a second-line treatment, and 27 patients died before receiving second-line treatment). (D) Cumulative incidences of related and unrelated death (the competing risk was death unrelated or without definitive conclusion and death unrelated or without definitive conclusion, respectively).
Prognostic value of initial IPSSWM
SAFTI was better in patients classified as IPSSWM low and intermediate risk compared with patients classified as high risk (P = .001; hazard ratio [HR], 2.30; 95% confidence interval [CI], 1.36-3.89). However, the Schoenfeld residuals plot showed that the difference in survival between the 2 subgroups decreased over time, corresponding to a departure from the proportional hazard assumption (supplemental Figure 1; P = .042). Consequently, the discrimination value of the initial sIPSSWM decreased at each yearly landmark time point (Table 2).
Discrimination values of simplified IPSSWM at initiation of first-line treatment for subsequent survival and for survival after different yearly landmark time points during the first 6 years of follow-up
| Landmark time point, mo | Number at risk | Number of subsequent deaths | Harrell C (95% CI) | Somers Dxy (95% CI) |
|---|---|---|---|---|
| 0 | 104 | 61 | 0.621 (0.557-0.685) | 0.243 (0.116-0.370) |
| 12 | 88 | 50 | 0.594 (0.520-0.668) | 0.180 (0.041-0.335) |
| 24 | 73 | 41 | 0.540 (0.460-0.621) | 0.081 (−0.081-0.244) |
| 36 | 67 | 37 | 0.555 (0.468-0.642) | 0.111 (−0.06-0.285) |
| 48 | 61 | 33 | 0.544 (0.453-0.635) | 0.089 (−0.093-0.271) |
| 60 | 55 | 29 | 0.519 (0.428-0.610) | 0.038 (−0.144-0.220) |
| 72 | 45 | 24 | 0.543 (0.434-0.651) | 0.086 (−0.131-0.303) |
IPSSWM at initiation of first-line treatment was available in 104 patients.
Prognostic value of response levels.
Response rate after first-line treatment was 71%, with 41% of patients who achieved at least a PR (Table 1). Seventy-nine out of 115 patients (complete monitoring subgroup) achieved a reduction in SMIC of ≥25% (a threshold level used for the definition MR or better), including 47 patients who achieved a ≥50% reduction in SMIC (a threshold level used for the definition of PR or better). Nine of these 47 patients achieved a ≥90% reduction in SMIC (a threshold level including the VGPR and CR categories). Besides VGPR patients, 9 other patients achieved a ≥75% reduction in SMIC. The median time to response is indicated in Table 3, and the cumulative incidence of response categories after initiation of first-line treatment is shown in Figure 2A.
Assessment of the prognostic role of onset of response (based on serum IgM concentration and coded as a time-dependent covariate) for survival after first-line treatment
| Response criteria (% SMIC reduction) | Response status | Median (IQR) time to response, mo | Number at risk | Number of deaths | HR (95% CI) | P |
|---|---|---|---|---|---|---|
| 115 | 69 | |||||
| >25 | ||||||
| Nonresponder | — | 35 | 29 | 1.00 (ref) | ||
| Responder | 3.4 (1.96-7.6) | 80 | 40 | 1.20 (0.7-2.05) | .48 | |
| >50 | ||||||
| Nonresponder | — | 68 | 49 | 1.00 (ref) | ||
| Responder | 5.7 (2.2-12.1) | 47 | 20 | 0.97 (0.57-1.67) | .93 | |
| >75 | ||||||
| Nonresponder | — | 97 | 62 | 1.00 (ref) | ||
| Responder | 8.4 (3.6-13.6) | 18 | 7 | 1.38 (0.63-3.02) | .41 | |
| >90 | ||||||
| Nonresponder | — | 106 | 63 | 1.00 (ref) | ||
| Responder | 12.3 (4.4-19.8) | 9 | 4 | 2.16 (0.82-5.71) | .15 |
None of these response levels retained prognostic value for SAFTI (Table 3). The lack of influence of onset of any response level was also found in cause-specific Cox models with related and unrelated death as competing events (supplemental Table 1).
Prognostic value of onset of progression and second treatment initiation.
The median time from first treatment initiation to progression or next treatment initiation is indicated in Table 4, and the distribution of these times according to response level and category is shown in supplemental Table 2. Cumulative incidences of progression and second treatment requirement after first-line treatment are shown in Figure 2B-C, respectively.
Assessment of the prognostic role of onset of first progression and subsequent treatment initiation (coded as time-dependent covariates) on overall survival after each line of treatment
| Event of interest | Line of treatment | Number at risk | Number of deaths | Median time (IQR) to event, mo* | Without adjustment | Adjusted for sIPSSWM† | ||||
|---|---|---|---|---|---|---|---|---|---|---|
| HR (95% CI) | P | Harrell C (95% CI) | HR (95% CI) | P | Harrell C (95% CI) | |||||
| Onset of subsequent progression | After first | 115 | 69 | 63 (37-101) | 2.94 (1.22-7.81) | .02 | 0.53 (0.48-0.59) | 2.98 (1.19-8.27) | .013 | 0.73 (0.65-0.81) |
| After second* | 64 | 42 | 53 (26-85) | 1.34 (0.56-3.13) | .49 | |||||
| After third* | 38 | 23 | 51 (32-71) | 2.19 (0.73-6.55) | .12 | |||||
| Onset of subsequent treatment initiation | After first | 115 | 69 | 69 (41-106) | 2.56 (1.38-4.89) | .006 | 0.57 (0.51-0.62) | 2.60 (1.35-5.16) | .009 | 0.72 (0.63-0.81) |
| After second* | 64 | 42 | 56 (28-93) | 1.41 (0.66-3.04) | .37 | |||||
| After third* | 38 | 23 | 59 (43-79) | 1.63 (0.51-5.23) | .4 | |||||
Complete clinical monitoring was missing in some patients after the second and the third lines of treatment.
Cox regression model including sIPSSWM at initiation of first-line treatment (available in 104 patients) and sIPSSWM by time interaction.
By contrast with onset of response, onset of progression and second treatment initiation retained prognostic values for SAFTI (P = .02 and P = .006, respectively; Table 4). In models including an sIPSSWM and sIPSSWM by time interaction, onset of progression and second treatment initiation remained significantly associated with SAFTI (Table 4), with an improvement in the discrimination value (Table 4; see also Table 2, landmark analysis at 0 months for comparison of Harrell C indexes). Onset of first progression and second treatment initiation were both significantly associated with the competing risk of WM-related death, but not with the risk of death unrelated to WM (supplemental Table 3).
Prognostic roles of time from first treatment initiation to progression and to second treatment initiation on subsequent survival
Among 87 progressive patients after first-line treatment, the time from first-line treatment to progression was not significantly associated with subsequent survival (HR, 0.99 per month; 95% CI, 0.98-1.01; P = .47). There was no departure in log linearity assumption between the time to progression and the subsequent risk of mortality (supplemental Figure 2A; test for log linearity, P = .86). Similarly, time from first-line to second-line treatment initiation was not associated with the subsequent risk of death (HR, 1.00 per month; 95% CI, 0.99-1.01; P = .63), and there was no departure from the log linearity assumption (supplemental Figure 2B; test for log linearity, P = .37).
Prognostic influence of response, progression, and next treatment initiation after the second or third line of treatment on subsequent survival
Sixty-six of the 121 patients required at least a second line of treatment (median, 28.5 months after first-line treatment initiation; range, 1-178 months), and 39 required a third line of treatment (median, 57.9 months after first-line treatment initiation; range, 10-180 months). Median survival was 69 and 68 months after the second and third lines of treatment, respectively.
Onset of response (data not shown), onset of next progression, and next treatment initiation (Table 4) retained no prognostic significance for survival after initiation of second and third lines of treatment. The onsets of second and third progression were also found to be significantly associated with the risk of death related to WM, but not with the risk of death from causes unrelated to WM after the second and third lines of treatment. Next treatment initiation was significantly associated with the risk of related death only after third-line treatment (supplemental Table 3).
Validation of analyses on onset and time of progression and second treatment initiation
Besides a difference in accrual period, we found significant differences in the distribution of age, IPSSWM, and response category achieved in the validation and the derivation series (P < .02; supplemental Table 4). In the validation series, 66 progressions were recorded, and 58 patients required second-line treatment. Twenty-one deaths were recorded (9 before progression and 12 after at least second-line treatment). Thus, 44 patients are alive without progression after first-line treatment, 8 patients after first progression and before second-line treatment, and 46 patients later.
In univariate Cox models, onset of progression and onset of second treatment initiation were significantly associated with SAFTI in the validation cohort (supplemental Table 5). Cause-specific HRs of onset of progression and second treatment initiation for the risk of related death were significantly different from 1 (supplemental Table 5).
The lack of influence of time from first-line treatment to progression and second-line treatment initiation on the subsequent risk of death was also observed in the validation series (HR, 1.0 per month; 95% CI, 0.96-1.03; P = .85; and HR, 0.97 per month; 95% CI, 0.91-1.02; P = .29).
Discussion
The present study evaluated the prognostic roles during the clinical course of characteristics assessed before initiating treatment and during follow-up in patients with symptomatic WM.
The prognostic role of events that occur during the evolution of WM (such as response or progression) besides initial characteristics (summarized by the IPSSWM) is unclear. Although a Dxy index associated with high-risk IPSSWM retained a satisfactory value in landmark analyses performed after up to 6 years of follow-up, this value decreased over time, and we found that the proportional hazard assumption did not hold in this model. Indeed, departure from the proportional hazard hypothesis translates into a change in hazard rates over time, as already reported in patients with multiple myeloma21 or myelodysplastic syndrome.18 This finding prompted us to check whether additional events observed during follow-up may provide useful prognostic information in addition to the initial IPSSWM.
Response assessment is largely used in clinical practice to predict subsequent risk. However, in contrast with results found in myeloma patients,21 achieving a response (regardless of its level based on cutoff in reduction of SMIC) retained no significant prognostic value in WM patients when coded as a time-dependent covariate. This finding was confirmed in cause-specific Cox models, taking the competing risk of death unrelated to WM into account. However, caution is required in the interpretation of these results: The positive association of VGPR with all-cause mortality is counterintuitive and should be interpreted carefully, since there were only 9 patients with a VGPR or CR.
The difference in time to response (which is usually short in myeloma patients and sometimes very prolonged in WM) and the limited number of patients with CR probably explain, at least in part, the discrepancy in the prognostic role of onset of response between myeloma and WM.
On one hand, in WM patients, a previous report32 indicated a limited role for the depth of response after rituximab single-agent therapy. Furthermore, achieving at least an MR response level to the fludarabine rituximab regimen was also significantly associated with prolonged subsequent survival.23 On the other hand, despite a very limited number of progressions in patients with a VGPR, the outcome reported in supplemental Table 2 agreed with the previously reported improvement in progression-free survival (PFS) in patients with a VGPR.9 Besides the limited number of patients with VGPRs (in agreement with previous reports on current treatment), the use of a Cox model with a time-dependent covariate (which takes into account the time elapsed until onset of VGPR) may also explain the lack of a prognostic role for onset of VGPR or CR. Finally, our findings support efforts made by several authors10,33 to improve response assessment. The evolution of the bone marrow34 and the circulating35 components of the disease may also provide useful prognostic information. However, delayed onset of changes should be taken into account when assessing the role of these new parameters.
Conversely, the onset of progression and the initiation of second-line treatment coded as time-dependent covariates provided independent prognostic information in addition to the initial IPSSWM in Cox models of SAFTI. These results were reinforced by the validation of the prognostic role of the 2 time-dependent covariates in an independent series despite marked differences, especially in treatment approaches, period of follow-up, and number of recorded events.
The high frequency of unrelated deaths in both series may obscure the prognostic impact of events observed during the evolution of WM. Given the efficacy of new drugs, this pitfall may become more and more frequent. For this reason, we systematically supplemented survival analyses with competing risk analyses in this population with many elderly patients. Thus, we also found a prognostic value of onset of progression and second treatment initiation for the risk of death related to WM in the 2 series.
We also assessed the log linearity assumption between the time to progression and the subsequent risk of mortality, as well as between the time to second treatment initiation and subsequent risk. The validation of this assumption in both models does not suggest the existence of a possible cutoff value for these 2 explanatory variables (time to progression and time to second treatment), in contrast to the recently proposed 2-year cutoff in the time to progression of disease for follicular lymphoma.20 Finally, the lack of influence of times to progression and to second treatment initiation on subsequent risk may be explained in the derivation series by the availability of a very effective new combination regimen that may have efficiently rescued patients who failed (even early) the first-line single-agent regimen (eg, with rituximab, chlorambucil, or fludarabine alone), but it was also observed in the validation series of patients who received chemoimmunotherapy. Given the large number of new drugs recently developed, this scenario may occur again in current and future patients.
These results have several implications. First, PFS after first-line treatment (whatever response achieved) may be a good candidate for a surrogate end point of overall survival.36 For treatment evaluation, demonstration of this assumption in an international collaborative study may avoid survival estimation, an end point more and more time- and effort-consuming, hopefully because new therapeutic approaches reduced the incidence of events. In addition, no time point in onset of progression was associated with a difference in subsequent outcome in this series. Thus, a clinical trial designed to assess PFS after first-line treatment as the end point would not require a disease-specific time point; consequently, this time point may be chosen according to the available accrual rate for getting the final results as quickly as possible. Moreover, our results support the role of maintenance. Since time of onset of progression was significantly associated with SAFTI, theoretically, any treatment aimed at delaying onset of progression, such as maintenance therapy, may improve SAFTI.37 This assumption remains to be prospectively validated. Finally, tests aimed at identifying progression early (eg, with the monitoring of MYD88(L265P)-positive cells) will likely provide useful prognostic information.
Response, as defined by SMIC criteria, retained no significant prognostic value for survival after the second and the third lines of treatment. However, a significant association was also found between progression (after second- and third-line treatment) and next treatment initiation (after third-line treatment) and the risk of related death.
Assessment of the long-term prognostic role of events observed during follow-up cannot be obtained from prospective multicenter clinical trials. For this purpose, we took advantage of continuously updated clinical databases with very prolonged follow-up and careful monitoring of information throughout the evolution of the disease. Furthermore, our results seem to be robust to treatment regimens. Contrary to derivation series, all patients of the validation series received immunochemotherapy according to only 2 regimens; the results observed in the validation series were concordant with those observed in the derivation series, supporting a broad reproducibility.
Finally, once a sufficient number of events are recorded, similar analysis should probably be regularly repeated in the future, given the high number of new therapeutic approaches, especially the introduction of Bruton tyrosine kinase inhibitors, that may improve the depth of responses, modify the response paradigm, and/or improve the outcome.5
We conclude that onset of progression or second treatment initiation provides information about prognosis, but not response. Therefore PFS or time to next treatment after first-line treatment may be a satisfactory surrogate end point of OS in this disease.
The full-text version of this article contains a data supplement.
Acknowledgments
The authors thank Veronique Leblond for support and very fruitful comments and the referees for their valuable comments, which led to improvements in the manuscript.
Authorship
Contribution: J.L., A.D., and P.M. designed the study; S.G., L.Y., J.B., C.D., C.P., B.H., H.D., M.V., J.P.M., and P.M. collected patient clinical data; J.L., E.D., A.D., and P.M. performed statistical analyses; J.L., A.D., and P.M. wrote the manuscript; J.P.M. commented on the manuscript; all authors approved the manuscript; and the French Innovative Leukemia Organization (FILO) CLL group supported the study, provided patient clinical data, and commented on and approved the manuscript.
Conflict-of-interest disclosure: The authors declare no competing financial interests.
A complete list of the members of the French Innovative Leukemia Organization CLL group appears in “Appendix.”
Correspondence: Pierre Morel, Service d’Hematologie Clinique et Therapie Cellulaire, Centre Hospitalier Universitaire d’Amiens-Picardie, D408, 80054 Amiens, France; e-mail: morel.pierre@chu-amiens.fr.
Appendix: study group members
The members of the French Innovative Leukemia Organization CLL group are: C. Algrin (Grenoble, France), T. Aurran (Marseille, France), J. N. Bastie (Dijon, France), M. C. Bene (Nancy, France), A. Brion (Besançon, France), J. Broseus (Nancy, France), G. Cartron (Montpellier, France), A. Clavert (Angers, France), F. Cymbalista (Bobigny, France), C. Dartigeas (Tours, France), F. Davi (Paris, France), S. De Guibert (Rennes, France), M. H. Delfau (Créteil, France), A. Delmer (Reims, France), M. S. Dilhuydy (Bordeaux, France), B. Drenou (Mulhouse, France), B. Dreyfus (Poitiers, France), C. Dumontet (Lyon, France), J. Dupuis (Créteil, France), E. Ferrant (Lyon, France), P. Feugier (Nancy, France), B. Fontanet (Bordeaux, France), L. Fornecker (Strasbourg, France), D. Ghez (Villejuif, France), R. Guieze (Clermont-Ferrand, France), C. Herbaux (Lille, France), B. Hivert (Lille, France), K. Laribi (Le Mans, France), A. Lavaud (Paris, France), K. Le Du (Le Mans, France), M. Le Garff-Tavernier (Paris, France), M. Le Goff (Le Mans, France), V. Leblond (Paris, France), S. Lepretre (Rouen, France), R. Letestu (Bobigny, France), V. Levy (Bobigny, France), B. Mahe (Nantes, France), K. Maloum (Paris, France), M. Maynadie (Dijon, France), F. Merabet (Versailles, France), A. S. Michallet (Lyon, France), L. Molina (Grenoble, France), P. Morel (Amiens/Lens, France), F. Nguyen-Khac (Paris, France), B. Pollet (Boulogne/Mer, France), S. Poulain (Lille, France), A. Quinquenel (Reims, France), S. Raynaud (Nice, France), D. Re (Antibes, France), P. Rodon (Périgueux, France), D. Roos-Weil (Paris, France), L. Sanhes (Perpignan, France), D. Sibon (Paris, France), L. Simon (Paris, France), C. Thieblemont (Paris, France), C. Tomowiak (Poitiers, France), O. Tournilhac (Clermont-Ferrand, France), X. Troussard (Caen, France), M. Truchan-Graczyk (Saumur, France), E. Van Den Neste (Brussels, Belgium), M. Vignon (Paris, France), J. P. Vilque (Caen, France), M. Voldoire (La Roche Sur Yon, France), L. Willems (Paris, France), L. Ysebaert (Toulouse, France), J. M. Zini (Paris, France), A. Fayault (Tours, France), D. Nollet (Tours, France), V. Rouille (Montpellier, France), and S. Vaudaux (Rouen, France).

