

Key Points
Relative increases in TAT and D-dimer are associated with fast-growing AAAs.
Plasma levels of TAT and D-dimer may serve as predictive biomarkers in AAA progression.

Abstract
Abdominal aortic aneurysm (AAA) is associated with high morbidity and mortality and is an established cause of unbalanced hemostasis. A number of hemostatic biomarkers have been associated with AAA; however, the utility of hemostatic biomarkers in AAA diagnosis and prognosis is unclear. The aim of the present study was to characterize the potential prognostic value of D-dimer and markers of altered hemostasis in a large cohort of patients with AAAs characterized by either fast or slow aneurysm growth (frequency matched for baseline diameter) and subaneurysmal dilations. We measured plasma concentrations of thrombin-antithrombin (TAT) complex, platelet factor 4 (PF4), and D-dimer in 352 patients with either fast-growing AAAs (>2 mm/y), slow-growing AAAs (<2 mm/y), subaneurysmal aortic dilations, or nonaneurysmal aortas. Plasma D-dimer and TAT were significantly elevated in both AAA and subaneurysmal dilation patients compared with controls. Individuals with D-dimer levels ≥500 ng/mL had 3.09 times the odds of subaneurysms, 6.23 times the odds of slow-growing AAAs, and 7.19 times the odds of fast-growing AAAs than individuals with D-dimer level <500 ng/mL. However, no differences in D-dimer concentration were noted between fast- and slow-growing aneurysms. Plasma D-dimer and TAT were strong independent predictors of AAA growth rate with multivariate analysis revealing a 500-ng/mL increase in D-dimer or 1-µg/mL increase in TAT led to additional 0.21-mm and 0.24-mm changes in aortic diameter per year, respectively. Rising levels of plasma TAT, in addition to D-dimer, may predict disease progression and aneurysm growth in patients with AAA or subaneurysmal dilation.
Introduction
Abdominal aortic aneurysm (AAA) is a prevalent and potentially lethal disease affecting 5% to 10% of men and 1% of women over the age of 65.1-3 Although AAAs are typically defined by an aortic diameter >30 mm, detection of smaller subaneurysmal aortic dilations (SAAs; 25-29 mm in diameter) is also common due to the increased utilization of ultrasound-based screening programs.4-7 Such programs have been shown to significantly decrease AAA-related mortality and rupture.8,9 Currently, surgical repair is only considered for acutely symptomatic, large (≥55 mm), or rapidly growing (≥10 mm/y) aneurysms.10 As a result, the standard of care for small (≤55 mm) aneurysms is limited to surveillance, and most screening protocols do not recommend surveillance for patients with subaneurysmal dilations.11,12 However, small AAAs and subaneurysmal dilations will ultimately progress to an AAA that requires repair or results in rupture.13,14 The ability to predict aneurysm progression and stratify patients accordingly is, therefore, a major priority.
To aid in the prognosis and stratification of AAA patients, a large number of studies have investigated markers of thrombosis and hemostasis with AAA presence.15 AAAs are highly associated with platelet activation and deranged hemostasis, which leads to the formation of an intraluminal thrombus (ILT) in most patients.16,17 Although thrombus formation may serve as a protective effect early in the course of aneurysm development, mounting evidence implicates ILT formation and remodeling with AAA progression.18,19 Consistent with this hypothesis, studies of patients with both large and small AAAs have shown significantly higher levels of thrombin-antithrombin (TAT) complexes and D-dimer in larger aneurysms.20,21 In addition, markers of platelet activation, such as microparticles, soluble P-selectin, and sCD40L released from mural thrombi, have been found to be elevated in AAA patients.22 However, although these results appear to be correlated with thrombus formation and aneurysm size, few studies have investigated whether these markers are associated with AAA progression and the value of such markers in patients with subaneurysmal dilations.
Of the markers examined, plasma D-dimer has been the most extensively studied. Plasma D-dimer concentrations reflect the extent of fibrin turnover and are significantly higher in patients with AAAs.23,24 In the largest study, D-dimer concentrations in 299 AAA patients were also positively and significantly associated with AAA growth over a 5-year period.25 However, this study did not assess the prognostic ability of D-dimer in patients with subaneurysmal dilations. Conversely, a recent study by Vele et al demonstrated an even stronger correlation between D-dimer concentrations and growth over a 12-month period in 30 patients with subaneurysmal dilations.26 Although these studies have clearly established the credibility of D-dimer as a marker of AAA progression, it is still unclear how D-dimer and other markers of altered hemostasis can be used to stratify aneurysms by growth rate or identify patients with subaneurysmal dilations who are at the greatest risk of progression. In order to address these limitations, the aim of the present study was to characterize the potential prognostic value of D-dimer and markers of altered hemostasis in a large cohort of patients with AAAs and subaneurysmal dilations characterized by either fast or slow aneurysm growth.
Methods
This research was approved by the Research Ethics Review Board of the Uppsala region and the institutional review board at the University of Cincinnati. All participants gave written informed consent prior to participation. All patients and controls were of similar ethnic origin (European and white) and socioeconomic backgrounds.
Patient population
Between 2008 and 2016, patients in Uppsala with an AAA, patients with SAA, or healthy controls were asked to donate blood to investigate pathophysiological biomarkers of AAA expansion. All blood, plasma, and measurements were collected and tabulated at the time of enrollment, with the exception of the final follow-up diameter measurement and change in AAA growth. For AAA patients, inclusion criteria in the present study included aortic diameter >30 mm and follow-up of >6 months. Patients with ruptured AAA, coexisting malignant disease, dialysis dependence, recent thromboocclusive disease, or on antithrombotic therapy (oral anticoagulants or antiplatelet drugs other than aspirin/acetylsalicylic acid, ASA) were excluded. SAA was defined as an aortic diameter of 25 to 29 mm. AAA patients were further classified as fast growing if a change in aortic diameter of >2 mm per year was detected by follow-up ultrasound (calculated via last diameter − first diameter/time between measurements), with a mean follow-up time of 4.2 years after initial diameter. In the present study, plasma samples from participants with fast-growing AAAs, slow-growing AAAs, SAA, and normal (nonaneurysmal) aortas were analyzed.
Among a total of 192 AAA patients fulfilling the inclusion criteria, we analyzed 84 patients with slow-growing AAAs and 85 patients with fast-growing AAAs. Patient matching was performed by baseline size, in order to compare slow- and fast-growing AAAs rather than small and large AAAs, and frequency matching was employed for normalization of group size. In addition, 68 subjects with an SAA at screening were included. A total of 115 healthy patients with a normal abdominal aorta at screening were frequency matched for age as controls. Thus, the final study population consisted of 352 patients with either fast-growing AAAs, slow-growing AAAs, SAA, or nonaneurysmal aortas.
At the time of enrollment, all participants completed a standardized health questionnaire to assess medical history and smoking habits. Coronary heart disease (CHD) was defined as a history of angina pectoris or myocardial infarction. Cerebrovascular disease (CVD) included a past history of stroke or transient ischemic attack. Hypertension was defined as a history of hypertension or use of a prescribed antihypertensive medication. A history of diabetes mellitus was defined as current or past treatment of a diabetic illness or prescription of any diabetic medication. Renal insufficiency was defined by a documented history of renal impairment (chronic kidney disease). Smoking status was defined as former for any individual who had smoked at some point in their life or currently smoking.
Blood sampling and assays
Peripheral venous blood samples were taken from participants at the time of enrollment using sodium citrate collection tubes. Citrate collection was the last blood vial used to disseminate any initial platelet activation via the process of venipuncture. Samples were centrifuged at 2000g for 20 minutes at room temperature, and aliquots of platelet poor plasma were flash frozen and stored at −80°C until analysis. Commercially available enzyme-linked immunosorbent assays (ELISA) were used to measure levels of TAT complexes (Enzygnost TAT micro; Dade Behring AG, Marburg, Germany), D-dimer (Asserachrom D-Di; Diagnostica Stago, Inc, Parsippany, NJ), and platelet factor 4 (PF4; Quantikine Human CXCL4/PF4; R&D Systems, Minneapolis, MN). All ELISA assays were performed according to the manufacturers' instructions and analyzed on a Cytation 5 multiplate reader (Biotek, Winooski, VT). The intra- and interassay coefficients of variation were 4% to 6% and 6% to 9% for TAT; 6.1% to 7.0% and 5.4% to 5.6% for D-dimer; and 6.0% to 8.1% and 9.9% to 11.9% for PF4, respectively. To decrease variability, we performed all assays in triplicate utilizing the same lots of prepared ELISAs from the manufacturer.
Statistical analysis
Differences in participant characteristics by case status (fast-growing AAAs, slow-growing AAAs, SAA, or controls) were evaluated using Kruskal-Wallis equality-of-populations rank test for continuous variables and Pearson’s χ2 test for categorical variables. All pairwise comparisons for differences in biomarker levels between study groups were tested using Wilcoxon rank-sum test, and P values were Bonferroni corrected with a factor of 7 to reflect the total number of pairwise comparisons made for each group.
We used separate multinomial logistic regression models to estimate the odds ratios (OR) and 95% confidence intervals (CI) for the associations between case status and several participant characteristics: D-dimer level, TAT level, PF4 level, statin use, ASA use, and smoking status. In all multinomial logistic regression models, participants without aneurysm serve as the comparison group. Biomarkers were modeled as quartiles due to the nonlinearity of the relationship between biomarker levels and outcome. Covariates for each model were determined using forward, stepwise selection that required a significance level of P value ≤.10. Candidate covariates included factors known and suspected to influence risk of AAA progression, including age and body mass index (modeled as continuous variables), CHD, hypertension, CVD, claudication, chronic obstructive pulmonary disease, renal insufficiency, diabetes, smoking status, ASA use, and statin use (modeled as categorical variables), and the other biomarkers (modeled as quartiles). We could not test for or adjust for any potential confounding by sex because there were only men in the control group. In model building, variables in which 5 or less observations were missing, values were replaced with the median or most common value. For measures with >5 observations missing (weight and height), we used multivariate normal regression informed by participant age, sex, and case status to impute missing values. Postestimation Wald tests were performed to detect significant differences in estimated parameters between case groups.
D-dimer was also modeled as a continuous variable using restricted cubic spline terms. We plotted the adjusted ORs from logistic regression models for each case status across values of D-dimer level (referent 500 ng/mL). In each model, participants without aneurysm served as the comparator.
We used linear regression to estimate β coefficients and 95% CIs for biomarkers and participant characteristics associated with aneurysm growth among cases. Forward stepwise selection requiring a significance level of P ≤ .10 for inclusion was used to determine which measures were associated with aneurysm growth. All analyses were conducted with STATA statistical software version 12.0 (StataCorp LP, College Station, TX). All statistical tests between groups assumed 2-tailed distributions, and P < . 05 was used for significance.
Results
Study group characteristics
Baseline characteristics of the study participants are shown in Table 1. Eighty-four AAAs were classified as slow growing, and 85 AAAs were classified as fast growing, of which 89.3% and 87.1% were men, respectively. Among SAA patients, 91.2% were men. All control patients with normal aortic diameters were men. Median rate of growth was 0.95 mm/y (interquartile range [IQR]: 0.40-1.45) for slow-growing aneurysms and 3.10 mm/y (IQR: 2.50-4.70) for fast-growing aneurysms. Smoking, cardiovascular disease, and chronic obstructive pulmonary disease were more common among AAA patients than controls or SAA patients. Individuals with SAAs or AAAs were older than controls, and statin use was more common among SAA and AAA patients than in controls. Interestingly, the incidence of diabetes and claudication was more prevalent among slow-growing AAAs (Table 1).
Participant characteristics and risk factors by study group
| Control (n = 115) | Subaneurysmal (n = 68) | AAA | |||
|---|---|---|---|---|---|
| Characteristic | Slow growing (n = 84) | Fast growing (n = 85) | P* | ||
| Age, y | 65 (65-70) | 72 (70-75) | 72 (68-77) | 72 (68-78) | <.001 |
| Sex | .002 | ||||
| Male | 115 (100) | 62 (91.2) | 75 (89.3) | 74 (87.1) | |
| Female | 0 (0) | 6 (8.8) | 9 (10.7) | 11 (12.9) | |
| Height, cm† | 178 (174-183) | 179 (173-183) | 181 (177-184) | 180 (175-186) | .084 |
| Weight, kg† | 83 (75-90) | 85 (78-94) | 88 (78-98) | 88 (80-97) | .112 |
| Baseline aneurysm diameter, mm | 18 (17-19) | 28 (26-29) | 36 (34-40) | 39 (33-43) | <.001 |
| Final aneurysm diameter, mm | — | 32 (30-36) | 40 (36-46) | 50 (45-55) | <.001 |
| Aorta growth, mm/y | — | 0.90 (0.55-1.50) | 0.95 (0.40-1.45) | 3.10 (2.50-4.70) | <.001 |
| CHD | 10 (8.7) | 15 (22) | 28 (33.3) | 30 (35.3) | <.001 |
| Hypertension | 56 (48.7) | 35 (51.5) | 59 (70.2) | 52 (61.2) | .025 |
| CVD | 5 (4.4) | 6 (8.8) | 22 (26.2) | 7 (8.2) | <.001 |
| Claudication | 1 (0.9) | 6 (8.8) | 10 (11.9) | 1 (1.2) | .001 |
| Chronic obstructive pulmonary disease | 5 (4.4) | 3 (4.4) | 15 (17.9) | 14 (16.5) | .002 |
| Renal insufficiency | 2 (1.7) | 1 (1.5) | 4 (4.8) | 5 (5.9) | .293 |
| Diabetes | 17 (14.8) | 9 (13.2) | 19 (22.6) | 6 (7.1) | .036 |
| ASA use | 17 (14.8) | 24 (35.3) | 45 (53.7) | 39 (45.9) | <.001 |
| Statin use | 30 (26.1) | 31 (45.6) | 41 (48.8) | 36 (42.4) | .003 |
| Smoking status | <.001 | ||||
| Current | 6 (5.2) | 24 (35.3) | 18 (21.4) | 32 (37.6) | |
| Former | 57 (49.6) | 30 (44.1) | 58 (69.0) | 40 (47.1) | |
| Never | 51 (44.3) | 13 (19.1) | 7 (8.3) | 13 (15.3) | |
| Smoking years‡ | 20 (14-32) | 41 (26-50) | 40 (28-47) | 45 (31-50) | <.001 |
| Cigarettes/d3 | 15 (10-20) | 12 (10-15) | 15 (10-20) | 15 (10-20) | .512 |
P value from Kruskal-Wallis test for continuous variables and from χ2 test for categorical variables. Data are presented as median (IQR) for continuous variables, and categorical variables are given as counts (percentages).
Eight-seven participants were missing both height and weight; 2 participants were missing only height, and 11 were missing only weight.
Among current or former smokers.
Hemostatic markers
Plasma levels of D-dimer, TAT, and PF4 were significantly greater in AAA patients than SAA patients or controls (Figure 1; Table 2). Compared with controls, D-dimer concentrations were increased 151%, 104%, and 49.5% in fast-growing AAAs, slow-growing AAAs, and SAAs, respectively (all P < .05). D-dimer levels were also significantly greater in all AAA patients compared with SAA patients (median 914 ng/mL [IQR: 580-1451] vs 595 [IQR: 439-862] ng/mL, P < .001). However, D-dimer levels were not different between fast- and slow-growing aneurysms (P = .10). Plasma TAT levels were significantly elevated in all case groups compared with controls (P < .001 for all pairwise comparisons). PF4 levels were highly variable within each study group. Participants with SAA and fast-growing AAAs had elevated PF4 when compared with controls (P = .002 and .008, respectively).
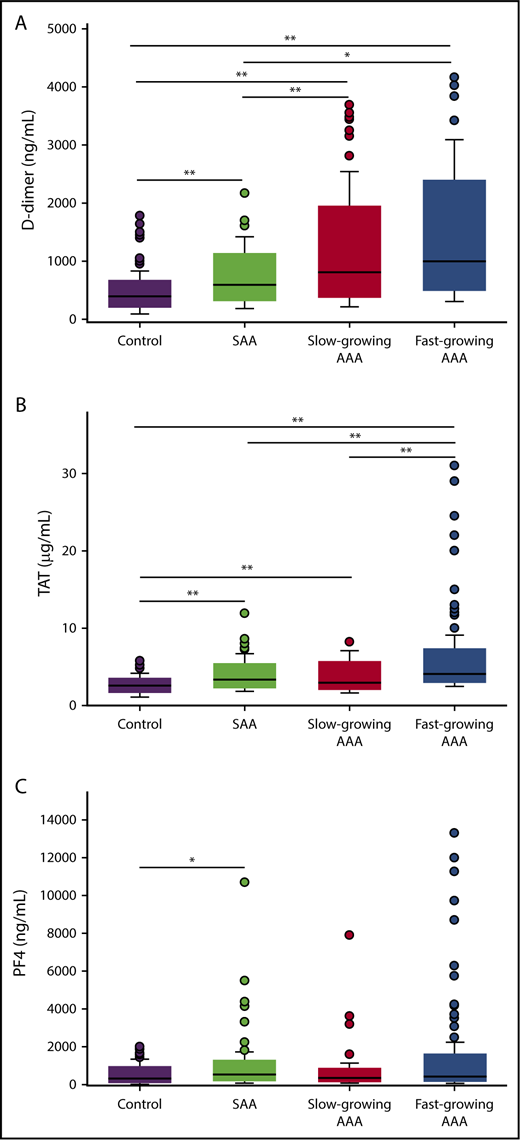
Plasma biomarker concentrations between study groups. Plasma levels of D-dimer (A), TAT (B), and PF4 (C) were measured by ELISA in patients with fast growing AAAs, slow growing AAAs, SAAs, or controls. A total of 347, 350, and 348 patients were included in the D-dimer, TAT, and PF4 analysis, respectively. *P < .05, **P < .01 (P values from Wilcoxon rank-sum test for all pairwise comparisons; P values are Bonferroni corrected with a factor of 7 equal to the number of pairwise comparisons made for each biomarker).
Plasma biomarker concentrations between study groups. Plasma levels of D-dimer (A), TAT (B), and PF4 (C) were measured by ELISA in patients with fast growing AAAs, slow growing AAAs, SAAs, or controls. A total of 347, 350, and 348 patients were included in the D-dimer, TAT, and PF4 analysis, respectively. *P < .05, **P < .01 (P values from Wilcoxon rank-sum test for all pairwise comparisons; P values are Bonferroni corrected with a factor of 7 equal to the number of pairwise comparisons made for each biomarker).
Participant characteristics and risk factors by study group, median (IQR), or n (%)
| Control (n = 115) | Subaneurysmal (n = 68) | AAA | |||
|---|---|---|---|---|---|
| Characteristic | Slow growing (n = 84) | Fast growing (n = 85) | P* | ||
| D-dimer, ng/mL | 398 (310-520) | 595 (439-862) | 812 (531-1367) | 998 (677-1681) | <.001 |
| D-dimer quartiles, ng/mL | <.001 | ||||
| <406 | 60 (53.6) | 14 (20.6) | 7 (8.3) | 5 (5.9) | |
| 406-594 | 30 (26.8) | 20 (29.4) | 23 (27.4) | 14 (16.5) | |
| 595-1006 | 16 (14.3) | 24 (35.3) | 22 (26.2) | 26 (30.6) | |
| >1006 | 6 (5.4) | 10 (14.7) | 32 (38.1) | 40 (47.1) | |
| D-dimer threshold, ng/mL | <.001 | ||||
| <500 | 79 (70.4) | 22 (32.4) | 17 (20.2) | 12 (14.1) | |
| ≥500 | 33 (29.5) | 46 (67.7) | 67 (79.8) | 73 (85.9) | |
| PF4 | 321 (142-624) | 536 (253-849) | 337 (175-637) | 431 (202-1046) | .003 |
| PF4 quartiles | .105 | ||||
| <182 ng/mL | 37 (32.5) | 10 (14.9) | 23 (28.1) | 17 (20.2) | |
| 182-372 ng/mL | 26 (22.8) | 17 (25.4) | 25 (30.5) | 19 (22.6) | |
| 373-739 ng/mL | 29 (25.4) | 18 (26.7) | 17 (20.7) | 23 (27.4) | |
| >739 ng/mL | 22 (19.3) | 22 (32.8) | 17 (20.7) | 25 (29.8) | |
| TAT μg/mL | 2.58 (2.15-3.01) | 3.38 (2.71-4.26) | 2.97 (2.40-4.42) | 4.09 (3.39-4.72) | <.001 |
| TAT quartiles, μg/mL | <.001 | ||||
| <2.48 | 52 (45.6) | 12 (17.9) | 24 (28.6) | 1 (1.2) | |
| 2.5-3.1 | 36 (31.6) | 12 (17.9) | 22 (26.2) | 17 (20.0) | |
| 3.1-4.2 | 22 (19.3) | 25 (37.3) | 15 (17.9) | 25 (29.4) | |
| >4.2 | 4 (3.5) | 18 (26.9) | 23 (27.4) | 42 (49.4) | |
P value from Kruskal-Wallis test for continuous variables and from χ2 test for categorical variables. Data are presented as median (IQR) for continuous variables, and categorical variables are given as counts (percentages).
Multivariable regressions
The relationship between hemostatic markers and risk factors across study groups was further examined in multivariable regression models. Individuals who had SAA had >3 times the odds of having a D-dimer level >500 ng/mL compared with controls. Individuals with slow-growing AAA and fast-growing AAA had 6 and 7 times the odds of having a D-dimer level >500 ng/mL compared with controls, respectively (Table 3; supplemental Table 1). To better understand the relationship between D-dimer levels and the outcome groups, we also modeled D-dimer using restricted cubic splines and adjusted for the same covariates (Figure 2).
Multinomial logistic regression models comparing the association between biomarkers or participant characteristics and aneurysm status
| Subaneurysms (n = 68) | Slow growing AAA (n = 84) | Fast growing AAA (n = 85) | ||||
|---|---|---|---|---|---|---|
| Adjusted OR | 95% CI | Adjusted OR | 95% CI | Adjusted OR | 95% CI | |
| D-dimer quartiles, ng/mL* | ||||||
| <406 | 1.00 | (referent) | 1.00 | (referent) | 1.00 | (referent) |
| 406-594 | 1.93 | 0.72, 5.20 | 4.26 | 1.42, 12.74 | 3.80 | 1.06, 13.63 |
| 595-1006 | 3.33 | 1.13, 9.79 | 6.92 | 2.11, 22.75 | 8.63 | 2.29, 32.45 |
| >1006 | 2.58 | 0.51, 10.86 | 18.59 | 4.56, 75.77 | 26.48 | 5.86, 119.68 |
| D-dimer threshold, ng/mL* | ||||||
| <500 | 1.00 | (referent) | 1.00 | (referent) | 1.00 | (referent) |
| ≥500 | 3.09 | 1.37, 6.97 | 6.23 | 2.72, 14.27 | 7.19 | 2.90, 17.83 |
| PF4 quartiles, ng/mL† | ||||||
| <182 | 1.00 | (referent) | 1.00 | (referent) | 1.00 | (referent) |
| 182-372 | 2.63 | 0.78, 8.88 | 1.76 | 0.59, 5.27 | 1.59 | 0.48, 5.31 |
| 373-739 | 1.29 | 0.39, 4.21 | 0.33 | 0.10, 1.06 | 0.58 | 0.17, 1.94 |
| >739 | 1.91 | 0.61, 5.97 | 0.48 | 0.15, 1.48 | 0.74 | 0.22, 2.37 |
| TAT quartiles, μg/mL‡ | ||||||
| <2.48 | 1.00 | (referent) | 1.00 | (referent) | 1.00 | (referent) |
| 2.5-3.1 | 0.89 | 0.31, 2.53 | 0.76 | 0.30, 1.96 | 15.03 | 1.76, 128.3 |
| 3.1-4.2 | 3.74 | 1.30, 10.70 | 0.65 | 0.21, 2.03 | 26.57 | 2.99, 235.99 |
| >4.2 | 11.60 | 2.35, 57.20 | 5.37 | 1.11, 26.07 | 240.02 | 21.13, 2725.97 |
| Statin use§ | ||||||
| Yes | 1.97 | 0.81, 4.75 | 2.34 | 0.97, 5.60 | 1.35 | 0.53, 3.46 |
| ASA use‖ | ||||||
| Yes | 1.70 | 0.55, 5.20 | 3.16 | 1.05, 9.48 | 1.72 | 0.54, 5.49 |
| Smoking status¶ | ||||||
| Never | 1.00 | (referent) | 1.00 | (referent) | 1.00 | (referent) |
| Former | 1.98 | 0.79, 4.97 | 6.68 | 2.33, 19.15 | 2.70 | 0.96, 7.58 |
| Current | 20.83 | 5.39, 81.29 | 28.21 | 6.30, 126.37 | 24.32 | 5.74, 103.04 |
In this multinominal logistic regression, participants without aneurysm serve as the comparator for the 3 aneurysm groups (subaneurysm, slow-growing AAA, and fast-growing AAA).
D-dimer models adjusted for age, TAT, smoking status, CHD, and renal insufficiency.
PF4 models adjusted for age, TAT, D-dimer, smoking status, CHD, renal insufficiency, and diabetes.
TAT models adjusted for age, D-dimer, smoking status, CHD, and renal insufficiency.
Statin use model adjusted for age, TAT, D-dimer, smoking status, CHD, renal insufficiency, and diabetes.
ASA use model adjusted for age, TAT, D-dimer, smoking status, renal insufficiency, CHD, and diabetes.
Smoking status model adjusted for age TAT, D-dimer, CHD, and renal insufficiency.
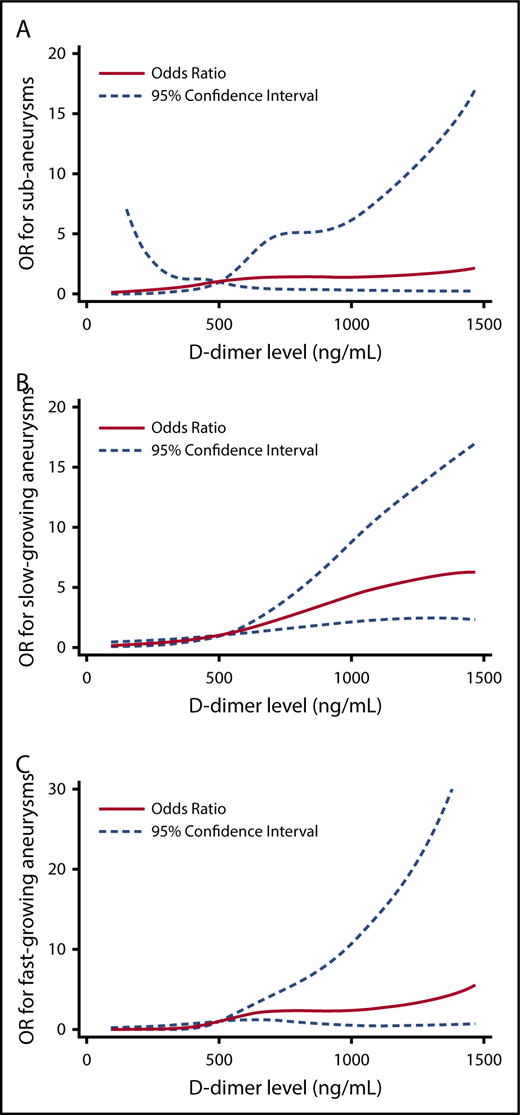
Multivariable logistic regression analysis of D-dimer concentrations between study groups. The OR for case status across D-dimer level (modeled using restricted cubic spline terms, referent 500 ng/mL). In each figure, participants without an aneurysm serve as the comparator. Models are adjusted for age, TAT (quartiles), smoking status, CHD, and renal insufficiency. (A) Predicted OR for SAAs. (B) Predicted OR for slow-growing AAA. (C) Predicted OR for fast-growing AAA.
Multivariable logistic regression analysis of D-dimer concentrations between study groups. The OR for case status across D-dimer level (modeled using restricted cubic spline terms, referent 500 ng/mL). In each figure, participants without an aneurysm serve as the comparator. Models are adjusted for age, TAT (quartiles), smoking status, CHD, and renal insufficiency. (A) Predicted OR for SAAs. (B) Predicted OR for slow-growing AAA. (C) Predicted OR for fast-growing AAA.
Individuals with fast-growing AAA had 240.0 times the odds of having a TAT concentration in the highest quartile (>4.2 μg/mL) compared with controls (95% CI 21.1-2726.0; Table 3). In contrast, the odds of having a TAT concentration >4.2 μg/mL was significantly less for participants with slow-growing AAAs compared with fast-growing AAAs (5.37 vs 240.02; P < .001, Wald test). PF4 concentration was not associated with risk of any outcome. Individuals with SAAs, slow-growing AAAs, or fast-growing AAAs had much greater odds of being current smokers compared with controls (adjusted ORs range: 20.8-28.2; Table 3).
AAA growth was associated with both D-dimer level (β = 0.21 mm/y for every 500 ng/mL increase in D-dimer, 95% CI 0.09-0.33) and TAT (β = 0.24 mm/y for every 1 μg/mL increase in TAT, 95% CI 0.19-0.29; Table 4). Interestingly, the presence of CVD and diabetes was associated with lower AAA growth rates compared with patients without either of these comorbidities potentially due to heart failure and the lower forces present in the aorta of patients with cardiomyopathies.
Multivariable linear regression for growth among cases, covariates chosen using stepwise selection (n = 237)
| β-coefficient, mm change/y | 95% CI | |
|---|---|---|
| D-dimer, linear, 500 ng/mL | 0.21 | 0.09, 0.33 |
| TAT, linear, 1 μg/mL | 0.24 | 0.19, 0.29 |
| Cardiovascular disease | ||
| No | 1.00 | (referent) |
| Yes | −0.61 | −1.13, −0.09 |
| Diabetes | ||
| No | 1.00 | (referent) |
| Yes | −0.47 | −0.99, 0.05 |
Discussion
Although AAA is established as a cause of deranged hemostasis, the utility of hemostatic biomarkers in AAA diagnosis and prognosis is unclear. Currently, ultrasound is the gold standard for diagnosis and surveillance of AAAs with high sensitivity and specificity.4,27 However, the frequency of ultrasound surveillance varies with aneurysm diameter and is not recommended for patients with subaneurysmal dilations of the aorta.5,28 As such, circulating biomarkers of hemostasis, which reflect aneurysm thrombus size and remodeling, could play a role in the detection and prognosis of AAA progression.1,11 In this study, we examined the associations between plasma markers of ongoing coagulation, fibrinolysis, and platelet activation with aneurysm size and growth rate in patients with AAAs and subaneurysmal dilations.
A number of previous studies have identified markers associated with AAA presence and growth.29,30 Many of these studies have, however, been restricted in their findings due to small sample sizes, limited surveillance of AAA growth, or limited analyses carried out. This population-based study found significant positive associations between circulating biomarkers of coagulation (TAT) and fibrinolysis (D-dimer) with the presence of both AAAs and SAAs. Individuals with subaneurysms, slow-growing AAAs, or fast-growing AAAs had 3.09, 6.23, and 7.19 times the odds, respectively, of having a D-dimer level ≥500 ng/mL than controls. However, no distinct differences in the association between D-dimer concentration and risk between fast and slow-growing aneurysms were noted. In contrast, multivariable analysis showed plasma TAT concentrations were significantly different between slow-growing and fast-growing AAAs groups. These associations add to the mounting evidence implicating D-dimer as a potentially useful biomarker in the diagnosis of AAA. Prior studies by Parry et al have suggested that plasma TAT complex and D-dimer levels could be strong markers for early aneurysm disease as both markers correlate well with aneurysm diameter.20 Similar to our findings, Golledge and colleagues previously reported ORs of 12 for AAA incidence in patients with D-dimer concentrations >400 ng/mL.25 Interestingly, although plasma PF4 levels are significantly elevated in AAA patients, this marker of platelet activation is not highly associated with aneurysm prevalence. High variability in serum PF4 levels occur due to sample processing or in patients with heparin-induced thrombocytopenia, which may influence the findings in our AAA cohort.31,32 However, anticoagulation therapy is an exclusion criterion for our study, and all samples were collected and processed at the same center with a standard operating procedure, making processing errors unlikely. Nonetheless, these findings do verify a state of activated coagulation in patients with nonruptured aortic aneurysms.23,33
Given that the natural history of an AAA is to gradually expand and rupture, there is a crucial need to identify and stratify patients according to risk of rupture.13 However, evidence shows that AAA growth can occur transiently and is highly variable between patients.27,34,35 In most AAA patients, progressive aortic dilatation is associated with the formation of a nonocclusive ILT, and plasma TAT and D-dimer concentrations are thought to reflect ongoing ILT remodeling within an AAA.21,36 As such, D-dimer and/or TAT levels may be able to offer substantial prognostic information about the rate of aortic dilation.26,34 The prognostic value of plasma D-dimer has been recently studied by multiple groups, which revealed that increasing D-dimer concentration is also highly associated with AAA growth rate.25,26 Although we did not observe a significant difference in D-dimer concentration between patients classified as having fast (≥2 mm/y) or slow-growing (≤2 mm/y) AAAs, multivariable analysis revealed that linear increases in plasma D-dimer and TAT complex were the strongest independent predictors of AAA growth rate. Our results indicate that rising levels of plasma TAT, in addition to D-dimer, could be clinically useful markers of AAA progression. The utility of plasma TAT for identifying patients at increased risk of coronary artery disease has been proposed.37 However, to our knowledge the meaningful relationship between AAA progression and increasing plasma TAT concentration has not been reported. However, the prognostic value of elevated D-dimer and TAT concentrations as predictors of AAA progression needs to be addressed further in prospective clinical trials.
A secondary aim of the study was to assess associations between changes in hemostatic markers and patients with subaneurysmal aortic dilatation. Currently, surveillance of subaneurysmal aortic dilatation is not recommended even though most dilations will progress to AAA size.5,12 Recent studies by Vele et al reported elevations in plasma D-dimer in patients with subaneurysmal aortic dilatation compared with control subjects with a normal diameter of the abdominal aorta.26 In this study, we also observed significant elevations in plasma TAT and D-dimer in patients with SAA. Of note, plasma levels of both of these biomarkers were also significantly less than AAA patients, indicating a possible spectrum of deranged hemostasis as the aorta dilates. It has been proposed that elevations in D-dimer or TAT may reflect the presence of microthrombi in the wall of the aorta at the onset of dilation.26 However, it is still unclear how such microthrombi contribute to disease progression and eventual aneurysm formation. Therefore, future studies investigating the early pathology of aortic dilation are needed to understand whether hemostatic markers correlate with future aortic behavior.
Our study has a number of strengths and weaknesses. A major strength is the population-based design and relatively large sample size of slow- and fast-growing aneurysms and SAAs compared with prior investigations of circulating biomarkers and AAA progression. In addition, we also assessed for alterations along the entire spectrum of hemostasis, including platelet activation, coagulation, and fibrinolysis, which has not been reported in regards to AAA or subaneurysmal expansion. Conversely, limitations of the present work include the lack of a validation cohort and longitudinal assessment of biomarker levels in each study group as well as adequate numbers of female patients. There are additional markers of platelet activation and coagulation that have been identified as potential surrogates for AAA that were not investigated.20 We also did not exclude other causes of elevated plasma D-dimer or TAT, such as deep venous thrombosis, malignancy, or other aneurysms because these data were not recorded. Similarly, other medications in addition to ASA and statins examined in our studies may influence biomarker levels in the AAA population. As such, further longitudinal, prospective trials investigating the use of D-dimer or TAT as surrogate markers of AAA progression are warranted.
In conclusion, this study shows that plasma D-dimer and TAT not only are correlated with AAA progression but also may be useful in distinguishing fast- and slow-growing aneurysms. Furthermore, elevations in plasma D-dimer or TAT in patients with subaneurysmal dilations could signify ongoing thrombus formation and possibly warrant further surveillance for expansion. Therefore, plasma D-dimer and TAT could serve as a valuable tool in monitoring AAA progression along with imaging surveillance and modification of clinical risk factors.
The full-text version of this article contains a data supplement.
Acknowledgments
This work is supported by National Institutes of Health, National Heart, Lung, and Blood Institute grants 5R00-HL116786-06 and 1R01-HL141401-01 (A.P.O.), a T32 grant GM07347 (A.C.S.) from the National Institute of General Medical Sciences supporting Vanderbilt Medical Scientists, the Swedish Research Council grants K2013-64X-20406-07-3 and K2013-99X-22275-01-3, the Swedish Heart-Lung Foundation grants 2012-0353 and 2015-0596 (A.W. and M.B.), and the Konung Gustaf V:s och Drottning Victorias Frimurarestiftelse (A.W.).
Authorship
Contribution: A.C.S. and T.L.E. conducted all statistical analyses for the publication; K.S. and A.P.O. conducted all ELISAs for the publication; K.M., M.B., and A.W. collected and provided all human samples for the study; K.S., K.A.C., and H.M.R. organized and aliquotted all samples for ELISAs; and all authors contributed to writing and proofreading the manuscript.
Conflict-of-interest disclosure: The authors declare no competing financial interests.
Correspondence: A. Phillip Owens III, Division of Cardiovascular Health and Disease, University of Cincinnati College of Medicine, 231 Albert Sabin Way, CVC Building 3976, Mail Location 0542, Cincinnati, OH 45267; e-mail: owens2at@ucmail.uc.edu.

