

Key Points
Sickle cell disease, α-thalassemia trait, and G6PD deficiency are common among Malawian children <5 years of age.
These inherited blood disorders likely contribute to the severity of both anemia and malaria.

Abstract
In sub-Saharan Africa, inherited causes of anemia are common, but data are limited regarding the geographical prevalence and coinheritance of these conditions and their overall contributions to childhood anemia. To address these questions in Malawi, we performed a secondary analysis of the 2015-2016 Malawi Micronutrient Survey, a nationally and regionally representative survey that estimated the prevalence of micronutrient deficiencies and evaluated both inherited and noninherited determinants of anemia. Children age 6 to 59 months were sampled from 105 clusters within the 2015-2016 Malawi Demographic Health Survey. Hemoglobin, ferritin, retinol binding protein, malaria, and inflammatory biomarkers were measured from venous blood. Molecular studies were performed using dried blood spots to determine the presence of sickle cell disease or trait, α-thalassemia trait, and glucose-6-phosphate dehydrogenase (G6PD) deficiency. Of 1279 eligible children, 1071 were included in the final analysis. Anemia, iron deficiency, and malaria were common, affecting 30.9%, 21.5%, and 27.8% of the participating children, respectively. α-Thalassemia trait was common (>40% of children demonstrating deletion of 1 [33.1%] or 2 [10.0%] α-globin genes) and associated with higher prevalence of anemia (P < .001). Approximately 20% of males had G6PD deficiency, which was associated with a 1.0 g/dL protection in hemoglobin decline during malaria infection (P = .02). These data document that inherited blood disorders are common and likely play an important role in the prevalence of anemia and malaria in Malawian children.
Introduction
Inherited hematological disorders are highly prevalent across Africa, primarily because of the tremendous selective pressure from malaria-causing Plasmodium parasites.1-4 Following the initial hypothesis by Haldane,5 the protective effect of various inherited hematological polymorphisms and mutations against severe malaria have been characterized, including hemoglobin sickle (HbS),6-10 HbC,11,12 HbE,13-15 both α-16-18 and β-thalassemia,19-22 and glucose-6-phosphate dehydrogenase (G6PD) deficiency.23-25 In the heterozygous carrier state (trait), these genetic changes are beneficial, providing protection against the deadly consequences of severe malaria. However, in the homozygous disease state, these conditions result in a wide spectrum of laboratory and clinical sequelae, including severe anemia and early mortality.26-28
The geographical distribution of inherited blood disorders across sub-Saharan Africa is well-recognized,29-32 but the prevalence and distribution within individual countries is much less appreciated, limited by poor availability of published data. In contrast, the burden of anemia in Africa and the associated morbidity and mortality is well-described.33,34 Although nutritional deficiencies and infections (malaria, HIV, and parasitic infections) are considered the most common global causes of anemia,35-40 the contribution of inherited blood disorders to the burden of anemia in the malaria-endemic regions of sub-Saharan Africa has not been extensively described at the national level, particularly in Malawi.41-45
A widely referenced study from Malawi demonstrated the multifactorial etiology of severe anemia in children, including malaria, hookworm, HIV, G6PD deficiency, and several nutritional deficiencies.44 Perhaps because of its geographical position in southeastern Africa, Malawi is often overlooked as a country with a high burden of sickle cell anemia and other inherited blood disorders, but given the endemicity of malaria, we hypothesized that there is likely a high frequency of inherited hematological disorders that have evolved because of their relative protection against severe malaria, including the HbS mutation, α-globin gene deletions, and G6PD deficiency. In conjunction with the 2015-2016 Malawi Demographic and Health Survey (MDHS), the Malawi Micronutrient Survey (MNS) collected information on the genetic burden of inherited blood disorders. Our objective was to describe the prevalence and distribution of inherited blood disorders among young children in Malawi and explore their associations with malaria and anemia.
Methods
MDHS survey overview and sampling strategy
The Government of Malawi National Statistical Office and Community Health Science Unit implemented the MDHS between October 2015 and February 2016. ICF International, the Centers for Disease Control and Prevention, and Emory University provided technical assistance for the MNS. The primary objective of the 2015-2016 MNS was to estimate the prevalence of anemia, micronutrient deficiencies (iron, vitamin A), inflammation, infection (malaria, urinary schistosomiasis), and inherited blood disorders (sickle cell trait/disease, α-thalassemia trait, G6PD deficiency) in addition to measuring growth and estimating the prevalence of undernutrition.46
The MDHS was a large, cross-sectional survey designed to provide estimates for key demographic and health indicators for the country as a whole, for urban and rural areas separately, and for each of the 28 districts in Malawi. The MNS was designed to produce national and regional estimates of micronutrient status and other biomarkers. From the 850 clusters included in the MDHS, 105 (35 per region: North, Central, South) were randomly selected for the MNS. Within clusters, households were randomly sampled (22 in rural clusters, 20 in urban clusters) and all children 6 to 59 months of age in the household were invited to participate.
Ethical considerations
The National Health Sciences Research Committee in Malawi granted ethical approval for the MDHS and MNS surveys, which were designed to minimize participant risk. Community leaders granted consent of survey activities. Caregivers gave consent for survey participation of children 6 to 59 months of age. If clinically important results were determined at the point of data collection (severe anemia, positive malaria test, evidence of malnutrition, hematuria), the child was referred to receive care at a local health center.
Survey administration and sample collection, storage, and transport
The MDHS teams collected survey data electronically using tablet computers; the MNS teams collected data on paper case report forms that were translated to local languages. Upon arrival to each cluster, the MNS team set up a mobile laboratory to facilitate assessment of anthropometry and venous blood collection. Within households that had consented to participate in the survey, children aged 6 to 59 months were escorted to the mobile laboratory, where informed consent was obtained from the caregivers. Length or height and weight were measured using wooden length boards (ShorrBoard, Weigh and Measure, LLC, Olney, MD) and electronic mother/infant scales (Seca GmbH & Co. KG, Hamburg, Germany), respectively. Recumbent length was measured for children <24 months old; standing height was measured in children 24 to 59 months old. Children had minimal clothing (light fabric and diaper were acceptable) and were not wearing shoes when weight was measured.
Whole blood was collected by venipuncture in an EDTA vacutainer tube (Becton, Dickinson and Company, Franklin Lakes, NY), to test for malaria using a rapid diagnostic test (SD BIOLINE Malaria Plasmodium falciparum [HRP2], Alere, Inc., Waltham, MA) and to measure hemoglobin concentration using the HemoCue 301 (Hemocue America, Brea, CA). Parents additionally provided self-report of whether the child had malaria infection within the past 2 weeks. In addition, 100 µL of whole blood was spotted onto filter paper and dried to create 2 dried blood spots (DBSs, Whatman 903 Protein Saver Cards, GE Healthcare, Pittsburgh, PA). One DBS was used for hemoglobin electrophoresis to determine sickle status locally and the second DBS was sent to the United States to test for the presence of sickle cell disease or trait, α-thalassemia trait, and G6PD deficiency. Centrifuged serum, plasma, and DBS specimens were maintained on a cold chain. Biomarkers of iron (ferritin), vitamin A (retinol binding protein), and inflammation (C-reactive protein [CRP], α-1-acid glycoprotein [AGP]) were measured in serum using sandwich ELISA (VitMin Laboratory, Germany).47
Preparing DNA from DBS
Upon receipt at the Cincinnati Children’s Hospital Medical Center, DBS samples were inventoried, DNA was extracted, and genotyping studies were performed. Two 3-mm punches were made from each DBS to obtain genomic DNA following the InstaGene Matrix protocol (BioRad, Hercules, CA) with the following modification; 65 µL of Instagene was used to bind DNA and only 50 µL was collected following the final centrifugation step. All polymerase chain reactions (PCRs) used 1 or 2 µL of DNA rich supernatant.
Determination of inherited blood disorders
Sickle cell status.
Amplification of the β-globin gene was performed using forward (5′-TGC TTA CCA AGC TGT GAT TCC-3) and reverse (5′-CTT CCT ATG ACA TGA ACT TAA CCA-3′) primers. Hb S mutation (Glu6Val) was evaluated by a custom TaqMan probe (RT-PCR) designed for the HbS (sickle, rs334) polymorphism. For this reaction, 0.2 μL of PCR product was added to 6 μL 2x Genotyping master mix, 0.6 μL 20× probe mix (Probe set AHFA70S; forward 5′- AGC AAC CTC AAA CAG ACA CCA T-3′, reverse 5′-CCC CAC AGG GCA GTA ACG-3′, Vic 5′-CTG ACT CCT GAG GAG AA-3′, FAM 5′-CTG ACT CCT GTG GAG AA-3′), and water according to the manufacturers’ recommendation (Applied Biosystems Foster City, CA). Figure 1A illustrates the clear allelic discrimination of the 3 sickle genotypes: normal hemoglobin (HbAA), sickle cell trait (HbAS), and sickle cell disease (HbSS).
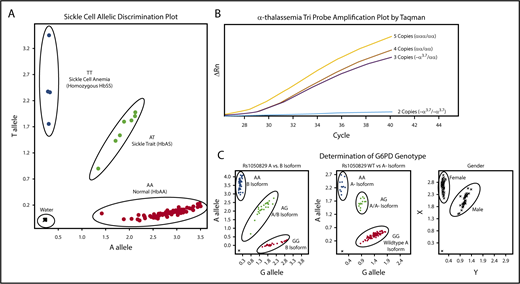
Molecular determination of sickle cell, α-thalassemia, and G6PD status. Each panel represents example allelic discrimination (A,C) or probe amplification (B) plots for the reverse transcriptase-PCR assays used to determine each blood disorder. (A) Molecular determination of the presence of absence of the HbS mutation. (B) Probe amplification plots by α-globin genotype, demonstrating later probe amplification with each α-globin gene deletion. (C) Allelic discrimination plot to determine G6PD A vs B isoforms, the presence or absence of the A− isoform, and a confirmatory sex assay to identify male and female samples.
Molecular determination of sickle cell, α-thalassemia, and G6PD status. Each panel represents example allelic discrimination (A,C) or probe amplification (B) plots for the reverse transcriptase-PCR assays used to determine each blood disorder. (A) Molecular determination of the presence of absence of the HbS mutation. (B) Probe amplification plots by α-globin genotype, demonstrating later probe amplification with each α-globin gene deletion. (C) Allelic discrimination plot to determine G6PD A vs B isoforms, the presence or absence of the A− isoform, and a confirmatory sex assay to identify male and female samples.
α-Thalassemia status.
For the detection of α-thalassemia trait (single or 2-gene deletions), the 3.7-kb α-globin gene deletion (−α3.7) was scored using a copy-number variant TaqMan assay with custom TaqMan probes, as previously described.48 Each sample was amplified in triplicate to determine average relative quantification (RQ) or copy number score. Each assay included an internal coamplified control to assess the DNA quality. RQ values corresponding to copy number variation cells were used as follows: 2 α-globin genes/2 α-globin gene deletions (−α3.7/−α3.7), 0.00 to 0.20; 3 α-globin genes/1 α-globin gene deletion (−α3.7/αα), 0.40 to 0.70; 4 α-globin genes/no α-globin gene deletions (αα/αα), 0.75 to 1.35; and 5 α-globin genes (α-globin gene triplication), 1.5 to 2.0. Samples that fell outside of these defined ranges were repeated. In the rare instance (<2% of samples) in which a single RQ value of the triplicate was incongruous with the others, this value was eliminated and not used in the final determination. A final α-thalassemia status was not determined for 3 samples only (0.2% of total samples) because of presumed poor DNA quality with poor amplification of the internal coamplified control or copy number scores repeatedly falling outside of the defined ranges. Controls for each experiment included DNA from DBS samples with known α-thalassemia status; additionally, a negative water control was included. Figure 1B illustrates the distinction in amplification plots among the 4 possible α-thalassemia results.
G6PD deficiency.
The common G6PD A− variant was identified using 3 commercially available TaqMan probe sets (Applied Biosystems Foster City, CA); A376G (rs1050829) distinguished A and B isoforms, G202A (rs1050828) identified the A− variant, and sex was scored using SRY_VIC and ABCD1_CCHS0H-FAM for Y and X chromosomes, respectively. Each assay included positive and negative controls, with random sample duplicates. Figure 1C illustrates exemplary laboratory results for the 3 assays used to determine G6PD status.
Local laboratory determination of sickle status
Hemoglobin electrophoresis was performed on the DBS as a local diagnostic to supplement the molecular tests and develop further capacity for a local sickle cell laboratory at Kamuzu Central Hospital in Lilongwe, Malawi.49 The DBS was cut in half and eluted in 100 µL of hemolysate solution to extract hemoglobin before electrophoresis. Hemoglobin pattern was determined by hemoglobin electrophoresis using a Quickgel Chamber system and Titan Plus power source (both from Helena Laboratories, Beaumont, TX). Hemoglobin pattern was determined visually by inspecting for the presence of normal and abnormal hemoglobin bands. Helena AFSC Control was used as a marker for band identification.
Statistical analyses
All statistical analyses accounted for complex survey variables (cluster, strata, weight) and were performed using SAS, version 9.4 (Cary, NC). Prevalence of genetic blood disorders were compared with malarial infection (as defined by rapid diagnostic test, binary variable) and anemia severity (ordinal variable) using the Rao-Scott modified χ2 test. Genetic blood disorder prevalence and hemoglobin concentration (continuous) were compared using generalized estimating equations to account for correlation at the cluster level. To assess patterns of anemia without an identifiable cause, a subset of children with no evidence of malaria (by rapid test), inflammation (CRP ≤5 mg/L. AGP ≤1 g/L), or iron deficiency as defined by a normal inflammation-adjusted iron status (ferritin ≥12 µg/L) were analyzed separately (n = 300).
Ferritin was adjusted for inflammation using the Biomarkers Reflecting Inflammation and Nutritional Determinants of Anemia internal (country-specific) regression method, accounting for CRP and AGP.50 Inflammation-adjusted iron deficiency was defined as serum ferritin <12 µg/L. Anthropometry data were analyzed using World Health Organization child growth standards to calculate z scores.
Local prevalence of the HbS allele (HbAS or HbSS) in contrast to the normal condition HbAA was mapped on the basis of a generalized linear mixed model.51 Model parameters were estimated by maximum likelihood, and prevalence was the mapped at the nodes of a 1-km2 grid across Malawi using the Prevmap package for the R platform.52 The prevalence predictions were then visualized using ArcGIS (v10.3.1, ESRI, Redlands, CA). The generalized linear mixed model were also fitted to the data on α-thalassemia and G6PD deficiency, but in both cases the evidence for spatial correlation was very weak, and so no attempt was made to map prevalence.
Results
Survey response rate and participant characteristics
The MNS was designed to target a sample size of 1500 preschool children to detect a reduction in the prevalence of vitamin A deficiency from 22% in 2009 to 15% in 2015-2016. A total of 1279 eligible participants were invited, 1233 (96%) agreed to participate, and DBS were collected from 92.9% (1136/1223) of children for genotyping studies. An additional 61 children were excluded because they did not participate in venipuncture blood draw, making inflammation and iron status unavailable, and 4 children were missing hemoglobin data, which led to 1071 children included in the final analysis. The dataset was a geographically representative sample from the Northern (n = 374), Central (n = 408), and Southern regions (n = 289) of Malawi. Samples were collected from 27 of the 28 districts of Malawi, with the only unrepresented district being the exclave district of Likoma Island, located in Lake Malawi. The mean age of participating children was 32.5 months; gender was balanced, 30.9% were anemic, and 21.5% were iron deficient (Table 1). The presence of any evidence of inflammation (either elevated CRP or AGP) was common (56.6%) among children. The prevalence of stunting and underweight was 35.1% and 18.4%, respectively (Table 1).
Characteristics of children aged 6 to 59 mo, 2015-2016 Malawi MNS
| Mean (95% CI) | N | |
|---|---|---|
| Male sex, % | 51.3 (48.1-54.5) | 530 |
| Age, mo | 32.5 (30.9-34.2) | 1071 |
| Region, % | ||
| North | 13.7 (7.0-20.4) | 374 |
| Central | 47.1 (33.5-60.6) | 408 |
| South | 39.2 (26.1-52.3) | 289 |
| Rural residence | 89.4 (78.3-100.0) | 948 |
| Wealth quintile, % | ||
| Lowest | 26.8 (21.3-32.3) | 249 |
| Low | 22.5 (18.9-26.1) | 215 |
| Middle | 23.0 (18.9-27.0) | 246 |
| High | 17.5 (14.1-21.0) | 203 |
| Highest | 10.2 (5.1-15.2) | 157 |
| Household ITN use, % | 66.2 (60.8-71.6) | 739 |
| Fever in last 24 h, % | 11.9 (9.1-14.7) | 136 |
| Hb, g/dL | 11.5 (11.4-11.6) | 1071 |
| Any anemia (Hb <11.0 g/L), % | 30.9 (27.3-34.5) | 335 |
| Mild* | 18.0 (15.3-20.6) | 191 |
| Moderate† | 12.1 (9.0-15.2) | 135 |
| Severe‡ | 0.9 (0.0-1.8) | 9 |
| Iron deficiency, %§ | 21.5 (15.7-27.3) | 207 |
| Iron deficiency anemia, %§ | 9.2 (6.1-12.4) | 92 |
| Vitamin A deficiency, %§ | 3.7 (1.7-5.8) | 39 |
| (+) Malaria (rapid test), % | 27.8 (20.2-35.4) | 283 |
| (+) Malaria (self-report last 2 wk), % | 19.5 (14.8-24.2) | 226 |
| Any inflammation (CRP >5 mg/L; AGP >1 g/L), % | 56.6 (51.6- 61.7) | 604 |
| Stunted (HAZ <−2), % | 35.1 (31.0-39.1) | 355 |
| Wasted (WHZ <−2), % | 4.3 (2.8-5.9) | 41 |
| Underweight (WAZ <−2), % | 18.4 (14.6-22.3) | 155 |
Data are weighted to account for survey design.
CI, confidence interval; ITN, insecticide-treated nets; HAZ, height-for-age z score; WAZ, weight-for-age z score; WHZ, weight-for-height z score.
Hb 10.0-10.9 g/L.
Hb 7.0-9.9 g/L.
Hb <7.0 g/L.
Iron deficiency defined as inflammation-adjusted ferritin <12 µg/L; iron deficiency anemia defined as intraindividual anemia (Hb <11 g/L) and iron deficiency; vitamin A deficiency defined as retinol binding protein <0.46 µmol/L.
Sickle cell status
HbAS was found in 105 children (weighted percentage, 9.1%) (Table 2). Homozygous HbSS was found in only a single child. The HbS allele frequency was 0.05. Children with a HbAA pattern did not have a significantly higher prevalence of malaria (by positive rapid diagnostic test), compared with children with HbAS (28.5% vs 20.5%, P = .22). Geographically, HbAS was more prevalent in the Central region (12.5%) than in the Northern (11.5%) and Southern regions (3.8%) (data not shown). This distribution did not align with the relative prevalence of malaria infection by rapid diagnostic testing (Northern = 20.6%, Central = 30.9%, Southern = 28.3%) or self-report of recent infection (Northern = 20.4%, Central 18.9%, Southern = 26.1%).
Prevalence of malaria and anemia severity by blood disorder among children 6 to 59 mo, Malawi 2016 (n = 1071)
| Blood disorder | Anemia | Overall prevalence | |||
|---|---|---|---|---|---|
| (+) Malaria | None | Mild | Moderate or severe | ||
| Sickle cell status, % (95% CI) | |||||
| Normal | 28.5 (20.5-36.5) | 69.0 (64.9-73.0) | 18.0 (15.2-20.8) | 13.0 (9.6-16.5) | 90.9 (87.9-93.9) |
| Sickle cell trait | 20.5 (7.6-33.4) | 70.3 (59.4-81.3) | 17.4 (7.8-26.9) | 12.3 (2.5-22.1) | 9.1 (6.1-12.0) |
| Sickle cell anemia | — | — | — | 100 (100-100) | 0.04 (0.0-0.1) |
| α-Thalassemia genotype, % (95% CI) | |||||
| αα/αα | 29.5 (21.3-37.7) | 72.2 (67.7-76.7)* | 15.1 (11.8, 18.3)* | 12.8 (9.5-16.0)* | 56.9 (51.4-62.3) |
| −α3.7/αα | 26.0 (17.1-34.8) | 70.2 (64.2-76.3)* | 16.2 (11.0, 21.4)* | 13.6 (4.2-22.5)* | 33.1 (28.4-37.9) |
| −α3.7/−α3.7 | 26.5 (14.5-38.5) | 44.7 (31.1-58.2)* | 42.0 (26.8-57.1)* | 13.3 (4.2-22.5)* | 10.0 (7.7-12.2) |
| G6PD genotype: males, % (95% CI) | |||||
| Normal | 31.4 (23.2-39.6) | 64.8 (59.4-70.1) | 18.8 (14.4-23.3) | 16.4 (11.8-20.9) | 79.8 (75.0-84.6) |
| G6PD deficient | 26.9 (9.4-44.4) | 75.5 (65.1-86.0) | 13.3 (6.4-20.2) | 11.2 (3.9-18.4) | 20.2 (15.4-25.0) |
| G6PD genotype: females, % (95% CI) | |||||
| Normal | 26.5 (19.6-33.4) | 68.0 (63.3-76.7) | 18.0 (13.1-23.2) | 13.1 (7.3-16.4) | 62.8 (57.8-67.9) |
| Carriers | 22.5 (10.5-34.6) | 72.4 (64.4-80.5) | 18.2 (10.3-26.0) | 9.4 (3.9-14.9) | 34.6 (30.0-39.2) |
| G6PD deficient | 33.4 (0.0-70.8) | 77.2 (53.0-100.0) | 19.6 (0.0-42.2) | 3.2 (0.0-9.8) | 2.6 (0.8-4.4) |
| Overall, % (95% CI) | 27.8 (20.2-35.4) | 69.1 (65.5-72.7) | 18.0 (15.3-20.6) | 13.0 (9.8-16.2) | |
Data are weighted to account for complex survey design. Malaria determined by rapid diagnostic test.
—, no observations.
Distribution of anemia severity differs by α-thalassemia genotype (P = .0003) using the Rao-Scott modified χ2 test.
Comparison of molecular and electrophoresis results
Molecular determination of sickle status was performed on 1137 samples; hemoglobin electrophoresis was performed on 1111 samples in separate locations. When comparing the 1108 samples with results using both methods, there was excellent agreement (κ = 0.86; 95% confidence interval, 0.82-0.91) with concordant results for 1080/1108 (97.5%) of samples. There were 20 samples called HbAA by the molecular technique but called HbAS by hemoglobin electrophoresis, and 8 samples called HbAS by molecular techniques but called HbAA by hemoglobin electrophoresis. The 1 child with presumed HbSS was diagnosed by both methods. The sensitivity and specificity of the electrophoresis technique for the detection of HbS (including both HbAS and HbSS) was 93% and 98%, respectively.
α-Thalassemia status
α-Thalassemia was the most common inherited blood disorder detected. More than 2 of 5 children had either 1 (33.1%) or 2 (10.0%) α-globin gene deletions, consistent with the diagnosis of α-thalassemia trait. Consistent with the frequency of the trans-type α-thalassemia deletion in sub-Saharan Africa (−α3.7), there were no samples with 3 α-globin gene deletions. Two gene deletion α-thalassemia (−α3.7/−α3.7) was more common in the Southern region (13.6%) than the Central (8.3%) or Northern (5.1%) region (P = .008) (data not shown). Each gene deletion was associated with a decrease in hemoglobin concentration that was seen for children with and without evidence of malaria infection (Table 3). Children without any deletions (αα/αα) had significantly higher mean hemoglobin concentrations than those with 1 (−α3.7/αα) or 2 (−α3.7/−α3.7) gene deletions (11.5 vs 11.3 and 10.9 g/dL, respectively; P < .001). The prevalence of malaria diagnosed by rapid diagnostic test or by maternal self-report did not differ by α-thalassemia status (Table 2).
Mean Hb concentrations according to blood disorder stratified by malaria among children 6 to 59 mo, Malawi 2016
| Blood disorder | Prevalence, % | Mean Hb, g/dL* | Difference in Hb, g/dL† | |
|---|---|---|---|---|
| (−) Malaria | (+) Malaria | |||
| Sickle cell status | ||||
| Normal | 90.9 | 11.7 (11.6-11.9) | 10.5 (10.2-10.8) | −1.2 |
| Sickle cell trait | 9.1 | 11.7 (11.4-12.0) | 10.7 (10.1-11.4) | −1.1 |
| Sickle cell anemia | <0.1 | 6.7 | — | — |
| P | .84 | .47 | .45 | |
| α-thalassemia genotype | ||||
| Normal (αα/αα) | 56.9 | 11.9 (11.7-12.0) | 10.7 (10.3-11.0) | −1.2 |
| Heterozygous (−α3.7/αα) | 33.1 | 11.6 (11.4-11.9) | 10.5 (10.0-11.0) | −1.3 |
| Homozygous (−α3.7/−α3.7) | 10.0 | 11.0 (10.7-11.3) | 10.3 (9.7-10.8) | −0.7 |
| P | <.0001 | .28 | .10 | |
| G6PD genotype: males | ||||
| Normal | 79.1 | 11.7 (11.5-11.8) | 10.4 (10.2-10.7) | −1.3 |
| G6PD deficient | 19.6 | 11.3 (10.8-11.8) | 11.0 (10.5-11.6) | −0.3 |
| P | .56 | .12 | .02 | |
| G6PD genotype: females | ||||
| Normal | 63.3 | 11.8 (11.7-12.0) | 10.2 (9.6-10.9) | −1.6 |
| Carriers | 33.7 | 11.8 (11.6-12.1) | 11.0 (10.2-11.9) | −0.8 |
| G6PD deficient | 3.0 | 11.5 (11.0-12.0) | 11.2 (9.1-13.3) | −0.3 |
| P | .14 | .045 | .08 | |
All estimates account for cluster, strata, and weighting; malaria stratification by rapid diagnostic test result.
Difference in mean Hb by genotype modeled using linear regression with generalized estimating equations.
Interaction P value signifies if there is a difference in mean Hb across malaria status between genotypes.
We performed a subgroup analysis excluding children with notable causes of anemia (malaria, inflammation, or iron deficiency) to assess patterns of residual anemia (n = 300). The association between α-thalassemia trait and anemia was evident in this subgroup. Children with the normal αα/αα genotype had a significantly higher (P < .01) mean hemoglobin concentration (12.4 g/dL) and lower prevalence of anemia (5.6%) than children with 1 (Hb = 11.8 g/dL, 9.4% prevalence of anemia) or 2 (Hb = 11.0 g/dL, 67.5% prevalence of anemia) α-globin gene deletions (Table 4).
Residual anemia and mean Hb by thalassemia, Malawi 2016 (n = 300)
| Anemia, % | Normal (αα/αα) (n = 178) | Heterozygote (−α/αα) (n = 97) | Homozygote (−α/−α) (n = 25) | P |
|---|---|---|---|---|
| None (Hb ≥11.0 g/L) | 94.4 (90.7-98.1) | 90.6 (82.4-98.7) | 32.5 (2.2-62.9) | .0001 |
| Mild (Hb 10.0-10.9 g/L) | 4.8 (1.8-1.3) | 7.4 (3.6-0.2) | 66.2 (35.7-96.7) | |
| Moderate or severe (Hb <10.0 g/L) | 0.8 (0.0-2.2) | 2.1 (0.0-4.9) | 1.3 (0.0-3.9) | |
| Mean Hb (g/L) | 12.4 (12.2-12.5) | 11.8 (11.4-12.2) | 11.0 (10.7-11.3) | <.0001 |
Restricted to children with no inflammation, iron deficiency, or malaria (inflammation defined as CRP ≤5 mg/L and AGP ≤1 g/L; iron deficiency defined as inflammation-adjusted ferritin ≥12 µg/L; and malaria tested by rapid diagnostic test). Proportions compared using Rao-Scott modified χ2 test; mean concentrations compared using linear regression with generalized estimating equations to account for complex survey design.
G6PD status
G6PD deficiency was also commonly found, with 20% of boys found to be affected by hemizygotes and 34% of females found to be heterozygous carriers of the A− variant. The allele frequency for the A− variant was 0.20. There was a trend demonstrating decreased prevalence of malaria for both boys with G6PD deficiency (26.9% prevalence of malaria) and girls with G6PD trait (22.5% prevalence of malaria) compared with unaffected boys and girls (31.4% and 26.5% prevalence of malaria, respectively; P > .05, Table 2). There was a statistically significant difference in the hemoglobin concentration for boys with G6PD deficiency when analyzed according to recent malaria infection. Boys with G6PD deficiency and a positive malaria test had a significantly higher hemoglobin concentration (Hb = 11.0 g/dL) than boys without G6PD deficiency and a positive rapid malaria test (Hb = 10.4 g/dL), suggesting a possible protective effect of G6PD deficiency (P = .02). There was a similar trend toward protection against anemia for girls with G6PD deficiency or trait, but this was not statistically significant (P = .08).
Overlapping blood disorders: prevalence, distribution, and protection against malaria
Of the 1068 samples with results for all 3 inherited blood disorders, 650 (60.9%) had at least 1 abnormal result; 15 children were carriers of all 3 blood disorders. The study did not demonstrate any increased or decreased prevalence in malaria for children inheriting >1 blood disorder.
Geospatial distribution of inherited blood disorders
Samples were collected from children across all districts of Malawi. There was an increased prevalence of sickle cell trait and a decreased prevalence of G6PD deficiency in the Central compared with the Northern and Southern regions. The prevalence of α-thalassemia trait was highest in the Northern region and lowest in the Southern region. Figure 2 demonstrates geospatial distribution of the HbS allele with specific regions of Malawi suspected to have higher prevalence of HbS than others.
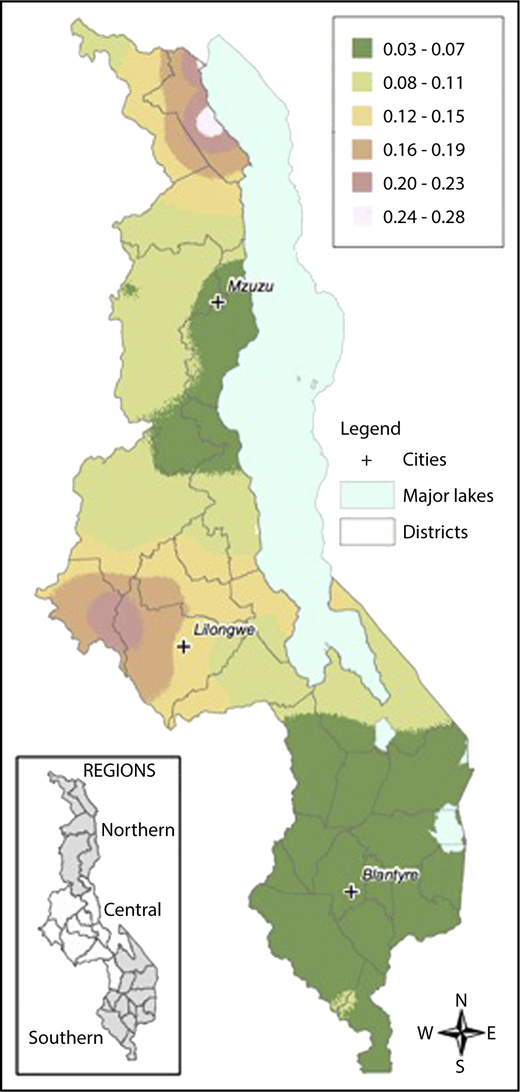
Geospatial distribution of HbS in Malawi. This map illustrates the differences in the geospatial distribution of HbS, with areas in the Northeast and West noted to have a higher prevalence of HbS than other areas of Malawi.
Geospatial distribution of HbS in Malawi. This map illustrates the differences in the geospatial distribution of HbS, with areas in the Northeast and West noted to have a higher prevalence of HbS than other areas of Malawi.
Discussion
Anemia is common in the limited resource settings of sub-Saharan Africa, including Malawi.34,44 It is typical for mild to moderate anemia to be considered commonplace without extensive efforts made to investigate the causes, clinical implications, or potential treatment options. As with fever, malaria is often assumed to be the primary cause of anemia by local providers, although this is certainly not always the case. Nutritional (primarily iron deficiency) and infectious etiologies (HIV, intestinal parasites) are the most widely recognized global causes of anemia,34-42 but these data demonstrate that inherited hematologic disorders are also common across Malawi, likely playing an important role in the distribution and severity of both anemia and malaria. Although only 1 child in the cohort was found to have sickle cell disease, this study documented that nearly 10% of children carry sickle cell trait. Given that there are no screening programs and most persons of childbearing age are not aware of their sickle status, each birth (assuming random mating across the country) would have an ∼0.83% chance of being at risk for having a child with sickle cell disease (9.1% × 9.1%). Because this is a recessive disorder, each child at risk has a 25% risk of sickle cell disease (ie, 0.207% of births). With a reported 638 900 births per year and an assumption of random mating,53 an estimated 1323 children are born in Malawi each year with sickle cell disease. These calculations are meant to be estimates and, given the survival advantage of sickle cell trait, there may be an even higher (than 9.1%) prevalence of sickle cell trait among adults of childbearing age. Without available early diagnosis or intervention, it is likely that many of these children born with sickle cell disease will die before the age of 5 years.26 Malawi was successful in accomplishing Millennium Development Goal 4 by reducing under-5 mortality from 189 per 1000 live births in 1990 to 71 in 2013,54 but still has room for improvement. To achieve the Sustainable Millennium Development Goal of eliminating all preventable deaths and reducing under-5 mortality to below 25 per 1000 live births, more attention to sickle cell disease, through facilitation of early diagnosis and access to important preventive care, will be an important step.
G6PD deficiency, although usually not associated with chronic anemia, is an important comorbidity that can lead to acute episodes of hemolysis triggered by infections or certain medications. Most notably, acute and severe hemolytic anemia can be triggered in G6PD deficiency through the use of common antibiotics and antimalarial medications, most notably sulfa antibiotics and primaquine.55-57 A study investigating anemia in Malawian children found G6PD to be among the few factors significantly associated with severe anemia.44 G6PD is also a well-described risk factor for severe neonatal hyperbilirubinemia, another important and treatable global health problem.58 Approximately 1 in 5 boys in Malawi are G6PD deficient and therefore at risk for both neonatal jaundice and severe hemolytic anemia if exposed to certain antimalarial or antibiotic medications. The World Health Organization has advocated for point-of-care G6PD testing to allow for the safe and appropriate use of antimalarial medications, with a number of point-of-care assays recently reported.59-62 It is thus important for health care providers and administrators in Malawi to be cognizant of the high prevalence of G6PD deficiency.
α-Thalassemia trait was common, affecting >40% of children; those with 2 gene deletions were significantly more likely to have anemia than those with 0 or 1 gene deletions. α-Thalassemia on its own commonly results in mild anemia, but in settings with additional risk factors for anemia, α-thalassemia status may result in more profound anemia from other causes. α-Thalassemia is also especially important to recognize in settings where iron deficiency is common because the 2 are often confused with each another resulting from the common laboratory finding of mild microcytic anemia. Knowing a child’s α-thalassemia status is an important consideration when evaluating and managing iron deficiency anemia. Although the data from this study did not support the protective effect of α-thalassemia trait against malaria or the potential negative epistasis when α-thalassemia and sickle cell trait are inherited together, a number of prior reports support these hypotheses.16-18,63
In addition to demonstrating the burden of inherited causes of anemia in this population, this study also importantly demonstrated the feasibility of using DBS to perform surveillance studies of these inherited blood disorders, which are common across sub-Saharan Africa. The frequencies and effect of these conditions are often not well-recognized within the countries where they are so prevalent, with most geographic epidemiologic data extrapolated from a few small studies. DBS are commonly collected for a variety of surveillance and diagnostic purposes and are often discarded after only a small portion of the sample is used for the intended purpose. In Uganda, DBS initially collected as part of an HIV surveillance program were repurposed to be tested for sickle cell status and resulted in the geospatial mapping of HbS across the country.64 Using the methods described here, similar strategies could be used to demonstrate the prevalence and geographical distribution of these important inherited hematologic disorders.
The study provides important novel data on the multifactorial etiologies of anemia among young children in Malawi, but it is not without limitations. The relatively small sample size may have under- or overestimated the prevalence of these inherited blood disorders in certain regions. The study did not attempt to exhaustively examine all causes of anemia and notably did not test for the presence of intestinal parasites or HIV. Of note, the 2009 Malawi MNS did test for the presence of intestinal parasites and found a low prevalence and no association with anemia.65 This could be the result of national deworming campaigns targeting children aged 6 months to 5 years of age. The diagnosis of malaria, primarily by rapid diagnostic test in this study, has limitations, but was the most practical test in the field, where microscopy was not available. The rapid test demonstrated a higher prevalence of malaria than parental self-report (Table 1) and is likely a more accurate measure of malaria infection, although not perfect.
In summary, this cross-sectional micronutrient study documents that anemia, nutritional deficiencies, and inherited erythrocyte disorders are common among young children in Malawi. It is important to evaluate and manage each of these and to recognize that they may occur simultaneously, with 1 condition often exacerbating another. These data should be informative for health leaders and providers in Malawi as they develop continued strategies to combat childhood anemia and malnutrition. Finally, these methods may also be used in other settings to document the burden of these important inherited and acquired conditions.
Presented in abstract form at the 58th annual meeting of the American Society of Hematology, San Diego, CA, 4 December 2016.
Acknowledgments
The study was supported by the Emory Global Health Institute (Combating Childhood Illness Seed Grant; principal investigator: P.S.S.). The overall Malawi Demographic Health Survey was funded by Irish Aid, World Bank, and UNICEF with technical assistance from the Centers for Disease Control and Prevention and Emory University. P.T.M. receives funding from the National Institutes of Health, National Heart, Lung, and Blood Institute (1K23HL128885).
The findings and conclusions in this article are those of the authors and do not necessarily represent the official position of the Centers for Disease Control and Prevention.
Authorship
Contribution: P.T.M., A.M.W., C.M., and P.S.S. designed and implemented the study, analyzed the data, and wrote the first draft of the manuscript; G.E., G.T., R.K., K.I.A., S.G., and N.S.K. supported, oversaw, and performed local laboratory analyses in Malawi; K.E.M., L.R., J.W., T.A.H., and R.E.W. developed and validated laboratory techniques for genetic validation and performed advanced laboratory testing, confirming the presence or absence of each inherited blood disorder; R.M.L. and E.L.A. performed geospatial analyses and develop associated map; and all authors contributed to writing, editing and approving the final manuscript.
Conflict-of-interest disclosure: The authors declare no competing financial interests.
Correspondence: Patrick T. McGann, Cincinnati Children's Hospital Medical Center, 3333 Burnet Ave, MLC 11027, Cincinnati, OH 45229; e-mail: patrick.mcgann@cchmc.org.

