

Key Points
α-Granule matrix decondensation, a progressive fusion-protein-dependent process, potentiates α-granule protein cargo release.
Release of α-granule cargo, by primary or sequential compound fusion, occurs predominantly through PM-anchored fusion pores.

Abstract
Platelet α-granule cargo release is fundamental to both hemostasis and thrombosis. Granule matrix hydration is a key regulated step in this process, yet its mechanism is poorly understood. In endothelial cells, there is evidence for 2 modes of cargo release: a jack-in-the-box mechanism of hydration-dependent protein phase transitions and an actin-driven granule constriction/extrusion mechanism. The third alternative considered is a prefusion, channel-mediated granule swelling, analogous to the membrane “ballooning” seen in procoagulant platelets. Using thrombin-stimulated platelets from a set of secretion-deficient, soluble N-ethylmaleimide factor attachment protein receptor (SNARE) mutant mice and various ultrastructural approaches, we tested predictions of these mechanisms to distinguish which best explains the α-granule release process. We found that the granule decondensation/hydration required for cargo expulsion was (1) blocked in fusion-protein-deficient platelets; (2) characterized by a fusion-dependent transition in granule size in contrast to a preswollen intermediate; (3) determined spatially with α-granules located close to the plasma membrane (PM) decondensing more readily; (4) propagated from the site of granule fusion; and (5) traced, in 3-dimensional space, to individual granule fusion events at the PM or less commonly at the canalicular system. In sum, the properties of α-granule decondensation/matrix hydration strongly indicate that α-granule cargo expulsion is likely by a jack-in-the-box mechanism rather than by gradual channel-regulated water influx or by a granule-constriction mechanism. These experiments, in providing a structural and mechanistic basis for cargo expulsion, should be informative in understanding the α-granule release reaction in the context of hemostasis and thrombosis.
Introduction
Upon detecting vascular lesions, platelets become activated and release components from at least 3 distinct storage compartments: α-granules, dense granules, and lysosomes (see reviews1-3 ). Granule release is a key process in hemostasis as the secreted components are important for hemostatic plug formation. Dense granules store and release small molecules such as adenosine diphosphate to provide a paracrine function for inducing further platelet activation.4,5 In contrast, α-granules serve as the major store for 100 to 200 different bioactive proteins that are released through exocytosis. Some are adhesion factors for hemostatic plug formation, and others act as cytokines or growth factors that affect cells adjacent to the damaged site (see reviews2,3 ). The α-granules are larger (>250 nm in width) and more abundant than dense granules.1,6 The concentration of proteins within the α-granule is high, and, by electron microscopy, the interior matrix is electron-dense relative to the cytosol.6 This appearance resembles the condensed, dehydrated matrix observed in other protein storage granules, such as the insulin-rich storage granules of the pancreatic islet cells,7 the digestive proenzyme-rich storage granules of pancreatic acinar cells,8 or the von Willebrand factor (VWF)–rich Weibel-Palade bodies (WPBs) of vascular endothelial cell.9 Within this α-granule matrix, proteins are zonally distributed with some proteins (eg, VWF), forming selectively self-associating oligomers,10,11 whereas others (eg, fibrinogen) are more generally distributed.12-14 Overall, these data suggest that the α-granule interior is structured as a condensed, poorly hydrated protein matrix, which must be dissolved (ie, decondensed) during the platelet release reaction.
Matrix decondensation provides an attractive process to explain significant aspects of the kinetic diversity that has been reported for α-granule cargo release.15-18 In in vitro experiments, α-granule fusion to the plasma membrane (PM; human or mouse platelets6,19 ), or in some cases to the canalicular system (CS; mouse platelets19 ), is via a short neck or a longer pipe that could restrict cargo efflux.6 Hence, platelet α-granule cargo is not expected to be released as a bolus, unlike the cargo of small synaptic vesicles that fuse with presynaptic membranes.20-22 Rather, it is proposed that the neck or pipe functions as a restrictor valve that may modify cargo release on the basis of either exit proximity, protein rehydration/solubilization rates, or both. Morphologically, this model is supported by recent evidence that the matrix decondensation process is completed only as the proteins emerge extracellularly from a neck/pipe.6 These properties of the α-granule release reaction and matrix decondensation provide a viable explanation for the comparatively slow release kinetics of α-granule proteins vs the fast release of small molecules, such as serotonin, from dense granules,23 thus providing a structural basis for kinetically ordered content release.18
The mechanisms for α-granule cargo expulsion remain poorly understood. For the WPBs, there is evidence for at least 2 mechanisms of cargo expulsion, depending on stimulus: a jack-in-the-box mechanism of hydration-dependent, protein phase transitions occurring during secretagogue-stimulated secretion,24,25 and an actin-driven granule constriction mechanism occurring during phorbol ester–stimulated secretion.26,27 A possible third mechanism is suggested by the aquaporin-1-channel–mediated membrane water influx that drives ballooning seen in procoagulant platelet formation.28 In this mechanism, granules might preswell, prior to fusion, because of water influx from the cytosol. Although actin’s role in WPB release has been well documented,9 its role in platelets has been controversial.29-32 We chose to directly test whether α-granule matrix expulsion meets the predictions of a jack-in-the-box mechanism or the proposed alternatives. We used soluble N-ethylmaleimide factor attachment protein receptor (SNARE)–deficient transgenic mice and various ultrastructural approaches to test 5 central predictions of a jack-in-the-box mechanism: (1) Any precursor-product relationship between condensed and decondensed α-granules should be blocked in granule fusion-defective platelets.33 (2) α-Granules, in stimulated mouse platelets, should exhibit an abrupt, quantal transition in size as granules decondense. (3) If granule fusion with the PM is the major route of water influx, then peripherally located α-granules should decondense first. (4) Granule fusion with the PM/CS or a decondensed α-granule (ie, sequential compound fusion) should lead to matrix hydration propagating from the site of membrane fusion. (5) Decondensed granules should be traceable to PM/CS fusion pores, be they single or compound fused granules. These experimental predictions were validated by our data indicating α-granule matrix expulsion in mouse platelets is most likely via a jack-in-the-box mechanism, rather than by gradual channel-regulated water influx and prefusion swelling or by granule constriction. These experiments provide a mechanistic basis for the expulsion of α-granule contents and should be informative to our understanding of the α-granule release reaction in the context of hemostasis and thrombosis.
Methods
See also supplemental Materials and methods.
Preparation of mouse platelets
Blood was collected by cardiac puncture and anticoagulated with 0.38% sodium citrate, 10 ng/mL prostaglandin I2, and 0.2 U/mL apyrase. Blood from 3 to 5 mice of mixed genders was pooled for each sample. Blood was diluted with N-2-hydroxyethylpiperazine-N′-2-ethanesulfonic acid (HEPES) Tyrode buffer (pH 7.4, 20 mM HEPES/KOH, 128 mM NaCl, 2.8 mM KCl, 1 mM MgCl2, 5 mM d-glucose, 12 mM NaHCO3, 0.4 mM NaH2PO4) in 1:1 ratio in presence of prostaglandin I2 and apyrase. Samples were then centrifuged to yield a platelet-rich plasma. The platelet-rich plasma was centrifuged, and the platelet pellets were resuspended in HEPES Tyrode buffer (pH 7.4) with 1 mM EGTA and centrifuged a final time to collect washed platelets. Platelet concentrations were measured using a Z2 Counter (Beckman Coulter, Miami, FL) and adjusted to 2.5 × 10⁸/mL, and the platelet suspension was supplemented with 0.7 mM CaCl2 before use. Mouse platelet preparations were done at University of Kentucky by the Sidney Whiteheart laboratory.
Platelet stimulation and electron microscopy studies
Washed platelets were activated, or not, with thrombin (0.1 U/mL) for the indicated times, and the reactions were stopped with an equal volume of 2% PFA and 5% glutaraldehyde (2X fixative). For morphology studies of vesicle-associated membrane protein (VAMP) knockout mutant platelets, platelets were stimulated with 0.1 U/mL thrombin, and the reactions were stopped at either 90 or 300 seconds with 2X fixative. Platelets were fixed at room temperature for 30 minutes and were recovered by centrifugation. The platelet pellets were processed by high pressure freezing and freeze substitution dehydration (see supplemental Materials and methods).
Samples were analyzed by transmission electron microscopy, electron tomography (ET), serial block face scanning electron microscopy (SBF-SEM), or focused ion beam scanning electron microscopy (FIB-SEM). Transmission electron microscopy and ET were performed with an FEI TF20 microscope operated at a beam energy of 80 or 200 KeV, respectively. SBF-SEM was performed with a Gatan 3View system mounted in a Zeiss Sigma SEM, FIB-SEM with a Zeiss Crossbeam 550 SEM (see supplemental Materials and methods). Platelets and their organelles were manually segmented and rendered in 3 dimensions, and volumes were quantified using Amira software, version 6.5.0 (Thermo Fisher FEI). For details, see supplemental Materials and methods.
Statistical analysis
Statistical analysis was performed using the KaleidaGraph software package for Mac (Synergy Software). Because the data sets were of different sizes and from different individual samples, 2-tailed, unequal, unpaired Student t tests were used to determine P values. The normality of the data set distributions was validated by skewness/kurtosis determinations.
Data sharing
Raw image stacks are available electronically to qualified investigators.
Results
Biochemical and ultrastructural validation of the SNARE-deficient mouse strains
The mouse strains, genetically altered for vesicle-SNAREs (v-SNARE) expression were as previously characterized.33 Shown in supplemental Figure 1, their platelets displayed the expected protein expression levels and secretion defects. V2Δ3Δ platelets are devoid of VAMP2 and 3 while containing normal levels of the α-granule v-SNAREs VAMP8 and 7,23,34,35 as well as other exocytic machinery proteins. V8−/− platelets were devoid of VAMP8 and contained normal levels of the other tested proteins, including VAMP7. Although platelets from V2Δ3Δ8−/− mice were devoid of VAMP2, 3, and 8, they also had reduced levels of VAMP7. V8−/− platelets exhibited partial inhibition of thrombin-stimulated (0.1 U/mL) platelet factor 4 (PF4) secretion from α-granules and β-hexosaminidase secretion from lysosomes with limited effects on dense granules. A stronger effect on α-granule secretion was achieved when the V8−/− was placed in a V2Δ3Δ background. VAMP3 is an important endocytic SNARE36 and known to have little effect on granule release.37 V2Δ3Δ platelets had no significant effect on α-granule secretion. These results biochemically validate the strains used here.33
At the ultrastructural level, the V2Δ3Δ8−/− platelets appeared to produce slightly smaller α-granules (compare Figure 1A and Figure 2C, resting platelets). To address this quantitatively, we scored α-granule size and number in platelet thin sections. As shown in supplemental Figure 2, α-granules in the V2Δ3Δ8−/− platelets were ∼70% the size of granules in wild-type (WT) platelets. Quantitation revealed that α-granule size was not significantly reduced in V8−/− or V2Δ3Δ platelets. α-Granule number, ∼5.4 profiles per platelet section, varied by small but insignificant amounts across the SNARE variants. Overall, these results suggest that VAMP2/3/8 contribute to α-granule biogenesis. The incidence of dense granules, 0.6 per resting platelet profile in thin section, was unaffected by VAMP variation.
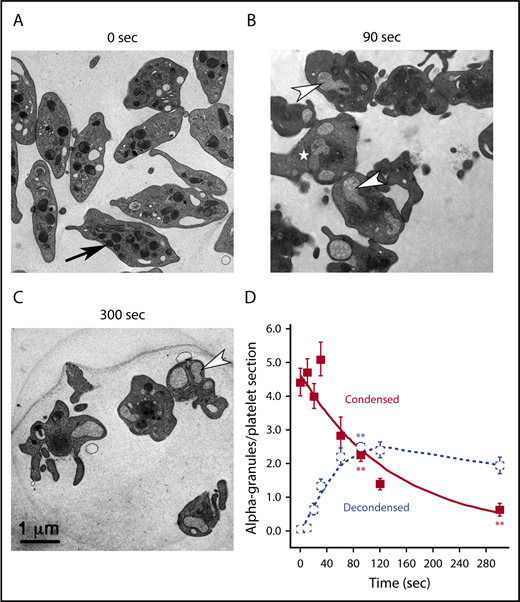
α-Granule decondensation is a kinetic precursor of granule exocytosis. Mouse platelets were stimulated, or not, with thrombin for the indicated times, and reactions were stopped by the addition of glutaraldehyde/paraformaldehyde fixative. Aldehyde fixation can stop secretion in <1 second (cultured hippocampal neurons).38 (A) In electron micrographs of thin sections from unstimulated mouse platelets (0 seconds), α-granules appeared as round to ovoid structures marked by an electron-dense matrix. Upon thrombin stimulation (B-C; 0.1 U/mL), there was distinct accumulation of expanded (ie, decondensed) α-granules marked by residual loose fibrous matrix components. The arrow in panel A points to a condensed α-granule. The arrowheads in panels B-C point to examples of compound-fused, decondensed α-granules. The white star in panel B marks a decondensed α-granule showing variations in apparent matrix density. (D) Quantification of condensed and decondensed granules in platelets stimulated for increasing times. Numbers of platelet profiles scored: 0 seconds/0 time, n = 50; 10 seconds, n = 50; 20 seconds, n = 47; 30 seconds, n = 45; 60 seconds, n = 19; 90 seconds, n = 145; 120 seconds, n = 45; 300 seconds, n = 41. Means and standard errors of the mean are presented, and the graphs are color coded: condensed (red) and decondensed (blue). P values relative to 0 seconds were determined at 90 and 300 seconds. Values for both condensed and decondensed granules were statistically significant for both sets of comparisons. Asterisks indicating statistical significance, as determined with Student t test are as follows: **P ≤ .01.
α-Granule decondensation is a kinetic precursor of granule exocytosis. Mouse platelets were stimulated, or not, with thrombin for the indicated times, and reactions were stopped by the addition of glutaraldehyde/paraformaldehyde fixative. Aldehyde fixation can stop secretion in <1 second (cultured hippocampal neurons).38 (A) In electron micrographs of thin sections from unstimulated mouse platelets (0 seconds), α-granules appeared as round to ovoid structures marked by an electron-dense matrix. Upon thrombin stimulation (B-C; 0.1 U/mL), there was distinct accumulation of expanded (ie, decondensed) α-granules marked by residual loose fibrous matrix components. The arrow in panel A points to a condensed α-granule. The arrowheads in panels B-C point to examples of compound-fused, decondensed α-granules. The white star in panel B marks a decondensed α-granule showing variations in apparent matrix density. (D) Quantification of condensed and decondensed granules in platelets stimulated for increasing times. Numbers of platelet profiles scored: 0 seconds/0 time, n = 50; 10 seconds, n = 50; 20 seconds, n = 47; 30 seconds, n = 45; 60 seconds, n = 19; 90 seconds, n = 145; 120 seconds, n = 45; 300 seconds, n = 41. Means and standard errors of the mean are presented, and the graphs are color coded: condensed (red) and decondensed (blue). P values relative to 0 seconds were determined at 90 and 300 seconds. Values for both condensed and decondensed granules were statistically significant for both sets of comparisons. Asterisks indicating statistical significance, as determined with Student t test are as follows: **P ≤ .01.

Deletion of VAMP8 partially affected α-granule decondensation whereas deletion of VAMP8 in a V2Δ3Δbackground largely blocked α-granule decondensation. Thin section electron microscopy of V2Δ3Δ (A), V8−/− (B), and V2Δ3Δ8−/− (C). Platelets stimulated with thrombin for 0, 90, and 300 seconds are shown. (D) Number of platelet profiles scored: WT: (0 seconds/0 time, n = 200), (90 seconds, n = 145), (300 seconds, n = 41); V8−/−: (0 seconds, n = 50), (90 seconds, n = 50), (300 seconds, n = 50). (E) Number of platelet profiles scored: V2Δ3Δ: (0 seconds, n = 100), (90 seconds, n = 50), (300 seconds, n = 50); V2Δ3Δ8−/−: (0 seconds, n = 100), (90 seconds, n = 50), (300 seconds, n = 38). Means and standard errors of the mean are presented, and graphs are color coded as indicated. P values were calculated, using Student t test, and asterisks indicating statistical significance are as follows: *P = .01 to .05; **P ≤ .01. Note: The electron density of the α-granule matrix at 0 seconds appeared similar for platelets from WT and all 3 SNARE variants.
Deletion of VAMP8 partially affected α-granule decondensation whereas deletion of VAMP8 in a V2Δ3Δbackground largely blocked α-granule decondensation. Thin section electron microscopy of V2Δ3Δ (A), V8−/− (B), and V2Δ3Δ8−/− (C). Platelets stimulated with thrombin for 0, 90, and 300 seconds are shown. (D) Number of platelet profiles scored: WT: (0 seconds/0 time, n = 200), (90 seconds, n = 145), (300 seconds, n = 41); V8−/−: (0 seconds, n = 50), (90 seconds, n = 50), (300 seconds, n = 50). (E) Number of platelet profiles scored: V2Δ3Δ: (0 seconds, n = 100), (90 seconds, n = 50), (300 seconds, n = 50); V2Δ3Δ8−/−: (0 seconds, n = 100), (90 seconds, n = 50), (300 seconds, n = 38). Means and standard errors of the mean are presented, and graphs are color coded as indicated. P values were calculated, using Student t test, and asterisks indicating statistical significance are as follows: *P = .01 to .05; **P ≤ .01. Note: The electron density of the α-granule matrix at 0 seconds appeared similar for platelets from WT and all 3 SNARE variants.
α-Granule decondensation is SNARE dependent
As predicted, thin section electron microscopy experiments established a precursor-product relationship between condensed and decondensed α-granules. By thin section, isolated, washed mouse platelets (0 seconds) were relatively discoid in shape and contained α-granules of 150 to 200 nm in diameter with an electron dense matrix (Figure 1A, arrow). Upon stimulation with thrombin, the platelets became rounded and extended pseudopods (Figure 1B-C). With respect to α-granule structure (Figure 1B, 90 seconds stimulation, white arrowheads), granules were frequently decondensed and had a ∼2× greater diameter. Within the interior of a decondensed α-granule, the matrix appeared fibrous with a lower electron density, suggesting cargo release. The frequency of condensed α-granules decreased with time, from an average of ∼5 per platelet profile to <1, over 300 seconds. The frequency of decondensed α-granules correspondingly increased for the first 90 seconds of stimulation. At 90 seconds stimulation, the average numbers for condensed and decondensed α-granules together equaled ∼5, consistent with the values at 0 seconds. At later time points, the sum of granules was less, as the frequency of condensed granules decreased while that of decondensed granules failed to increase and, in fact, decreased slightly. We attribute this decrease to compound, granule-granule fusion, a process already apparent at 90 seconds (Figure 1B, arrowheads). Significantly, even at 300 seconds stimulation, decondensed α-granules retained fibrous content (Figure 1C). This retention of fibrous α-granule matrix components following granule decondensation was consistent with the relatively low extent of protein secretion (eg, PF4 release; supplemental Figure 1). In comparison, release of adenosine diphosphate, a small molecule, from dense granules was nearly 80%.
We next tested the effects of deleting the v-SNARE, VAMP8, on thrombin-stimulated, α-granule decondensation. VAMP8 is considered the primary v-SNARE involved in α-granule secretion.23 We found platelets from V8−/− mice exhibited a kinetic delay in α-granule matrix decondensation. Following 90 seconds stimulation, few decondensed α-granules were apparent in V8−/− platelets, whereas after 300 seconds stimulation, decondensed granules were abundant and compound granule fusion was evident (Figure 2). As expected, V2Δ3Δ platelets behaved like WT (Figure 2B). However, and consistent with the biochemical data (supplemental Figure 1), loss of VAMP8 on a V2Δ3Δ background, strongly inhibited α-granule decondensation after both 90 and 300 seconds of thrombin stimulation. As quantified in Figure 2D-E, these data strongly indicate that α-granule decondensation is SNARE-dependent and, moreover, that matrix decondensation/cargo expulsion is likely dependent on fluid (ie, water) influx from the blood plasma.
α-Granule decondensation results in a stepwise transition in granule size
Figures 1 and 2 indicate that SNARE-dependent fusion of α-granules, presumably to PM and/or CS, is the route for the water influx resulting in granule decondensation. If, instead, regulated water channels (eg, aquaporins) were the source of water influx, then one might expect α-granules to swell gradually upon platelet activation and/or prior to membrane fusion. Alternatively, if actin-dependent granule constriction were the driving force for matrix expulsion, then it should be detectible. To test these predictions, we assessed α-granule volumes in unstimulated platelets (t = 0 seconds) and in platelets after stimulation, using SBF-SEM. With this approach, imaging to a depth of ∼7.5 μm provides a sufficient volume to contain whole platelets in several orientations. As illustrated in Figures 3 and 4, condensed α-granules (blue) in platelets, following 90 seconds stimulation, exhibited little to no change in volume relative to unstimulated platelets. Comparison of the mean surface area and volume showed no significant size difference between condensed α-granules in unstimulated platelets and in platelets after 90 seconds of stimulation. Moreover, decondensed α-granules (tan) at 90 and 300 seconds stimulation showed similar enlargement as α-granules located more centrally in platelets at 300 seconds stimulation (Figure 3; Table 1). Decondensed granules remained enlarged during the entire 300 seconds stimulus period indicative of a stable, abrupt change in granule condensation (Table 1). Importantly, the total α-granule surface area per platelet remained constant (Table 2) indicating that there was no detectable collapse of the granule membrane into the PM/CS. Together, these observations strongly indicate a stepwise, fusion-dependent, irreversible transition between 2 granule states that are characterized morphologically by differences in size and matrix density. In our ex vivo thin section experiments, where fixative was added to suspended platelets at time intervals of 10 or 20 seconds (Figure 1), we failed to detect any accumulation of intermediates suggesting that the transition occurred on a time scale of no more than seconds. Based on the detection of exocytosis intermediates (at 90 and 300 seconds) and granule swelling reported in Table 2, our experimental design appears insensitive to any delay in fixation kinetics.25 This is consistent with other reports, from cultured, hippocampal neurons, indicating that chemical fixation is sufficiently rapid (≤1 second) to stop secretory processes.38
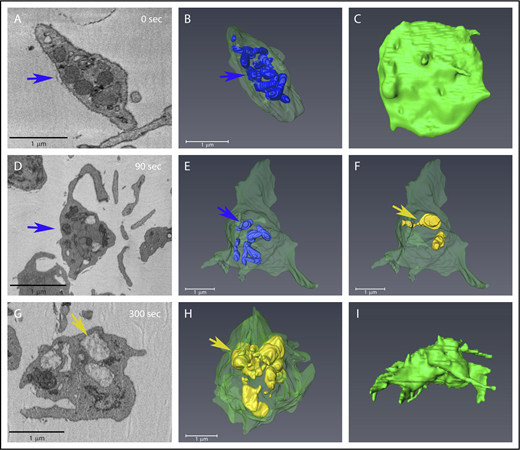
Condensed and decondensed α-granules distribution remains predominantly central during shape change in stimulated platelets. Each row shows various views of the same platelet. (A,D,G) Individual slices from SBF-SEM image stacks showing changes in platelets at various times of stimulation. Blue arrows indicate condensed granules; tan/yellow arrows indicate decondensed granules. (B,E,H) Condensed granules are rendered in blue, and decondensed granules in tan/yellow. (C,F,I) PM is rendered in green. A decondensed granule appeared to be connected to the PM via a long pipe as shown in panel F. Supplemental Figure 3 Movie shows the 90 seconds rendered example rotated in 3-dimensional space. α-Granule surface area and sizes were quantified from similar renderings for multiple randomly chosen platelets (see Figure 4 for additional examples), and the quantitation of their characteristics is reported in Tables 1 and 2.
Condensed and decondensed α-granules distribution remains predominantly central during shape change in stimulated platelets. Each row shows various views of the same platelet. (A,D,G) Individual slices from SBF-SEM image stacks showing changes in platelets at various times of stimulation. Blue arrows indicate condensed granules; tan/yellow arrows indicate decondensed granules. (B,E,H) Condensed granules are rendered in blue, and decondensed granules in tan/yellow. (C,F,I) PM is rendered in green. A decondensed granule appeared to be connected to the PM via a long pipe as shown in panel F. Supplemental Figure 3 Movie shows the 90 seconds rendered example rotated in 3-dimensional space. α-Granule surface area and sizes were quantified from similar renderings for multiple randomly chosen platelets (see Figure 4 for additional examples), and the quantitation of their characteristics is reported in Tables 1 and 2.

Peripheral α-granules appear to decondense first upon stimulation. Renderings from SBF-SEM of 5 different platelets, stimulated for 90 seconds (A-E) are shown. Condensed granules are rendered in blue, decondensed granules are rendered in tan/yellow, and PM is rendered in green. Arrows point to examples of peripherally located, decondensed granules. Quantification of granule sizes is tabulated in Table 1. Bar represents 1 μm.
Peripheral α-granules appear to decondense first upon stimulation. Renderings from SBF-SEM of 5 different platelets, stimulated for 90 seconds (A-E) are shown. Condensed granules are rendered in blue, decondensed granules are rendered in tan/yellow, and PM is rendered in green. Arrows point to examples of peripherally located, decondensed granules. Quantification of granule sizes is tabulated in Table 1. Bar represents 1 μm.
Individual α-granule surface area and volume increased upon thrombin stimulation
| Time, s | α-Granules | |||
|---|---|---|---|---|
| Surface area per granule, μm2 | Volume per granule, μm3 | |||
| Condensed | Decondensed | Condensed | Decondensed | |
| 0 | 0.37 ± 0.017 | ND | 0.017 ± 0.001 | ND |
| N = 125 | N = 125 | |||
| 90 | 0.44 ± 0.027 | 0.85 ± 0.26 | 0.019 ± 0.001 | 0.056 ± 0.023 |
| N = 69 | N = 19 | N = 69 | N = 19 | |
| P = .02 | P = .19 | |||
| 300 | ND | 0.88 ± 0.16 | ND | 0.055 ± 0.012 |
| N = 51 | N = 51 | |||
| P = .05 | P = .002 | |||
WT mouse platelets were stimulated with thrombin for the indicated times. α-Granule surface area and volumes per platelet were determined from full platelet depth images derived from SBF-SEM image stacks. Five platelets were rendered and quantified at each time point (N = total number of condensed or decondensed granules scored at each time point). Bolded numbers were used for P value comparisons. For surface area, significant P values (calculated with Student t test) were seen for 2 comparisons: condensed at 0 vs 90 s (P = .02) and condensed at 90 s vs decondensed at 300 s (P = .05). Volume comparisons showed significant P values for only the condensed at 90 s vs decondensed at 300 s comparison (P = .002).
ND, not detected.
Total α-granule surface area and volume per platelet showed little to no change upon thrombin stimulation
| Time, s | Surface area per platelet, μm2 | Volume per platelet, μm3 | Total | |||
|---|---|---|---|---|---|---|
| Condensed | Decondensed | Condensed | Decondensed | Area, μm2 | Volume, μm3 | |
| 0 | 9.34 ± 4.15 | ND | 0.43 ± 0.18 | ND | 9.34 | 0.43 |
| 90 | 6.07 ± 3.12 | 3.29 ± 3.26 | 0.26 ± 0.10 | 0.21 ± 0.24 | 9.36 | 0.47 |
| P = .22 | P = .13 | |||||
| 300 | ND | 9.00 ± 3.20 | ND | 0.56 ± 0.24 | 9.00 | 0.56 |
| P = .02* | P = .03* | |||||
WT mouse platelets were stimulated with 0.1 U/mL thrombin for the indicated times. Total α-granule surface area and volume per platelet were determined from full platelet depth SBF-SEM image stacks. Five platelets were rendered and quantified at each time point. Asterisks indicate statistically significant comparisons within the table columns, as calculated with Student t test. *P = .01 to .05.
α-Granule decondensation occurs first in peripheral α-granules
As observed in stimulated platelets (90 seconds), decondensed granules (tan) were predominantly located at the cell periphery, whereas condensed granules (blue) were typically more central (Figures 3 and 4; supplemental Figure 3 Movie). In several platelets, the decondensed α-granules appeared almost adjacent/connected to the PM. This pattern was seen in most activated platelets, especially at early time points; however, because of the shape changes occurring during platelet activation, it is difficult to quantitatively measure the spatial distributions of the 2 granule populations. Such detailed image analysis is beyond the scope of the present work.
α-Granule fusion with the PM/CS or a decondensed α-granule induces matrix decondensation, progressing from the site of membrane fusion
We have shown previously, by ET, that the Z-resolution of 3-dimensional imaging methods must be sufficient to detect granule fusion pores, which in mouse platelets can be ≥30 nm diameter.33 To achieve higher Z-resolution, we used FIB-SEM, which provides a nominal isotropic X, Y, Z pixel size of ∼5 nm. With the FIB-SEM, we expected to capture 3-dimensional volumes containing granule fusion events, albeit rare, in which the processes of matrix decondensation were in midstage. If such processes were because of solvent (ie, water) influx at the fusion zone, then matrix decondensation would propagate from the fusion site. This is illustrated with 2 examples: one in which the CS fuses with a condensed granule (Figure 5A-F), and the other in which there is granule-to-granule fusion (Figure 5G-L). At 90 seconds stimulation, granule matrix decondensation propagates directly from the granule-CS fusion site (Figure 5A-F, arrows). A similar behavior was seen for compound granule fusion (Figure 5G-L, arrows). In Figure 5L, the set of fusing/fused α-granules are rendered in 3-dimensional space and displayed at a slight tilt to a plane perpendicular to the FIB-SEM images. We conclude that the fusion pore, produced either by coupling the granule through a neck or a pipe or by the larger granule-to-granule fusion zone, is the entry point for the water influx required for α-granule matrix hydration and subsequent cargo release.

α-Granule matrix decondensation propagates from open canalicular system–granule fusion or decondensed-condensed granule fusion sites. Images are individual slices from FIB-SEM image stacks, and the frames shown are spaced 15 nm apart. (A-F) The blue arrow indicates a condensed α-granule, and the yellow indicates open canalicular system–elements (A). The variegated blue/yellow arrowhead indicates a CS-granule fusion zone (B). The dark tubular structures adhering to the decondensing α-granule are elements of dense tubular network. (G-L) The tan arrow indicates a decondensed α-granule (G), and the blue arrow indicates a condensed α-granule (G). The variegated tan/blue arrowhead indicates the decondensed-condensed granule fusion zone in the FIB-SEM slice (I) and similarly marks the fusion zone in a rendering (L) that is slightly tilted from the perpendicular relative to the FIB-SEM image planes. Bars represent 0.5 μm.
α-Granule matrix decondensation propagates from open canalicular system–granule fusion or decondensed-condensed granule fusion sites. Images are individual slices from FIB-SEM image stacks, and the frames shown are spaced 15 nm apart. (A-F) The blue arrow indicates a condensed α-granule, and the yellow indicates open canalicular system–elements (A). The variegated blue/yellow arrowhead indicates a CS-granule fusion zone (B). The dark tubular structures adhering to the decondensing α-granule are elements of dense tubular network. (G-L) The tan arrow indicates a decondensed α-granule (G), and the blue arrow indicates a condensed α-granule (G). The variegated tan/blue arrowhead indicates the decondensed-condensed granule fusion zone in the FIB-SEM slice (I) and similarly marks the fusion zone in a rendering (L) that is slightly tilted from the perpendicular relative to the FIB-SEM image planes. Bars represent 0.5 μm.
Decondensed α-granules track back to fusion pores occurring with either the PM or CS for single fusion or other granules for compound fusion
Using FIB-SEM, we scored the frequency at which decondensed α-granules tracked to fusion pores connected either to the PM, to the CS, or, via compound granule-granule fusion, to the PM/CS, in 10 whole platelets, at 90 and 300 seconds of stimulation. We expected a high incidence of fusion-pore-anchored, decondensed granules, whose frequency would be <100% for 2 reasons: (1) fusion pore formation can be unstable33 , and (2) fusion pore detection is resolution-dependent. Even at 5-nm Z-resolution, the angle of presentation and the width of the pore can make them difficult to distinguish. Stimulated platelets displayed multiple classes of granules anchored to membrane fusion pores. These included single α-granules fused to the PM, compound fused α-granules anchored to a PM fusion pore, and compound fused granules anchored to a CS fusion pore. Representative examples of pore anchored and unanchored decondensed granule classes are shown in Figure 6. Quantitatively, fusion-pore-anchored granules were linked fourfold more frequently to the PM than CS (Table 3). Considering that a “string” of compound fused α-granules could consist of 2 to 5 granules linked together, the number of compound fusion events likely exceeds the number of primary fusion events to PM/CS. Electron tomography of 300-nm-thick sections (Z-step size 1.5 nm) gave a ratio of ∼4 with a strong dependence of both primary and compound fusion on SNARE expression with V8−/− platelets exhibiting a transitory inhibition at 90 seconds stimulation and the V2Δ3Δ8−/− platelets exhibiting a near complete fusion block (supplemental Figure 4). These results are consistent with the earlier thin section quantification of granule frequency in stimulated V2Δ3Δ8−/− platelets (Figure 2). In these platelets, no examples of compound fusion were detected even after 300 seconds stimulation, whereas compound fusion was abundant in stimulated platelets from V2Δ3Δ or V8−/− mice at the same time point.

Decondensed α-granule membrane fusion in thrombin-stimulated platelets. Platelets were imaged by FIB-SEM at a nominal resolution of 5 nm in XYZ. Tan arrows point to examples of membrane fusion; 90 seconds stimulation (A-F) and 300 seconds stimulation (G-H). The left column shows single-slice images of platelets, and the right shows rendered images of decondensed granules (tan) and the PM (green). Two image sets show granules that track to the PM at 90 seconds stimulation, in one (A-B), the granule is linked to the PM fusion pore via a short neck, while in the other case the linkage to the fusion pore is by a longer pipe (C-D). (E-F) Two granules fused laterally (compound fusion), and these fail to track to either a PM or CS fusion pore complex. (G-H) A PM-granule fusion at 300 seconds with a larger neck/pipe. The blue arrow in panel G points to a rare condensed α-granule seen in a 300 seconds stimulated platelet. The incidence of α-granule fusion with PM and CS at various time points is quantified in Table 3. Bars represent 0.2 μm.
Decondensed α-granule membrane fusion in thrombin-stimulated platelets. Platelets were imaged by FIB-SEM at a nominal resolution of 5 nm in XYZ. Tan arrows point to examples of membrane fusion; 90 seconds stimulation (A-F) and 300 seconds stimulation (G-H). The left column shows single-slice images of platelets, and the right shows rendered images of decondensed granules (tan) and the PM (green). Two image sets show granules that track to the PM at 90 seconds stimulation, in one (A-B), the granule is linked to the PM fusion pore via a short neck, while in the other case the linkage to the fusion pore is by a longer pipe (C-D). (E-F) Two granules fused laterally (compound fusion), and these fail to track to either a PM or CS fusion pore complex. (G-H) A PM-granule fusion at 300 seconds with a larger neck/pipe. The blue arrow in panel G points to a rare condensed α-granule seen in a 300 seconds stimulated platelet. The incidence of α-granule fusion with PM and CS at various time points is quantified in Table 3. Bars represent 0.2 μm.
Site of α-granule fusion pore anchoring following thrombin stimulation
| Thrombin stimulation | ||
|---|---|---|
| 90 s, 0.1 U/mL | 300 s, 0.1 U/mL | |
| PM anchored | ||
| Single decondensed α-granule | 31% | 35% |
| N = 21 | N = 32 | |
| Compound fused decondensed α-granule string | 30% | 29% |
| N = 20 | N = 26 | |
| CS anchored | ||
| Single decondensed α-granule anchored to CS pore | 15% | 11% |
| N = 10 | N = 10 | |
| Unanchored | ||
| Single decondensed α-granule | 1% | 12% |
| N = 1 | N = 11 | |
| Compound fused decondensed α-granule string | 22% | 13% |
| N = 14 | N = 12 | |
| Relative frequency | Total events 66 | Total events 89 |
| PM anchored | 61% | 64% |
| CS anchored | 15% | 11% |
| Unanchored | 23% | 25% |
WT mouse platelets were stimulated with 0.1 U/mL thrombin for the indicated times. α-Granule fusion events were determined for all α-granules found in 10 randomly chosen platelets presenting in full platelet depth FIB-SEM image stacks at each time point. Granules were tracked at a nominal 5-nm Z-step resolution from image slices to score, in 3-dimensional space, whether the granule was anchored to a PM or CS pore complex. Image pixel size in XY was 5 nm × 5 nm.
In sum, α-granule decondensation is predominantly anchored to SNARE-dependent fusion pores, either to PM, the dominant event, or to the CS. We conclude that α-granule cargo expulsion is linked directly, in the case of primary fusion to PM/CS, and indirectly, in the case of compound granule fusion. In all cases, VAMP-dependent matrix hydration is necessary to initiate cargo expulsion.
Discussion
We addressed here a central aspect of the platelet release reaction, namely, what is driving the expulsion of α-granule matrix proteins. Based on analogies to previous work with platelets1-3 and the closely related WPBs of endothelial cells,9 we considered 3 possible mechanisms: (1) a jack-in-the-box mechanism driven by SNARE-dependent water influx and subsequent protein phase transitions9,24,25 ; (2) a regulated channel-dependent water influx with granule swelling prior to fusion (analogous to the membrane ballooning in procoagulant platelets)28 ; and (3) an actin-driven granule constriction.26,27 We reasoned that determining the kinetics and molecular requirements for the conversion of the α-granule matrix from a condensed to a decondensed state would provide a key readout of granule matrix hydration, which we posit is an underlying prerequisite for cargo expulsion. Experimentally, we used thrombin stimulation for varied durations to test the kinetics of the process and used isolated mouse platelets from WT and SNARE-deficient mice to test the molecular requirements. Our readout for granule size/shape and matrix decondensation was direct observation by electron microscopy, be it thin section, SBF-SEM, FIB-SEM, or ET. Based on testing multiple experimental predictions, we conclude that platelet α-granule cargo expulsion uses a jack-in-the-box mechanism in which water influx and cargo expulsion are initiated by SNARE-dependent membrane fusion and subsequent granule matrix decondensation (Figure 7). SNARE dependence was exhibited at multiple stages, during primary granule fusion predominantly with the PM and secondarily with the CS and during sequential compound fusion of granules to a fusion pore anchored α-granule. Importantly, our results position the hydration kinetics of the α-granule matrix as a significant determining factor in the time-dependent release of α-granule contents.18

Graphic summary of the role of α-granule decondensation in granule cargo release. In this illustration, we represent the observed steps that occur during decondensation and release of α-granule contents. The v- and t-SNAREs (ie, VAMP8/7 and syntaxin-11/SNAP23) are indicated. SNARE-mediated fusion, water influx (blue circles), and granule/matrix decondensation are depicted as a sequence of events. Both primary and compound granule-granule fusion are shown.
Graphic summary of the role of α-granule decondensation in granule cargo release. In this illustration, we represent the observed steps that occur during decondensation and release of α-granule contents. The v- and t-SNAREs (ie, VAMP8/7 and syntaxin-11/SNAP23) are indicated. SNARE-mediated fusion, water influx (blue circles), and granule/matrix decondensation are depicted as a sequence of events. Both primary and compound granule-granule fusion are shown.
We used SNARE dependence as a tool to probe the decondensation process.33 Based on previous experimentation, we expected the v-SNARE, VAMP8,23,33,39 would be important but not required for α-granule decondensation and granule matrix solubilization. This indeed proved to be the case. VAMP8 deletion alone produced a transient delay in α-granule decondensation presumably because of the ability of VAMP734 to partially compensate. The V2Δ3Δ8−/− platelets showed a near complete block in α-granule matrix decondensation, consistent with their secretion defects.33 We attribute this to VAMP237 and VAMP337 being involved in endocytic trafficking that reduces VAMP7 levels, indirectly. The importance of the coordination between VAMP7 and 8 levels and how VAMP2/3 affects this are still open questions. However, a key conclusion remains that the reduced levels of VAMP7 cannot completely compensate for the loss of VAMP8 in the V2Δ3Δ background. This evidence reaffirms the previous conclusion of Ren et al23 that VAMP8 is the primary v-SNARE involved in α-granule secretion. Moreover, the present work extends the studies of Ren et al23 and Eckly et al19 to indicate that α-granule matrix decondensation is SNARE dependent. Matrix decondensation required SNARE-mediated membrane fusion to the PM, CS, or a decondensing α-granule. This dependence can be readily explained by fusion-pore-dependent water influx but not by channel-regulated water influx and prefusion granule swelling. Moreover, our observations that granule matrix decondensation radiated from the site of membrane fusion provide striking validation of fusion-pore-dependent water influx. In brief, we conclude that the fusion pore is the site of water entry. The reader should note that we are using the term “water” in a generic sense. The fusion pore is open to an influx of extraplatelet fluid, be it plasma or buffer, which is needed to rehydrate and solubilize the concentrated granule contents.
Overall, these results strongly suggest that primary and compound α-granule membrane fusion are coupled processes. Any inhibition of primary fusion to the PM correlated with an inhibition of compound fusion. As to which membranes are involved, PM or CS, in previous experiments with human platelets, we failed to observe any α-granule fusion with CS, conceivably a consequence of the small sample size.6 However, Eckly et al19 did report isolated examples of granule/CS fusion in mouse platelets. In our present study of mouse platelets, we observed a predominance (∼80%) of primary α-granule fusion with PM. From our data, ∼75% of granule decondensation, be it of single or compound fused granules, tracked back to a membrane fusion pore. The remaining 25% of decondensed granules exhibited no detectable fusion-pore anchoring. We attribute this to 2 limiting factors: a technical limit, the nominal 5-nm Z-step size achieved in the FIB-SEM imaging and a biological factor, the possible dynamic instability of the fusion pore. As cited previously, the near absolute dependence of granule decondensation on v-SNAREs provides an additional compelling argument that pore detection in one form or another may be the limiting factor. In Figure 7, we propose a model in which compound α-granule fusion is the sequential outcome of primary α-granule fusion to PM or CS followed by a redistribution of t-SNAREs to support successive rounds of granule-granule fusion. Such a t-SNARE distribution has been reported for SNAP-23 in mast cells.40 Similar models have been proposed to support a jack-in-the-box mechanism of VWF release from compound fused WPBs in endothelial cells.9,24,25 We found no ultrastructural evidence in mouse platelets for granule constriction and hence suggest that the alternative actin-dependent WPB constriction model proposed in endothelial cells does not apply to thrombin-stimulated platelets. Consistent with this suggestion, actin disruptors such as latrunculin have been shown to have varied effects on the α-granule release reaction.29-32
In conclusion, we propose that the structural and functional consequences of granule matrix organization are underappreciated contributory factors to platelet function. A structured matrix could confer timed-release properties to α-granule cargo based on differential matrix dissociation kinetics. Evidence for sequential α-granule cargo release has been presented in the literature.18 Timed cargo release could be physiologically important to thrombus formation or its sequela (eg, wound healing and angiogenesis). Furthermore, cargo interactions within the α-granule matrix may be important for stabilizing protein accumulation within the granule. These interactions may well be dependent, at the molecular level, on factors such as pH, [Ca2+], and membrane potential, all of which are conceivable drug targets.
The full-text version of this article contains a data supplement.
Acknowledgments
The authors thank Carl Zeiss Inc. (Thornwood, NY) for performing the FIB-SEM imaging and Joel Mancuso of Zeiss for arranging this.
The Storrie laboratory was supported in part by grants from the National Heart, Lung, and Blood Institute, National Institutes of Health (R01 HL119393 and R56 HL119393). The Whiteheart laboratory was supported in part by the National Heart, Lung, and Blood Institute, National Institutes of Health (grants HL56652 and HL138179), the American Heart Association (grant AHA16GRNT27620001), a Veterans Affairs Merit Award (S.W.W.), and an American Heart Association predoctoral grant (AHA15PRE25550020) (S.J.). The Leapman laboratory was supported by the intramural program at National Institute of Biomedical Imaging and Bioengineering at the National Institutes of Health (Bethesda, MD).
Authorship
Contribution: I.D.P., S.J., M.T., R.D., M.A.A., J.A.K., and G.Z. performed different aspects of the individual experiments and the analysis of the data; B.S., S.W.W., M.A.A., and R.D.L. were involved in experimental design; I.D.P., S.J., and B.S. wrote the manuscript; S.W.W. and B.S. edited manuscript drafts; B.S. together with R.D.L., S.J., M.A.A., and S.W.W. did final editing; and J.A.K. supported the electron microscopy efforts at University of Arkansas for Medical Sciences.
Conflict-of-interest disclosure: The authors declare no competing financial interests.
Correspondence: Brian Storrie, Department of Physiology and Biophysics, University of Arkansas for Medical Sciences, 4301 West Markham St, Little Rock, AR 72205; e-mail: storriebrian@uams.edu.

