

Key Points
Somatic STAT3 mutations were frequently found in PRCA with or without T-LGLL.
STAT3 mutation–positive PRCA patients were less responsive to cyclosporine treatment than mutation-negative patients.

Abstract
Dysregulation of T-cell–mediated immunity is responsible for acquired pure red cell aplasia (PRCA). Although STAT3 mutations are frequently detected in patients with T-cell large granular lymphocytic leukemia (T-LGLL), which is often complicated by PRCA and which is also reported to be associated with acquired aplastic anemia (AA) and myelodysplastic syndrome (MDS), whether STAT3-mutated T cells are involved in the pathophysiology of PRCA and other types of bone marrow failure remains unknown. We performed STAT3 mutation analyses of the peripheral blood mononuclear cells from PRCA patients (n = 42), AA (n = 54), AA–paroxysmal nocturnal hemoglobinuria (AA-PNH; n = 7), and MDS (n = 21) using an allele-specific polymerase chain reaction and amplicon sequencing. STAT3 mutations were not detected in any of the 82 patients with AA/PNH/MDS but were detected in 43% of the 42 PRCA patients. In all 7 STAT3-mutation–positive patients who were studied, the STAT3 mutations were restricted to sorted CD8+ T cells. The prevalence of STAT3 mutation in idiopathic, thymoma-associated, autoimmune disorder–associated, and T-LGLL–associated PRCA was 33% (5 of 15), 29% (2 of 7), 20% (1 of 5), and 77% (10 of 13), respectively. The STAT3-mutation–positive patients were younger (median age, 63 vs 73 years; P= .026) and less responsive to cyclosporine (46% [6 of 13] vs 100% [8 of 8]; P= .0092) in comparison with STAT3-mutation–negative patients. The data suggest that STAT3-mutated CD8+ T cells may be closely involved in the selective inhibition of erythroid progenitors in PRCA patients.
Introduction
Somatic mutations of STAT3, one of the STAT-signaling molecules, are among the most frequent types of genetic alterations in patients with T- or natural killer (NK)–cell lymphoma, especially patients with T-cell large granular lymphocytic leukemia (T-LGLL),1 chronic lymphoproliferative disorders of NK cells (CLPD-NK),2 aggressive NK-cell leukemia,3 and chronic adult T-cell leukemia/lymphoma (ATL/L).4 Activating mutations in the Src-homology 2 (SH-2) domain of STAT3 that led to the constitutional phosphorylation of STAT3 and enhanced transcriptional activity by the JAK/STAT-signaling pathways are considered to be mechanisms of aberrant T-/NK-cell proliferation, based on the STAT3 mutations in these lymphoid malignancies.1,2
T-LGLL is an indolent cytotoxic T-cell lymphoproliferative disorder that is often complicated by autoimmune diseases such as rheumatoid arthritis and cytopenia, including neutropenia and pure red cell aplasia (PRCA).5 T-LGLL was found to be associated with acquired aplastic anemia (AA) and/or myelodysplastic syndrome (MDS) in certain patients.6-9 STAT3 mutations are detected in 40% to 50% of T-LGLL patients,1,10 and are the most common type of mutation among patients with T-/NK-cell lymphoma/leukemia.11 STAT3 mutations have also been detected in some patients with T-LGLL complicated by PRCA10,12 ; however, little is known about the role of STAT3-mutated T cells in the development of PRCA.
Acquired PRCA is a syndrome defined by anemia with the marked reduction or absence of erythroid production, which develops due to T-cell–mediated or autoantibody-dependent immune mechanisms.13 PRCA is classified into primary and secondary types, including thymoma-associated PRCA and T-LGLL–associated PRCA and is treated with immunosuppressants. T-cell abnormalities have been noted in PRCA, however, the detailed pathophysiology remains to be clarified. In addition to PRCA, AA, AA–paroxysmal nocturnal hemoglobinuria (AA-PNH), and MDS are categorized as a bone marrow (BM) failure syndrome (BMF) possessing several common features including T-cell–mediated immune mechanisms,14,15 although the impaired cell lineages and mutational abnormalities differ. To determine how often STAT3-mutated T cells are involved in the development of BMF including PRCA, AA, AA-PNH, and MDS, we analyzed the profiles of STAT3 mutations in patients with BMF.
Methods
Patients
Patients with AA, AA-PNH, MDS, or PRCA were enrolled in this study. The diagnoses of MDS and T-LGLL were based on the 2008 World Health Organization (WHO) classification and updated criteria for T-LGLL.16,17 The diagnostic criteria of AA, AA-PNH, PRCA, and T-LGLL for this study are summarized in supplemental Table 1.18-21 The clinical data, including the age, sex, underlying conditions, and laboratory data were collected from medical records. The therapeutic medications administered to patients with PRCA and their effectiveness were also obtained. The previously reported response criteria for PRCA22 were adopted.
This study was conducted in accordance with the Declaration of Helsinki and was approved by the institutional review boards of each participating center. Written informed consent was obtained from the patients and healthy controls.
DNA extraction
Mononuclear cells (MNCs) were isolated from peripheral blood or BM using Ficoll gradient separation (GE Healthcare, Little Chalfont, Buckinghamshire, United Kingdom) and were stored at −80°C until DNA extraction. DNA was extracted using a QIAamp DNA blood mini-kit (Qiagen GmbH, Hilden, Germany) according to the manufacturer’s instructions.
Allele-specific PCR
Allele-specific polymerase chain reactions (AsPCRs) to detect STAT3 Y640F and D661Y mutations were performed using previously described primers.2,10
Amplicon sequencing of the STAT3 gene
Amplicon sequencing was performed using Ion AmpliSeq technology. The primers were designed to cover 98% of the STAT3 gene coding sequence with the Ampliseq Designer system (Thermo Fisher Scientific, Waltham, MA) (supplemental Table 2). The libraries were made using the Ion AmpliSeq kit for the Chef DL8 or Ion Ampliseq Library kit 2.0 according to the protocol for preparing Ion Ampliseq libraries (Thermo Fisher Scientific).
The other primers (supplemental Table 3) covering the residual 2% of the coding sequences were designed and 2 amplicons were made by a PCR. The PCR settings were as follows: preactivation for 3 minutes at 95°C, 40 to 50 denaturation cycles for 30 seconds at 95°C, annealing for 30 seconds at 58°C, and extension for 12 seconds at 68°C. These 2 amplicons were quantitated using a Qubit dsDNA HS Assay kit (Thermo Fisher Scientific) and equal amounts of each amplicon were mixed. These mixed amplicons were then subjected to library preparation with the Ion Plus Fragment Library kit (Thermo Fisher Scientific). The concentrations of the libraries were measured with an Ion Library TaqMan Quantitation kit (Thermo Fisher Scientific). The libraries were subjected to amplicon sequencing on Ion PGM according to the standard protocol using the Ion 314 or 318 Chip kit (v2; Thermo Fisher Scientific). The data were analyzed with the Torrent Suite software program (v5.2.2; Thermo Fisher Scientific). The main variant calling settings were as follows: variant frequency filter, 0.005; base quality Q value, ≥20; minimum coverage of depth, 1000; and maximum strand bias, 0.95 (single-nucleotide polymorphism [SNP]), 0.9 (insertion/deletion [INDEL]). The called variants were annotated by wANNOVAR (http://wannovar.wglab.org/index.php) and mutations considered to be SNPs or silent mutations were eliminated.
Validation of candidate somatic mutations by Sanger sequencing
PCR amplification was performed using primers (supplemental Table 4) and PCR products were purified by gel electrophoresis followed by extraction with a QIAExII Gel Extraction kit (QIAGEN) or Agencourt AMPure XP beads (Beckman Coulter, Brea, CA). The purified PCR products were then sequenced with a BigDye v1.1 Cycle Sequencing kit and an ABI Prism 3500 Genetic Analyzer (Thermo Fisher Scientific).
Sorting of cell subpopulations
In selected patients, target cell subpopulations were separated using a fluorescence-activated cell sorter (FACS). For example, CD4−CD8+ or CD4+CD8− T cells were separated using antibodies against CD4 (fluorescein isothiocyanate [FITC]; clone RPA-T4; BD Biosciences) and CD8 (phycoerythrin [PE]; clone RPA-T8; BD Biosciences) with the FACSAria cell sorter (BD Biosciences). Antibodies against CD14 (allophycocyanin [APC]; clone M5E2; BD Biosciences), and CD15 (PE; clone HI98; BD Biosciences) and appropriate gating on scattergrams was applied for the separation of granulocytes from whole-blood leukocytes.
Flow cytometry of the TCRVβ repertoire and the TCRγ gene-rearrangement analysis
The T-cell receptor (TCR) Vβ repertoire was analyzed using whole-blood samples by combining CD4 (PerCP-Cy5.5; clone L200; BD Biosciences) and CD8 (APC, clone RPA-T8, BD Biosciences) antibodies with the panel of TCR Vβ antibodies (Beckman Coulter). Samples were analyzed using a FACSCantoII and the FACSDiva Software program (BD Biosciences). If the percentage of a TCRVβ family exceeded 20% of the total TCRVβ families with the other Vβ families being suppressed, the Vβ family was deemed to be aberrantly expanding. TCRγ gene rearrangement was examined using a PCR-based method.23
Statistical analysis
Comparisons between different groups were carried out using the Fisher exact test, a 2-sided Student t test, the Mann-Whitney U test, or a log-rank test, as appropriate. P < .05 was considered to indicate statistical significance. All of the statistical analyses were performed using the EZR software program.24
Results
Patient demographics
A total of 128 patients recruited from 3 university hospitals in Nagano, Kanazawa, and Akita, Japan, were analyzed in the present study (supplemental Figure 1A-B). Peripheral blood or BM samples at the time of the diagnosis, and if possible, during and after therapy for PRCA, were obtained. The diagnoses of the enrolled patients were as follows: AA, n = 54; MDS, n = 21; AA-PNH, n = 7; and PRCA, n = 42. The subtypes of MDS are shown in supplemental Table 5. The causes of secondary PRCA were as follows: T-LGLL, n = 13; thymoma or thymic cancer, n = 7; autoimmune disease, n = 5; adverse drug reactions, n = 1; and human parvovirus B19 infection complicated by T-LGLL, n = 1. The clinical characteristics are summarized in Table 1. The diagnoses of the patients in the Akita cohort were as follows: PRCA without T-LGLL, n = 11; T-LGLL–associated PRCA, n = 2; and AA, n = 11.
The clinical characteristics of patients
| Disease | AA | MDS | AA-PNH | PRCA | |||||
|---|---|---|---|---|---|---|---|---|---|
| Idiopathic | Thymoma associated | Autoimmune disease associated | Drug associated | Parvovirus associated* | T-LGLL associated | ||||
| No. of patients | 54 | 21 | 7 | 15 | 7 | 5 | 1 | 1 | 13 |
| Age, median (range), y | 60 (26-94) | 65 (26-83) | 37 (20-56) | 71 (39-82) | 48 (43-78) | 63 (58-67) | 65 | 49 | 71 (20-78) |
| Male, % | 51 | 40 | 29 | 10 | 33 | 67 | 0 | 100 | 27 |
| WBC, median (range), ×109/L | 2.9 (1.2-5.3) | 2.1 (0.5-7.9) | 2.4 (1.1-5.3) | 3.9 (2.3-5.1) | 4.8 (3.0-5.7) | 4.0 (2.3-6.7) | 2.9 | 10.9 | 6.7 (3.3-19.1) |
| Neutrophils, median (range), ×109/L | 1.3 (0.2-4.2) | 1 (0.04-5.1) | 2.5 (0.5-4.5) | 2.7 (0.9-3.3) | 3.1 (1.4-3.3) | 2.2 (1.5-4.7) | 1.5 | 8.7 | 1.9 (0.7-13.2) |
| Hemoglobin, median (range), g/L | 114 (38-160) | 94 (33-134) | 75 (50-119) | 62 (42-77) | 52 (40-66) | 66 (58-67) | 57 | 69 | 89 (48-100) |
| Platelets, median (range), ×109/L | 58 (6-232) | 83 (19-200) | 115 (25-180) | 300 (168-405) | 249 (213-417) | 208 (113-391) | 243 | 319 | 306 (222-584) |
| Follow-up duration, median (range), mo | 70 (1-1404) | 30 (7-324) | 153 (52-413) | 38 (1-300) | 6 (2-85) | 38 (30-204) | 1 | 134 | 44 (9-261) |
| Survival rate, % | 88 | 80 | 100 | 90 | 67 | 67 | 100 | 100 | 100 |
| AsPCR+, n (%) | 0 | 0 | 0 | 2 (13) | 1 (14) | 0 | 0 | 0 | 6 (46) |
Clinical data were obtained from Nagano and Kanazawa cohorts.
AsPCR, allele-specific polymerase chain reaction for STAT3 Y640F and/or D661Y mutation; WBC, white blood cell count.
Parvovirus B19 infection complicated by T-LGLL.
STAT3 mutations detected by AsPCR
As an initial step in the STAT3 mutational analysis, we screened all patients with an AsPCR for 2 STAT3 hotspot mutation sites, Y640F and D661Y. Among the PRCA patients, 3 of the 29 PRCA patients without T-LGLL and 6 of the 13 PRCA patients with T-LGLL were positive for mutations. In contrast, none of the patients with AA, MDS, or AA-PNH were positive (P = .000031; Table 1). The results suggest that the STAT3 mutations in MNCs are limited to PRCA patients with or without T-LGLL.
Amplicon sequencing of the STAT3 gene
To obtain further insights into the STAT3 mutation profiles of patients with BMFs including PRCA, we examined MNC-derived DNA from 73 patients (supplemental Figure 1A-B; PRCA, n = 42 and AA, n = 31) using amplicon sequencing. In this sequencing analysis, the median depth of coverage was 6219 times (range: 1065-14 188). No STAT3 mutations were detected in 31 AA patients. In contrast, 7 PRCA patients without T-LGLL and 8 patients with T-LGLL possessed STAT3 mutations (Table 2; Figure 1). Two PRCA patients (UPN 8 and UPN 13) with T-LGLL who were found to be positive for the mutation by the AsPCR were negative by amplicon sequencing. When we manually analyzed the sequencing data of the 2 patients with the IGV software program, the variant allele frequencies (VAFs) of the D661Y mutations in UPN 8 and UPN 13 were 0.563% and 0.560%, respectively. These variants were not considered to have been called by the sequencing because the numbers of sequencing reads were inadequate. The nucleotide substitution patterns of STAT3 are summarized in supplemental Figure 2. The T>A substitution was the most frequent, followed by the C>A and the T>G substitution.
The patients with STAT3 mutations
| Cohort | UPN | Cause of PRCA | STAT3 mutation | ||
|---|---|---|---|---|---|
| Allele-specific PCR | Amplicon (% PB or BM MNCs) | Amplicon (% CD8+ T) | |||
| Nagano/Kanazawa | 47 | Idiopathic | Y640F, D661Y | Y640F (2.9), D661Y (7.3) | Y640F (6), D661Y (13.7) |
| 166 | Idiopathic | — | G618R (7.8), D698H (2) | NT | |
| 182 | CD, SjS | — | R152W (48.9) | NT | |
| 243 | Idiopathic | — | — | D661V (1.9) | |
| 245 | Thymoma | Y640F | Y640F (2.2) | Y640F (15.8) | |
| 399 | Idiopathic | — | S614R (9.1), Y640F (2.3) | NT | |
| 3 | T-LGLL | Y640F, D661Y | Y640F (5.6), D661Y (1.1) | NT | |
| 8 | T-LGLL | D661Y | D661Y (0.96)* | NT | |
| 13 | T-LGLL | D661Y | D661Y (0.57)* | NT | |
| 37 | T-LGLL | Y640F | Y640F (3.1) | NT | |
| 170 | T-LGLL | D661Y | D661Y (1.2) | S614R (1.5),† D661Y (1.2)† | |
| 192 | T-LGLL | — | D661H (4.8) | NT | |
| 194 | T-LGLL | — | — | Y640F (1.1) | |
| 291 | T-LGLL | D661Y | D661Y (2.5) | D661Y (3) | |
| 293 | T-LGLL | — | — | Y640F (2.5) | |
| Akita | 452 | Thymoma | — | F174V (1.9), S614R (8) | NT |
| 453 | Idiopathic | Y640F | D170G (6.4), Y640F (1.5) | NT | |
| 455 | T-LGLL | — | S614R (25.9) | NT | |
—, not detected; CD, Crohn's disease; NT, not tested; PB, peripheral blood; SjS, Sjögren syndrome; UPN, unique patient number.
The percentage of STAT3-mutated DNA, as determined by an allele-specific quantitative PCR.
CD8+ T cells were sorted from BM MNCs.
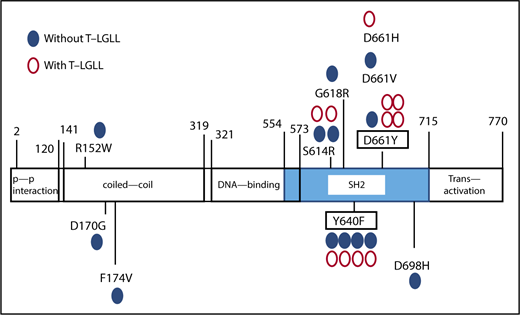
The distribution of STAT3 mutations. Blue closed circles represent the sites of STAT3 mutation in PRCA without T-LGLL; red open circles represent the mutations in PRCA without T-LGLL.
The distribution of STAT3 mutations. Blue closed circles represent the sites of STAT3 mutation in PRCA without T-LGLL; red open circles represent the mutations in PRCA without T-LGLL.
Amplicon sequencing detected STAT3 mutations in the sorted CD8+ T cells but not in the CD4+ T cells from 7 PRCA patients from whom MNCs were available for cell sorting (Figure 2). Three patients (UPN 194, 243 and 293) whose MNC-derived DNA was negative for STAT3 mutations were found be positive when their sorted CD8+ T cells were analyzed (Table 2). The sorted CD8+ T cells from 7 AA patients who responded to immunosuppressive therapy and from 4 healthy control subjects were negative for STAT3 mutations.
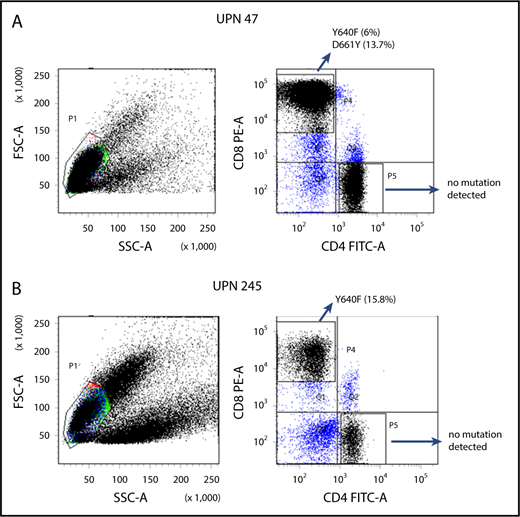
Representative examples of scatterplots of sorted lymphocytes and the results of amplicon sequencing for the STAT3 genes in sorted fractions.STAT3 mutations were not found in CD4+ T-cell fractions but were found in CD8+ T-cell fractions of UPN 47 (A; idiopathic PRCA) and UPN 245 (B; thymoma-associated PRCA). FITC-A, fluorescein isothiocyanate–area; FSC-A, forward scatter–area; PE-A, phycoerythrin-area; SSC-A, side scatter–area.
Representative examples of scatterplots of sorted lymphocytes and the results of amplicon sequencing for the STAT3 genes in sorted fractions.STAT3 mutations were not found in CD4+ T-cell fractions but were found in CD8+ T-cell fractions of UPN 47 (A; idiopathic PRCA) and UPN 245 (B; thymoma-associated PRCA). FITC-A, fluorescein isothiocyanate–area; FSC-A, forward scatter–area; PE-A, phycoerythrin-area; SSC-A, side scatter–area.
A total of 88% of the identified mutations were located in the STAT3 SH2 domain. All mutations in Figure 1 were confirmed by Sanger sequencing, an AsPCR and/or second amplicon sequencing of another library prepared from the same DNA samples. In total, STAT3 mutations were detected in 8 of 29 PRCA patients without T-LGLL (28%) and 10 of 13 PRCA patients with T-LGLL (77%).
The chronological analysis of STAT3 mutations
Serial blood samples from 2 PRCA patients were available for amplicon sequencing of sorted CD8+ T-cell fractions. A patient with idiopathic PRCA (UPN243) showed a D661V mutation that had persisted and expanded (supplemental Figure 3A). The STAT3 mutational profiles of another patient with T-LGLL–associated PRCA (UPN 3) significantly changed over the course (supplemental Figure 3B). These results suggest potential heterogeneities and clonal dynamics of STAT3-mutated CD8+ T cells in PRCA.
Differences in the clinical characteristics of PRCA patients according to STAT3 mutations
The demographic information of the PRCA patients with or without T-LGLL in the Nagano and Kanazawa cohorts are summarized in Table 3. Although PRCA patients with T-LGLL had more lymphocytes (P = .000062) and CD8+ T cells (P = .0000031), other parameters, including the VAFs of STAT3 mutations, did not differ to a statistically significant extent.
The comparison of PRCA with and without T-LGLL
| Without PRCA, | With PRCA, | P | |
|---|---|---|---|
| T-LGLL, n = 18 | T-LGLL, n = 11 | ||
| Lymphocytes, median (range), ×109/L | 1.32 (0.31-2.27) | 4.12 (0.95-7.50) | 6.2 × 10⁻⁵* |
| CD8+ T cells, median (range), ×109/L | 0.34 (0.22-0.80) | 3.33 (0.87-5.51) | 3.1 × 10⁻⁶* |
| Reticulocytes, median (range), ×109/L | 7.1 (0-27.8) | 12.8 (4.8-23.4) | .12 |
| LD, median (range), IU/L | 197 (137-351) | 194 (159-350) | .8 |
| Erythroblasts in BM, median (range), % | 0.8 (0-5.2) | 1.4 (0.2-4.4) | .47 |
| TCRγ monoclonality | 3/18 | 11/11 | 2.3 × 10⁻⁶* |
| Skewed TCRβ repertoire | 3/10 | 6/7 | .049* |
| Therapy | |||
| CsA | 11 | 10 | .26 |
| Steroid | 6 | 3 | 1 |
| CY | 1 | 5 | .019* |
| Multiple | 3 | 5 | .2 |
| STAT3 | |||
| Mutated | 6 | 9 | .021* |
| Mutated in SH2 domain | 5 | 7 | .12 |
| VAF in PBMNC, median (range), % | 5.1 (2.0-48.9) | 1.9 (0.57-5.6) | .083 |
| AsPCR+ | 2 | 6 | .033* |
CsA, cyclosporine A; CY, cyclophosphamide; LD, lactate dehydrogenase; TCR, T-cell receptor; VAF, variant allele frequency.
Significantly different.
When the clinical characteristics of STAT3 mutation–positive [STAT3 mutation(+)] and STAT3 mutation–negative [STAT3 mutation(−)] PRCA patients were compared, the STAT3 mutation(+) patients had more lymphocytes, more CD8+ T cells, and more frequent TCRγ rearrangements (Table 4) than the STAT3 mutation(−) patients. In addition, the response rate to cyclosporine A (CsA) treatment in the STAT3 mutation(+) patients was significantly lower than that in the STAT3 mutation(−) patients (46% [6 of 13] vs 100% [8 of 8]; P = .0092). Two STAT3 mutation(+) patients acquired resistance to CsA, whereas all 8 STAT3 mutation(−) patients remained responsive to CsA. Even when patients with T-LGLL were excluded, the STAT3 mutation(+) patients tended to be less responsive to CsA in comparison with STAT3 mutation(−) patients (40% [2 of 5] vs 100% [6 of 6]; P = .061).
PRCA in patients with and without STAT3 mutations
| PRCA with STAT3 mutation, n = 15 | PRCA without STAT3 mutation, n = 14 | P | |
|---|---|---|---|
| Age, median (range), y | 63 (20-74) | 73 (48-82) | .026* |
| Male, n (%) | 3 (20) | 5 (36) | .43 |
| WBC, median (range), ×109/L | 4.31 (2.25-19.1) | 4.73 (2.88-10.9) | .81 |
| Neutrophils, median (range), ×109/L | 1.57 (0.67-13.2) | 2.92 (0.72-8.74) | .13 |
| Lymphocytes, median (range), ×109/L | 2.83 (0.50-7.50) | 1.50 (0.31-4.12) | .044* |
| CD8+ T cells, median (range), ×109/L | 2.30 (0.22-5.51) | 0.34 (0.20-3.33) | .0034* |
| Hemoglobin, median (range), g/L | 75 (42-100) | 62 (40-92) | .045* |
| Reticulocytes, median (range), ×109/L | 15.9 (0-27.8) | 7.3 (2.3-16.7) | .13 |
| Platelets, median (range), ×109/L | 295 (113-584) | 300 (168-426) | .62 |
| LD, median (range), IU/L | 198 (159-350) | 193 (137-351) | .74 |
| Erythroblasts in BM, median (range), % | 1.2 (0.2-4.3) | 0.6 (0-5.2) | .53 |
| TCRγ monoclonality | 11/15 | 3/14 | .0092* |
| Skewed TCRβ repertoire | 9/10 | 0/6 | .00087* |
| Refractory to CsA | 9/13† | 0/8 | .0046* |
Significantly different.
Seven patients were refractory to CsA, and 2 became secondarily resistant to CsA.
The prevalence of STAT3 mutations in the different PRCA subtypes
STAT3 mutations were found in 5 of 15 patients with idiopathic PRCA (33%), 2 of 7 patients with thymoma-associated PRCA (29%), 1 of 5 patients with autoimmune disease–associated PRCA (20%), and 10 of 13 patients with T-LGLL–associated PRCA (77%) (Table 2). Thus, it was confirmed that STAT3 mutations were frequently present in PRCA patients, irrespective of the etiology.
The TCRVβ repertoire and the TCRγ gene rearrangements of PRCA patients with or without STAT3 mutations
Because STAT3 mutations were detected in PRCA patients without T-LGLL, we analyzed the TCRVβ repertoire of the CD8+ T cells of 3 PRCA patients without T-LGLL. The patients’ samples were taken during the treatment of PRCA with immunosuppressants. All patients had skewed TCRVβ repertoires (supplemental Figure 4). We then analyzed 13 more PRCA patients, including patients with T-LGLL, and found that abnormal TCRVβ patterns were more frequently found in STAT3 mutation(+) patients than in STAT3 mutation(−) patients (supplemental Table 6; 90% vs 0%; P = .00087). All patients but 1 (UPN293) with abnormal TCRVβ patterns were positive for TCRγ gene rearrangements.
STAT3 mutations in sorted T-cell subsets
We sorted T-cell subsets from 2 PRCA patients with altered TCR Vβ repertoires and analyzed them with amplicon sequencing (supplemental Figure 5A-B). The Y640F mutation was found in the CD4−8+Vβ2+ population but not in the CD4−8+Vβ5.1+ population of UPN 47. The D661V mutation was exclusively detected in the CD4−8+Vβ1+ population of UPN 243. To examine whether the STAT3 mutations were limited to lymphoid lineage cells, we also performed amplicon sequencing of sorted granulocyte DNA from 2 PRCA patients who were positive for STAT3 mutations. UPN 243 with idiopathic PRCA not carrying T-LGLL was positive for D661V whereas UPN 3 with LGLL was positive for E166Q, Y640F, and K658R. None of the STAT3 mutations were detected in the granulocytes of the 2 patients (supplemental Figure 6A-B).
Discussion
Our study revealed STAT3 mutations in 18 of 42 PRCA patients (43%) with or without T-LGLL. STAT3 mutations were exclusively detected in the CD8+ T cells of the 4 STAT3 mutation(+) PRCA (2 without T-LGLL and 2 with T-LGLL) patients whose MNCs were available for cell sorting (Table 2). The VAFs of STAT3 mutations in MNCs ranged from 0.0057 to 0.489. This study is the first to reveal that STAT3 mutations were frequent (28%), even in PRCA patients without T-LGLL, in a large cohort.
Balasubramanian et al recently reported the results of targeted sequencing for PRCA patients with and without T-LGLL.25 They detected STAT3 mutations in 5 of 11 patients with T-LGLL–associated PRCA but not in any of 17 patients with idiopathic PRCA. Shi et al reported that PRCA was seen exclusively in the STAT3 wild-type T-LGLL group, and that patients harboring STAT3 mutations were more prone to developing rheumatoid arthritis (RA) than STAT3 wild-type patients.26 The failure to detect STAT3 mutations in PRCA patients might have been due to the small number of PRCA patients (6 patients) who were included in the study. Alternatively, the absence of STAT3 mutations in patients with PRCA may be due to the ethnic background of the patients. T-LGLL is known to be frequently accompanied by RA or neutropenia in western countries, whereas PRCA is frequently associated with T-LGLL in east Asian populations.5,12,27,28
In patients with acquired AA, another T-cell–mediated BMF,29 STAT3 mutations have been rarely detected, whereas mutations in myeloid malignancy-associated genes, such as BCOR/BCORL1, DNMT3A, and ASXL1 have frequently been detected in granulocytes; however, T cells have not been extensively analyzed.30 A recent study of 140 AA patients by Jerez et al revealed STAT3 mutations in 10 patients (7%) without apparent LGL clones.6 In contrast, our analyses failed to detect STAT3 mutations in any of 52 AA patients, suggesting that STAT3 mutation(+) T cells had little impact on the development of AA in Japanese patients. Racial differences and/or the limited number of AA patients we studied could be the reasons for the difference in the STAT3 mutation frequency of AA patients.
The nucleotide substitution patterns of STAT3 genes in PRCA, including T-LGLL (supplemental Figure 2), were distinct from those in AA (reported in a previous study), in which the C to T transition, frequently seen as an age-related change, was prominent.30 In our patient cohort, 78% of the STAT3 mutations were located within the SH-2 domain, among which, S614R, G618R, Y640F, D661Y, and D661V have been demonstrated to be activating mutations1,31,32 ; other mutations, including D661H and D698H, were also considered to be deleterious mutations based on the estimation of CADD33 (supplemental Table 7).
STAT3 mutations have been implicated in various disease conditions, such as somatic mutations in T-LGLL, and germ line mutations in pediatric lymphoproliferative disorders associated with multiorgan autoimmune disieases.34-36 Outside of the SH2 domain, mutations in the coiled-coil domain or the transactivation domain of STAT3 were reported to work as gain-of-function mutations, either as somatic or germ line mutations; however, loss-of-function germ line mutations were found by other groups.37,38 The R152W mutation, as a germ line mutation, was associated with autoimmune cytopenia, insulin-dependent diabetes mellitus, and pediatric lymphoproleferation.35 On the other hand, Y640F and D661Y are both oncogenic, and the activation status of STAT3 with these mutations was enhanced by cytokine signaling in anaplastic large cell lymphoma cells.31,39 In mouse models, STAT3 mutations were not sufficient to cause lymphomagenesis.40,41 STAT3 mutations in ATL/L were found to be associated with better survival.4 Considering these results, STAT3 mutations likely have a unique role in the pathogenesis in T-cell lymphoma. STAT3 mutations may also be involved in the altered regulations of several cytokines in T cells. Germ line STAT3 mutations in lymphoproliferative disorders complicated by autoimmune diseases lead to the loss of phosphorylated STAT5 and STAT1 that potentially affects cytokines signaling.35 However, it is still unclear whether STAT3-mutated T cells have an inhibitory effect on erythroid cell production. Because STAT3 mutations could develop in T cells that were chronically stimulated by inflammatory cytokines or various antigens,42,43 the presence of STAT3-mutated T cells may be an epiphenomenon rather than pathogenic. The mutational process in the STAT3 gene and the functional aspects of STAT3-mutated T cells in PRCA thus require further investigation.
STAT3 mutations in T cells were found not only in idiopathic PRCA and autoimmune disorder–related PRCA but also in thymoma-associated PRCA. The higher frequency of STAT3 mutations in patients with idiopathic or thymoma-associated PRCA in comparison with patients with autoimmune disease–related PRCA suggests that the former is primarily T-cell–mediated whereas the latter may be mostly antibody mediated; however, the number of patients in each subset was too small to allow a statistical analysis. Thymoma has been reported to be associated with several autoimmune diseases other than PRCA, including myasthenia gravis.44 Thymectomy has been the mainstay treatment of PRCA patients with thymoma.22 In some cases, management with immunomodulatory and/or immunosuppressive agents was effective in the treatment of autoimmune disorders with thymoma,45 which implies that immune dysfunction is involved in the complications of thymoma. The presence of STAT3-mutated CD8+ T cells may thus be a clue to the unique background of PRCA, irrespective of disease etiology.
Among 29 PRCA patients whose clinical and laboratory data were available, 14 patients (48%) were negative for STAT3 mutations. Apart from the high frequency of T-cell clonality and STAT3 mutations, the laboratory characteristics of 18 patients without T-LGLL did not differ from those of 11 PRCA patients with T-LGLL to a statistically significant extent. Although 3 PRCA patients (UPNs 47, 243, and 245) had clonal T-cell populations, as demonstrated by the TCRVβ repertoire and TCR gene-rearrangement analyses, the estimated number of LGLs calculated from the percentage of each TCRVβ family (0.16 × 10⁹/L, 0.29 × 10⁹/L, and 0.08 × 10⁹/L) was far less than the number required to diagnose T-LGLL (0.5 × 10⁹/L) according to the revised criteria for LGL leukemia.17
Patients who were positive for STAT3 mutations possessed unique clinical features in terms of age (younger) and responsiveness to CsA (less responsive in comparison with patients who were negative for STAT3 mutations). Of note, 4 of 8 STAT3 mutation(+) patients who were refractory to CsA were treated with cyclophosphamide (CY) and all of them responded well, whereas none of 8 STAT3 mutation(−) patients required secondary treatment with CY due to a sustained response to CsA. STAT3 mutations may thus represent a prognostic indicator for PRCA. STAT3-mutated CD8+ T cells may be less sensitive to the inhibitory effects of CsA than nonmutated CD8+ T cells.
In conclusion, STAT3 mutations are frequently detected in the CD8+ T cells of PRCA patients, regardless of the presence of T-LGLL. The identification of STAT3 mutations may be useful for appropriately managing patients with PRCA.
The full-text version of this article contains a data supplement.
Acknowledgments
The authors thank Noriko Senoo of Shinshu University, Hikaru Kobayashi of Nagano Red Cross Hospital, Kumiko Shiraharta of Iida Municipal Hospital, Yoichi Koizumi of Asama Nanroku Komoro Medical Center, Toshiharu Yujiri of Yamaguchi University, and Taizo Shimomura of Kumamoto Shinto General Hospital for providing the patient data. The authors also thank Toshiya Otsuka for technical assistance.
This work was supported in part by the Japan Agency for Medical Research and Development (AMED) under grant number JP18ek0109272.
Authorship
Contribution: T. Kawakami designed the study, performed experiments, and analyzed the data; N.S. designed the study, collected clinical data, and analyzed the data; J.K., K.M., and T.Y. performed experiments; T. Imi, S. Nishina, Y.S., H.S., T. Ito, T. Koizumi, M.H., S. Nakao, H.N., and F.I. collected samples and clinical data; F.I. conceived and designed the study, analyzed the data, and supervised the research; and T. Kawakami, S. Nakao, H.N., and F.I. wrote the manuscript.
Conflict-of-interest disclosure: The authors declare no competing financial interests.
Correspondence: Fumihiro Ishida, Department of Biomedical Laboratory Sciences, School of Medicine, Shinshu University, Matsumoto, Japan; e-mail: fumishi@shinshu-u.ac.jp; and Shinji Nakao, Department of Hematology, Faculty of Medical Science, Institute of Medical, Pharmaceutical and Health Sciences, Kanazawa University, Kanazawa, Japan; e-mail: snakao8205@staff.kanazawa-u.ac.jp.

