

Key Points
Gfi1aa and Gfi1b suppress endothelial and promote late erythroid gene expression in immature primitive erythroblasts.
In their absence, primitive erythroblast differentiation from mesenchymal hemangioblasts is severely delayed, but not completely blocked.

Abstract
The transcriptional repressors Gfi1(a) and Gfi1b are epigenetic regulators with unique and overlapping roles in hematopoiesis. In different contexts, Gfi1 and Gfi1b restrict or promote cell proliferation, prevent apoptosis, influence cell fate decisions, and are essential for terminal differentiation. Here, we show in primitive red blood cells (prRBCs) that they can also set the pace for cellular differentiation. In zebrafish, prRBCs express 2 of 3 zebrafish Gfi1/1b paralogs, Gfi1aa and Gfi1b. The recently identified zebrafish gfi1aa gene trap allele qmc551 drives erythroid green fluorescent protein (GFP) instead of Gfi1aa expression, yet homozygous carriers have normal prRBCs. prRBCs display a maturation defect only after splice morpholino-mediated knockdown of Gfi1b in gfi1aaqmc551 homozygous embryos. To study the transcriptome of the Gfi1aa/1b double-depleted cells, we performed an RNA-Seq experiment on GFP-positive prRBCs sorted from 20-hour-old embryos that were heterozygous or homozygous for gfi1aaqmc551, as well as wt or morphant for gfi1b. We subsequently confirmed and extended these data in whole-mount in situ hybridization experiments on newly generated single- and double-mutant embryos. Combined, the data showed that in the absence of Gfi1aa, the synchronously developing prRBCs were delayed in activating late erythroid differentiation, as they struggled to suppress early erythroid and endothelial transcription programs. The latter highlighted the bipotent nature of the progenitors from which prRBCs arise. In the absence of Gfi1aa, Gfi1b promoted erythroid differentiation as stepwise loss of wt gfi1b copies progressively delayed Gfi1aa-depleted prRBCs even further, showing that Gfi1aa and Gfi1b together set the pace for prRBC differentiation from hemangioblasts.
Introduction
During vertebrate embryogenesis, blood cells form from the mesoderm in distinct waves of hematopoiesis.1-4 During the primitive wave, primitive red blood cells (prRBCs) arise from mesenchymal hemangioblasts, bipotent progenitors for blood and endothelial cells (ECs).5 The following waves develop from epithelial, hemogenic endothelial cells (HECs) that undergo endothelial to hematopoietic transition (EHT).6-15 They give rise to predefinitive blood progenitors and definitive hematopoietic stem cells (HSCs) that maintain the blood system throughout life.
In zebrafish, prRBCs and ECs form from hemangioblasts16-20 and develop in the posterior lateral mesoderm (PLM).21-25 PLM cells migrate to the midline to form the intermediate cell mass of the trunk and its posterior extension, the posterior blood island of the tail. In the midline, prRBCs mature and ECs form the axial trunk vessel, the dorsal aorta (DA), and the posterior cardinal vein.25-28 Once circulation is established, HECs in the ventral wall of the DA (vDA)29-32 generate hematopoietic stem and progenitor cells that seed the larval caudal hematopoietic tissue (CHT) and eventually the kidney marrow (KM), the adult site of hematopoiesis.33-36
We recently identified the zebrafish gene trap line qmc551, which expresses a GFP reporter in developing prRBCs and in HECs of the vDA. The latter undergo EHT and their progeny seed the CHT and the KM.37 In qmc551, the gene trap transposon is inserted in intron 1 of gfi1aa, 1 of 3 paralogous zebrafish gfi1/1b genes. While gfi1aa and gfi1ab are homologous to mouse Gfi1,38,39 gfi1b corresponds to mouse Gfi1b.40 Gfi1/1b genes encode transcription factors (TFs) with a conserved N-terminal repressor domain, called the SNAG domain, a variant linker and a conserved C-terminal Zn-finger DNA binding domain.41-43 In mouse and humans, Gfi1/1b play multiple important roles during hematopoiesis.44,45 In different contexts, they block or promote cell proliferation, inhibit apoptosis, influence cell fate, and ensure terminal differentiation. Here, we show that they can also determine the speed of cellular differentiation.
In the qmc551 allele, the gene trap transposon interferes with the transcription of gfi1aa in embryonic and adult hematopoietic cells. Nevertheless, qmc551 homozygous (qmc551hom) fish are viable and fertile,37 probably because of functional redundancy between Gfi1/1b paralogues. In HECs of the vDA, gfi1ab expression is induced in the absence of Gfi1aa. In prRBCs, maturation defects are only observed upon splice-morpholino (MO)–mediated knockdown of Gfi1b in qmc551hom embryos.37 Here, we combined an RNA-Seq analysis on gfi1aa-mutant and gfi1b-morphant prRBCs with whole-mount in situ hybridization (WISH) experiments on novel mutant zebrafish lines to functionally analyze the genetic interaction between gfi1aa and gfi1b during primitive erythropoiesis. Our experiments reveal that Gfi1aa and Gfi1b set the pace for prRBC differentiation.
Methods
Zebrafish experiments
Zebrafish were kept as described in the zebrafish book.46 Genetically altered zebrafish are listed in supplemental Table 1. All animal procedures were performed under the authority of the UK Home Office project licenses 40/3457, 40/3708, 30/3356, and 30/3378.
RNA-sequencing and bioinformatics
Embryos were dissociated using Liberase Blendzyme (Roche). GFP+ cells were isolated by fluorescence activated cell sorting and subsequently lysed as described previously.37 Genomic DNA was eliminated using genomic DNA eliminator columns, and total RNA was isolated using RNAeasy MinElute spin columns (Qiagen). Full-length cDNA was generated and amplified using the SMART-Seq v4 Ultra Low Input RNA kit for sequencing (Takara). Sequencing libraries were prepared from full-length cDNA using Nextera XT library preparation kit (Ilumina). Sequencing was done on an Illumina NextSeq500 sequencing platform using 2 × 75 bp V2 chemistry. Reads were trimmed to remove adaptor and low-quality sequences using Scythe and Sickle algorithms. The trimmed read sequences are available from the European Nucleotide Archive under accession number PRJEB25583. Trimmed reads were subsequently filtered to remove tRNA and rRNA sequences. Quality filtered reads were mapped onto the zv9 zebrafish reference genome, using TopHat. The read alignments were recorded in BAM formatted alignment files. Bam files were analyzed using the Integrative Genomics Viewer and SeqMonk. Raw and normalized read counts for each gene were calculated.47
Gene targeting
Gene targeting was performed using TALEN and CRISPR/Cas9 technologies.48,49 Target sites for Cas9 were identified using the CRISPRscan algorithm.50 Guide RNAs and Cas9 mRNA were in vitro transcribed and coinjected into 1-cell-stage embryos. For genotyping, genomic DNA was isolated from fin clips and embryos and used as a template for PCR amplification. All primers are listed in supplemental Tables 6 and 8.
Phenotype analysis
Results
Increased gfi1aa promoter activity in 20-hour-old Gfi1aa- and Gfi1aa/1b-depleted primitive erythroblasts
To reveal the deficiencies in the early programming of Gfi1aa- and/or Gfi1b-depleted prRBCs, an RNA-Seq experiment was performed on GFP+ prRBCs isolated from 20 hours postfertilization (hpf) embryos that were heterozygous or homozygous for qmc551, as well as wt or morphant for gfi1b (Figure 1A). At this stage, qmc551:GFP fluorescence is robust and restricted to prRBCs (Figure 1B). RNA-Seq reads were mapped to the zebrafish genome. After initial quality checks (Figure 1C), we examined the relative expression of gfi1aa and gfi1b mRNAs in our samples. For this purpose, we visualized raw read count differences in samples with similar overall read counts (Figure 1D-E) and compared averaged normalized read counts calculated from all replicates (Figure 1F-G). Both sets of data showed that there is a 10-fold reduction of gfi1aa mRNA levels in qmc551hom erythroblasts relative to qmc551het cells (Figure 1D,G). Combined with the previous finding that gfi1aa mRNA levels are halved in qmc551het relative to wt blood cells,37 this suggests that qmc551hom prRBCs express gfi1aa at 5% of the wt level. Although raw read counts for gfi1b were similar over most exons, exon 4 was an exception. Its read counts were clearly reduced in the gfi1b-morphant samples (Figure 1E), confirming previous reverse transcription polymerase chain reaction (RT-PCR) data on RNA isolated from embryos injected with the gfi1b exon 4 splice MOs.37 The loss of exon 4 reads was almost complete in the qmc551homMO erythroblasts (96%), but less optimal in the qmc551hetMO cells (66%) (Figure 1E), most likely reflecting variability between MO injections.
![Figure 1. Gfi1aa and wild-type gfi1b transcript levels are severely reduced in primitive erythroblasts of qmc551 homozygous and gfi1b MO-injected zebrafish embryos, respectively. (A) Diagram summarizing the experimental strategy of the transcriptome analysis. (B) Image of a 20-hpf gfi1aaqmc551het zebrafish embryo taken on a fluorescent dissecting microscope with a fluorescein isothiocyanate filter set. Brackets highlight GFP+ cells in the intermediate cell mass (ICM) and in the posterior blood island (PBI). (C) Quality checks performed on the sequencing reads using the SeqMonk DNA Sequence Analyzer. The analysis gives the percentage of reads that map to annotated genes and the percentage of the latter that are located in exons, as well as the percentage of reads that match ribosomal RNA (rRNA) or mitochondrial DNA (MT) sequences. As expected for paired-end reads, 50% of the reads represent the sense strand. (D) Tracks showing the number of raw base read counts over the nucleotide sequences of exons 2 to 7 of gfi1aa in the representative samples Het1 and Hom3. These 2 samples had similar overall numbers of sequence reads (63.1 and 64.7 million reads, respectively) and can, therefore, be compared without additional normalization. (E) Tracks showing the raw base counts over the sequence of gfi1b in representative samples Het1, HetMO3, Hom3, and HomMO1. For the morphant samples HetMO1-3 and HomMO1-3, raw base counts over 10 nucleotides at the end of exon 3 (EE3), the beginning of exon 4 (BE4), the end of exon 4 (EE4), and the start of exon 5 (BE5) were averaged. The ratios of BE4/EE3 and EE4/BE5 were calculated and averaged. Similarly, the ratios of BE5/EE3 were determined and averaged. The average ratios are shown above the arrows in the figure. They give a good estimate of the ratio of gfi1b transcripts with and without exon 4 in the 2 morphant samples. To generate the images shown in panels D-E, the BAM files were imported into the Integrated Genome Viewer (IGV_2.3.72). (F-H) Bar charts comparing the average normalized transcript levels (read per kilobase of transcript per 1 million mapped reads [RPKM values]) for gfi1b (F), gfi1aa (exons 2-7, G), and qmc551:gfp (gfp sequence only, H) in 551het, 551hetMO, 551hom, and 551homMO samples. Sequence reads over exon 1 of gfi1aa were excluded as they cannot be allocated unambiguously to the gfi1aa or the qmc551:gfp transcript. On GraphPad Prism, Welch’s t test was used to examine the statistical significance of the differences between the mean expression values (*P<.05; **P<.01; ***P<.001; ****P<.0001). FAC, fluorescence-activated cell.](https://ash.silverchair-cdn.com/ash/content_public/journal/bloodadvances/2/20/10.1182_bloodadvances.2018020156/4/m_advances020156f1.png?Expires=1763472804&Signature=abhU7wClCaJzWOjTgWmKU8QxAFrh1gedpD2dXMSmrviBqaqwHwulJHls6UTBKXxkHuNV2IoOWVsnAmPjzbOHJLOACJSElkR6mB6RJCCQyibPlu~fyEHeimfTQvkkdq79FoGw0wx8DZbdVJ7anaWlhgvJXnpC3KzetkH11vT4dCOdAl8rx~RlEUFjKx5StEcc0bRc3qcqN3AaxSjB-Fiv2KWWn5ArnaxHxbvf4aDLkReh6e9wZNY8DI3pVC9C~3Utr9DXgz5HlZ4UJef8z5cNNxYTP6VZKIkw32qgXFEzVrrm3qZFL-USKYxO6Z~woCkiSP9u6tgS10QALfOiGDSLZA__&Key-Pair-Id=APKAIE5G5CRDK6RD3PGA)
Gfi1aa and wild-type gfi1b transcript levels are severely reduced in primitive erythroblasts of qmc551 homozygous and gfi1b MO-injected zebrafish embryos, respectively. (A) Diagram summarizing the experimental strategy of the transcriptome analysis. (B) Image of a 20-hpf gfi1aaqmc551het zebrafish embryo taken on a fluorescent dissecting microscope with a fluorescein isothiocyanate filter set. Brackets highlight GFP+ cells in the intermediate cell mass (ICM) and in the posterior blood island (PBI). (C) Quality checks performed on the sequencing reads using the SeqMonk DNA Sequence Analyzer. The analysis gives the percentage of reads that map to annotated genes and the percentage of the latter that are located in exons, as well as the percentage of reads that match ribosomal RNA (rRNA) or mitochondrial DNA (MT) sequences. As expected for paired-end reads, 50% of the reads represent the sense strand. (D) Tracks showing the number of raw base read counts over the nucleotide sequences of exons 2 to 7 of gfi1aa in the representative samples Het1 and Hom3. These 2 samples had similar overall numbers of sequence reads (63.1 and 64.7 million reads, respectively) and can, therefore, be compared without additional normalization. (E) Tracks showing the raw base counts over the sequence of gfi1b in representative samples Het1, HetMO3, Hom3, and HomMO1. For the morphant samples HetMO1-3 and HomMO1-3, raw base counts over 10 nucleotides at the end of exon 3 (EE3), the beginning of exon 4 (BE4), the end of exon 4 (EE4), and the start of exon 5 (BE5) were averaged. The ratios of BE4/EE3 and EE4/BE5 were calculated and averaged. Similarly, the ratios of BE5/EE3 were determined and averaged. The average ratios are shown above the arrows in the figure. They give a good estimate of the ratio of gfi1b transcripts with and without exon 4 in the 2 morphant samples. To generate the images shown in panels D-E, the BAM files were imported into the Integrated Genome Viewer (IGV_2.3.72). (F-H) Bar charts comparing the average normalized transcript levels (read per kilobase of transcript per 1 million mapped reads [RPKM values]) for gfi1b (F), gfi1aa (exons 2-7, G), and qmc551:gfp (gfp sequence only, H) in 551het, 551hetMO, 551hom, and 551homMO samples. Sequence reads over exon 1 of gfi1aa were excluded as they cannot be allocated unambiguously to the gfi1aa or the qmc551:gfp transcript. On GraphPad Prism, Welch’s t test was used to examine the statistical significance of the differences between the mean expression values (*P<.05; **P<.01; ***P<.001; ****P<.0001). FAC, fluorescence-activated cell.
Gfi1aa and wild-type gfi1b transcript levels are severely reduced in primitive erythroblasts of qmc551 homozygous and gfi1b MO-injected zebrafish embryos, respectively. (A) Diagram summarizing the experimental strategy of the transcriptome analysis. (B) Image of a 20-hpf gfi1aaqmc551het zebrafish embryo taken on a fluorescent dissecting microscope with a fluorescein isothiocyanate filter set. Brackets highlight GFP+ cells in the intermediate cell mass (ICM) and in the posterior blood island (PBI). (C) Quality checks performed on the sequencing reads using the SeqMonk DNA Sequence Analyzer. The analysis gives the percentage of reads that map to annotated genes and the percentage of the latter that are located in exons, as well as the percentage of reads that match ribosomal RNA (rRNA) or mitochondrial DNA (MT) sequences. As expected for paired-end reads, 50% of the reads represent the sense strand. (D) Tracks showing the number of raw base read counts over the nucleotide sequences of exons 2 to 7 of gfi1aa in the representative samples Het1 and Hom3. These 2 samples had similar overall numbers of sequence reads (63.1 and 64.7 million reads, respectively) and can, therefore, be compared without additional normalization. (E) Tracks showing the raw base counts over the sequence of gfi1b in representative samples Het1, HetMO3, Hom3, and HomMO1. For the morphant samples HetMO1-3 and HomMO1-3, raw base counts over 10 nucleotides at the end of exon 3 (EE3), the beginning of exon 4 (BE4), the end of exon 4 (EE4), and the start of exon 5 (BE5) were averaged. The ratios of BE4/EE3 and EE4/BE5 were calculated and averaged. Similarly, the ratios of BE5/EE3 were determined and averaged. The average ratios are shown above the arrows in the figure. They give a good estimate of the ratio of gfi1b transcripts with and without exon 4 in the 2 morphant samples. To generate the images shown in panels D-E, the BAM files were imported into the Integrated Genome Viewer (IGV_2.3.72). (F-H) Bar charts comparing the average normalized transcript levels (read per kilobase of transcript per 1 million mapped reads [RPKM values]) for gfi1b (F), gfi1aa (exons 2-7, G), and qmc551:gfp (gfp sequence only, H) in 551het, 551hetMO, 551hom, and 551homMO samples. Sequence reads over exon 1 of gfi1aa were excluded as they cannot be allocated unambiguously to the gfi1aa or the qmc551:gfp transcript. On GraphPad Prism, Welch’s t test was used to examine the statistical significance of the differences between the mean expression values (*P<.05; **P<.01; ***P<.001; ****P<.0001). FAC, fluorescence-activated cell.
While normalized gfi1b mRNA levels were slightly higher in gfi1b morphants, normalized gfi1aa mRNA levels were increased threefold (Figure 1G). In comparison, qmc551:gfp mRNA levels rose by only 19% (Figure 1H). Overall, qmc551:gfp mRNA was 50-fold more abundant than gfi1aa mRNA. Given that both transcripts initiate at the same promoter, this difference suggests differential mRNA stability. The very modest increase of qmc551:gfp mRNA levels in the gfi1b-morphant prRBCs suggests that the rise in gfi1aa promoter activity was a recent event that is masked in the gfp data by the abundance of preexisting stable gfp mRNA. In the qmc551hom samples, gfp mRNA levels were threefold higher than in the qmc551het samples. This is more than one would expect from a gene dosage effect and may suggest autoregulation of the gfi1aa promoter.
Increased endothelial and decreased erythroid gene expression in 20-hour-old Gfi1aa single- and Gfi1aa/Gfi1b double-depleted primitive erythroblasts
Next, global differences in gene expression were examined. Hierarchical clustering showed that the gene expression changes clearly partitioned the samples into the replicate sets (Figure 2A). A principal component analysis revealed that the gene expression differences between qmc551het and qmc551hom prRBCs were more pronounced than those caused by the absence of Gfi1b (Figure 2B). Principal component 1, which was responsible for most of the variation in the data set, consisted of genes with reduced expression in Gfi1aa-depleted prRBCs (Figure 2B inset). However, not all differentially expressed genes were downregulated in qmc551hom prRBCs. Plotting cumulative raw read counts over the percentile of genes arranged in the order of ascending average expression revealed a remarkable increase in read counts in low to medium expressed genes in qmc551hom relative to qmc551het samples (Figure 2C). Advanced count-based statistics using the DESeq2 method54 confirmed the statistical significance of the described gene expression changes (Figure 2Di). Additional depletion of Gfi1b expression had a notable but milder effect on gene expression (Figure 2Dii).
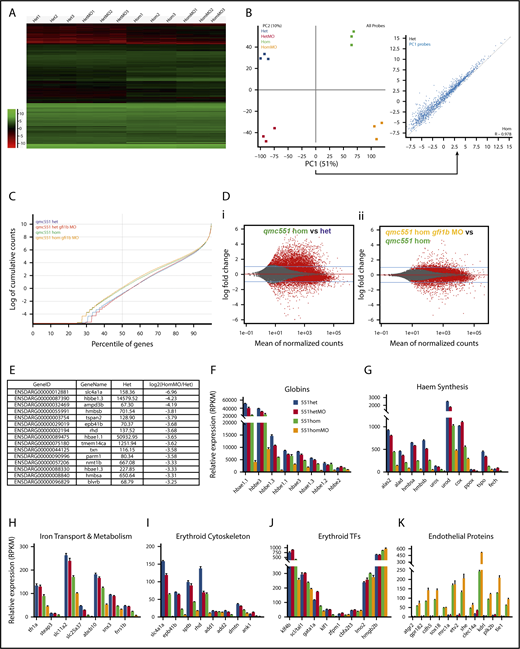
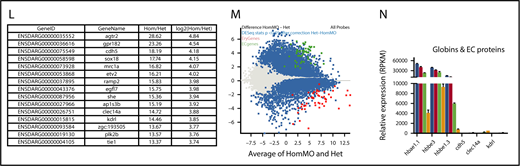
Misregulation of hundreds of genes in Gfi1aa/Gfi1b-depleted primitive erythroblasts isolated from 20 hpf zebrafish embryos. (A) Hierarchical clustering of gene expression data determined for 3 replicate qmc551het, qmc551hetMO, qmc551hom, and qmc551homMO samples. The analysis included the 9785 genes that a DESeq2 analysis had identified as differentially expressed in qmc551het and qmc551homMO prRBCs. The Log2 values of the normalized expression counts are given. (B) Principal component analysis performed on the complete data set of 24 914 genes. The set of 1610 genes that made up principal component 1 allowed the distinction of qmc551het and qmc551hom samples. The scatterplot shown in the inset compares the average expression of these genes in 551het and 551hom samples. (C) The distribution of reads was analyzed by plotting the cumulative read counts for 4 representative samples (qmc551het1, qmc551hetMO3, qmc551hom3, and qmc551homMO1) over the percentiles of genes arranged in the order of ascending average gene expression. (D) A DESeq2 analysis had identified differentially expressed genes among the 24 914 genes analyzed. Here, MA plots (mean fold change over average expression) are shown that report M, the log2 value of the ratio of Hom/Het (left) and of HomMO/Hom (right), over panel A, the log2 value of the average expression in all Hom+Het (left) and HomMO+Hom values (right), for all of the 24 914 genes. All differentially expressed genes are shown in red. These were 8426 and 5081 in Di and Dii, respectively. The MA plot was generated using Bioconductor. (E) List of the top 15 genes with the highest fold decrease in expression in qmc551homMO vs qmc551het samples and an average expression of at least 60 RPKM in qmc551het prRBCs. (F-K) Bar charts comparing the normalized average expression levels of the named erythroid and endothelial genes in qmc551het, qmc551hetMO, qmc551hom, and qmc551homMO prRBCs. The standard deviations are shown. (L) List of the top 15 genes with the highest fold increase in expression in qmc551hom relative to qmc551het samples and an RPKM value of at least 40 in the qmc551hom prRBCs. (M) MA plot plotting genes based on their average expression in qmc551homMO and qmc551het and the mean of the ratio of average qmc551homMO to average qmc551het expression values. Genes are colored in blue when the DESeq2 statistical analysis showed that the differences in raw read counts were significantly different in qmc551homMO and qmc551het prRBCs. Typical endothelial and erythroid genes are highlighted in green and red, respectively. These genes are listed in supplemental Table 5. (N) Bar chart comparing the average normalized expression of the named globin and endothelial protein genes in all 4 sets of replicates. Standard deviations are shown. The bar color coding used in panels F-K and N is explained in panel F.
Misregulation of hundreds of genes in Gfi1aa/Gfi1b-depleted primitive erythroblasts isolated from 20 hpf zebrafish embryos. (A) Hierarchical clustering of gene expression data determined for 3 replicate qmc551het, qmc551hetMO, qmc551hom, and qmc551homMO samples. The analysis included the 9785 genes that a DESeq2 analysis had identified as differentially expressed in qmc551het and qmc551homMO prRBCs. The Log2 values of the normalized expression counts are given. (B) Principal component analysis performed on the complete data set of 24 914 genes. The set of 1610 genes that made up principal component 1 allowed the distinction of qmc551het and qmc551hom samples. The scatterplot shown in the inset compares the average expression of these genes in 551het and 551hom samples. (C) The distribution of reads was analyzed by plotting the cumulative read counts for 4 representative samples (qmc551het1, qmc551hetMO3, qmc551hom3, and qmc551homMO1) over the percentiles of genes arranged in the order of ascending average gene expression. (D) A DESeq2 analysis had identified differentially expressed genes among the 24 914 genes analyzed. Here, MA plots (mean fold change over average expression) are shown that report M, the log2 value of the ratio of Hom/Het (left) and of HomMO/Hom (right), over panel A, the log2 value of the average expression in all Hom+Het (left) and HomMO+Hom values (right), for all of the 24 914 genes. All differentially expressed genes are shown in red. These were 8426 and 5081 in Di and Dii, respectively. The MA plot was generated using Bioconductor. (E) List of the top 15 genes with the highest fold decrease in expression in qmc551homMO vs qmc551het samples and an average expression of at least 60 RPKM in qmc551het prRBCs. (F-K) Bar charts comparing the normalized average expression levels of the named erythroid and endothelial genes in qmc551het, qmc551hetMO, qmc551hom, and qmc551homMO prRBCs. The standard deviations are shown. (L) List of the top 15 genes with the highest fold increase in expression in qmc551hom relative to qmc551het samples and an RPKM value of at least 40 in the qmc551hom prRBCs. (M) MA plot plotting genes based on their average expression in qmc551homMO and qmc551het and the mean of the ratio of average qmc551homMO to average qmc551het expression values. Genes are colored in blue when the DESeq2 statistical analysis showed that the differences in raw read counts were significantly different in qmc551homMO and qmc551het prRBCs. Typical endothelial and erythroid genes are highlighted in green and red, respectively. These genes are listed in supplemental Table 5. (N) Bar chart comparing the average normalized expression of the named globin and endothelial protein genes in all 4 sets of replicates. Standard deviations are shown. The bar color coding used in panels F-K and N is explained in panel F.
Many of the downregulated genes represented late erythroid genes (Figure 2E; supplemental Figure 1). In addition to the globin genes (Figure 2F), they included genes for proteins involved in heme synthesis, iron transport and metabolism, and components of the special erythroid cytoskeleton (Figure 2E-I). Although some TFs known to drive erythroid gene expression were also downregulated, others were relatively unaffected (Figure 2J). Overall, the downregulation of genes appeared to affect all aspects of RBC biology (supplemental Figure 1F).
Many of the upregulated genes encoded proteins with well-defined roles in ECs (Figure 2K-L). Overall, the effects on blood and EC gene expression were mild in gfi1b-morphant cells, strong in gfi1aa-mutant cells, and even stronger in Gfi1aa/1b-double-depleted prRBCs (Figure 2F-K). The differential expression of blood and EC genes (Figure 2M) does not indicate that the Gfi1aa/1b-depleted prRBCs were reprogrammed to be ECs. First, some erythroid genes were still expressed at levels much higher than any EC gene (Figure 2N). Second, the qmc551:GFP+ cells retained their mesenchymal character and entered circulation when the primary circulatory loop was established.37 Thus, the cells were clearly prRBCs, blocked or delayed in erythroid maturation.
Characterization of novel gfi1aa and gfi1b alleles
Next, we validated the transcriptome data in WISH experiments performed on gfi1aa and gfi1b single- and double-mutant embryos. For this purpose, we characterized an additional gfi1aa-mutant (Figure 3, color-coded blue) and generated 2 new gfi1b-mutant lines (Figure 4, color-coded red). The gfi1aasa11633 allele had previously been identified in an ethylnitrosourea mutagenesis screen55 and carries a nonsense mutation in exon 4 of gfi1aa (Figure 3A). The 2 novel gfi1b alleles were generated using TALEN and CRISPR/Cas9 technologies. The TALEN-induced gfi1bsh339 allele harbors a frameshift mutation in exon 3, the gfi1bqmc554 allele a CRISPR/Cas9-induced deletion, and frameshift mutation in exon 4 (Figure 4A).

The qmc551 and sa11633 alleles of gfi1aa. (A) Genomic maps of 2 wild-type and 2 mutant alleles of gfi1aa, including information about transcripts and their splice products. The 2 wt alleles differ in intron 1. Intron 1 of allele wt1 carries a hAT-Tol2 family transposon called DNA8-9_DR whose target site was duplicated upon integration. The duplicated sequences flank the transposon as direct repeats. In the qmc551 allele, the gene trap transposon was inserted into the DNA8-9_DR transposon of the wt1 allele. Please note that most gfi1aaqmc551Gt transcripts terminate behind the gfp reading frame. Splicing between the splice donor at the end of exon 1 and the splice acceptor on the gene trap transposon allows GFP expression from the qmc551 allele.37 The wt2 and sa11633 alleles do not possess transposon insertions in intron 1. Their intron 1 sequence is considerably shorter. The sa11633 allele carries a nonsense mutation in exon 4. Detailed annotations are provided in the inset. (B) The diagram shows the full-length wt Gfi1aa protein with all its functional domains and the truncated Gfi1aa protein encoded by the sa11633 allele. (C) PCR of exon 4 sequences and subsequent DNA sequencing are required to distinguish wt and sa11633 alleles of gfi1aa. The panels show Sanger DNA sequencing reads of the template strand of the wt and sa11633 alleles of gfi1aa. The coding sequence has been added below the sequence read. It shows that the mutation converts the serine145 codon to a premature stop codon. (D) PCR-based genotyping of wt and qmc551 alleles of gfi1aa. In lanes 2 to 7, PCR products are shown that were amplified on genomic DNA samples that did (+) or did not (−) contain the respective gfi1aa allele. The expected wt1, wt2, and qmc551 fragments are 1322, 477, and 491 bp in size. Information on primer sequences is provided in supplemental Table 8. (E-F) Lateral views of embryos stained by WISH. Yellow and green arrows point at gene expression in inner ear hair cells and in the ventral wall of the dorsal aorta, respectively. Numbers of embryos analyzed are provided on the panels.
The qmc551 and sa11633 alleles of gfi1aa. (A) Genomic maps of 2 wild-type and 2 mutant alleles of gfi1aa, including information about transcripts and their splice products. The 2 wt alleles differ in intron 1. Intron 1 of allele wt1 carries a hAT-Tol2 family transposon called DNA8-9_DR whose target site was duplicated upon integration. The duplicated sequences flank the transposon as direct repeats. In the qmc551 allele, the gene trap transposon was inserted into the DNA8-9_DR transposon of the wt1 allele. Please note that most gfi1aaqmc551Gt transcripts terminate behind the gfp reading frame. Splicing between the splice donor at the end of exon 1 and the splice acceptor on the gene trap transposon allows GFP expression from the qmc551 allele.37 The wt2 and sa11633 alleles do not possess transposon insertions in intron 1. Their intron 1 sequence is considerably shorter. The sa11633 allele carries a nonsense mutation in exon 4. Detailed annotations are provided in the inset. (B) The diagram shows the full-length wt Gfi1aa protein with all its functional domains and the truncated Gfi1aa protein encoded by the sa11633 allele. (C) PCR of exon 4 sequences and subsequent DNA sequencing are required to distinguish wt and sa11633 alleles of gfi1aa. The panels show Sanger DNA sequencing reads of the template strand of the wt and sa11633 alleles of gfi1aa. The coding sequence has been added below the sequence read. It shows that the mutation converts the serine145 codon to a premature stop codon. (D) PCR-based genotyping of wt and qmc551 alleles of gfi1aa. In lanes 2 to 7, PCR products are shown that were amplified on genomic DNA samples that did (+) or did not (−) contain the respective gfi1aa allele. The expected wt1, wt2, and qmc551 fragments are 1322, 477, and 491 bp in size. Information on primer sequences is provided in supplemental Table 8. (E-F) Lateral views of embryos stained by WISH. Yellow and green arrows point at gene expression in inner ear hair cells and in the ventral wall of the dorsal aorta, respectively. Numbers of embryos analyzed are provided on the panels.
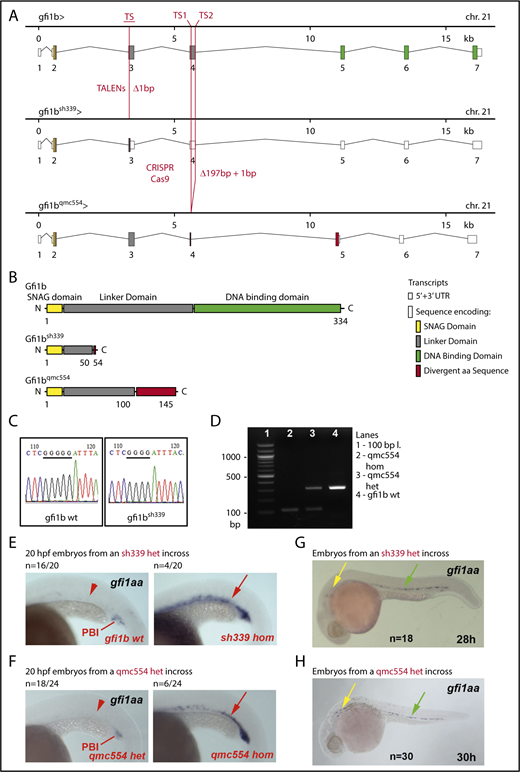
The sh339 and qmc554 alleles of gfi1b. (A) Genomic maps of the wt, sh339, and qmc554 alleles of gfi1b, including information about transcripts and splice products. Additional annotations are provided in the inset. (B) Gfi1b protein products encoded by the wt and the 2 mutant gfi1b mutant alleles. (C) PCR amplification of exon 3 sequences and subsequent sequencing are used to identify sh339 carriers. The panels show examples of Sanger DNA sequencing reads. A missing G in a stretch of 5 consecutive Gs on the template strand defines the sh339 allele. As the mutation in sh339 eliminates a BslI restriction site, a restriction digest can also distinguish wt and mutant gfi1b alleles. (D) PCR amplification of exon 4 sequences distinguishes the wt allele and the deletion allele qmc554 of gfi1b. The expected wt and qmc554 PCR fragments are 305 and 109 bp long. Primer sequences are provided in supplemental Table 8. (E-H) Lateral views of embryos stained by WISH. Yellow, green, and red arrows point at gene expression in inner ear hair cells, in the ventral wall of the dorsal aorta, and in prRBCs, respectively. Red arrowheads highlight the lack of gene expression in prRBCs. Genotyping of 3 of the 10 embryos with elevated gfi1aa expression in panels E-F revealed that they were homozygous mutants. Representative examples are shown. All embryos shown in panels G-H display the same gfi1aa expression pattern, irrespective of their gfi1b genotype.
The sh339 and qmc554 alleles of gfi1b. (A) Genomic maps of the wt, sh339, and qmc554 alleles of gfi1b, including information about transcripts and splice products. Additional annotations are provided in the inset. (B) Gfi1b protein products encoded by the wt and the 2 mutant gfi1b mutant alleles. (C) PCR amplification of exon 3 sequences and subsequent sequencing are used to identify sh339 carriers. The panels show examples of Sanger DNA sequencing reads. A missing G in a stretch of 5 consecutive Gs on the template strand defines the sh339 allele. As the mutation in sh339 eliminates a BslI restriction site, a restriction digest can also distinguish wt and mutant gfi1b alleles. (D) PCR amplification of exon 4 sequences distinguishes the wt allele and the deletion allele qmc554 of gfi1b. The expected wt and qmc554 PCR fragments are 305 and 109 bp long. Primer sequences are provided in supplemental Table 8. (E-H) Lateral views of embryos stained by WISH. Yellow, green, and red arrows point at gene expression in inner ear hair cells, in the ventral wall of the dorsal aorta, and in prRBCs, respectively. Red arrowheads highlight the lack of gene expression in prRBCs. Genotyping of 3 of the 10 embryos with elevated gfi1aa expression in panels E-F revealed that they were homozygous mutants. Representative examples are shown. All embryos shown in panels G-H display the same gfi1aa expression pattern, irrespective of their gfi1b genotype.
The 3 mutant alleles encode truncated Gfi1aa/1b proteins (Figures 3B and 4B). They possess an N-terminal SNAG domain, vary in the length of the retained linker, and lack the Zn-finger DNA-binding domain and are, therefore, likely to represent severe loss-of-function alleles. DNA sequencing reveals the differences between the gfi1aa/1b wt and the mutant gfi1aasa11633 and gfi1bsh339 alleles (Figures 3C and 4C). PCR amplification of allele-specific fragments identifies the gfi1aaqmc551 and gfi1bqmc554 alleles (Figures 3D and 4D).
When we set up the PCR genotyping assay for gfi1aaqmc551, we detected 2 different gfi1aa wt alleles, which differed in the length of intron 1 (Figure 3A). One allele (wt1) corresponds to the Zv9 reference sequence. The shorter second allele (wt2) lacks the sequence of the nonautonomous transposon DNA8-9-DR. While the gfi1aasa11633 allele carries the short intron 1, gfi1aaqmc551 possesses the long intron. In gfi1aaqmc551, the gene trap transposon integrated into an existing transposon, highlighting that the first intron of gfi1aa is a highly accessible DNA sequence.
The loss of gfi1aa transcription caused by the transposon integration in gfi1aaqmc551 de-represses gfi1ab expression in the vDA.37 Here, WISH experiments showed that although vDA gfi1aa mRNA levels are normal in gfi1aasa11633hom embryos (Figure 3E), the level of gfi1ab mRNA was clearly increased as expected (Figure 3F).
The RNA-Seq data indicated that gfi1aa is upregulated in 20 hpf gfi1b-morphant prRBCs (Figure 1G). WISH experiments confirmed the gfi1aa upregulation in 20 hpf prRBCs of gfi1bsh339hom and gfi1bqmc554hom embryos (Figure 4E-F), but also revealed that it was transient, as gfi1aa mRNA was no longer detectable in prRBCs at 28 to 30 hpf (Figure 4G-H). Gfi1bsh339 and gfi1bqmc554 mRNAs themselves were stable (ie, not subject to nonsense-mediated decay; supplemental Figure 2).
Gfi1aa suppresses endothelial gene expression in early erythroid progenitors
To validate the EC gene upregulation we observed in Gfi1aa-depleted prRBCs in the RNA-Seq data, WISH experiments were performed with probes against mRNAs coding for EC membrane proteins (Cdh5, Clec14a, Sptlc2a, and Flk1/Kdrl) and TFs (Sox7 and Etv2). Initial experiments on 22 hpf embryos revealed no obvious increase in cdh5 expression in gfi1aaqmc551hom prRBCs of the intermediate cell mass (Figure 5A), while cdh5 upregulation in the less mature prRBCs of the posterior blood island was possibly masked by strong cdh5 expression in tail ECs. To see whether prRBC progenitors of the trunk expressed EC genes earlier, younger embryos were examined. These WISH experiments provided 4 major insights. First, endothelial genes coding for membrane receptors and TFs were indeed ectopically expressed in prRBC progenitors in gfi1aaqmc551hom and gfi1aasa11633hom embryos (Figure 5B-D; supplemental Figure 3). Second, this ectopic expression became weaker as the prRBCs started to migrate to the midline and matured (Figure 5B). Third, this ectopic expression required the endothelial TF Etv2 (Figure 5E), suggesting that in the absence of Gfi1aa, EC genes were activated in prRBCs by an EC gene regulatory network, and not by early erythroid TFs. Fourth, ectopic erythroid activation of endothelial genes did not correlate with the genotype of gfi1b (Figure 5F-G; supplemental Figure 3E-F). Altogether, these data suggested that Gfi1aa was expressed in early prRBC progenitors to suppress the EC gene regulatory network. In its absence, the network transiently drives the expression of endothelial markers. The final loss of EC gene expression reveals the presence of additional mechanisms to suppress EC gene expression in maturing prRBCs.

Gfi1aa suppresses the endothelial gene expression program in primitive erythroblasts developing from the posterior lateral mesoderm. The figure shows zebrafish embryos stained in WISH experiments. Lateral views of embryos are shown in panel A. Flat-mounts of the posterior parts of embryos are displayed in panels B-E. Posterior and dorsal views of embryos are presented in the top and bottom panels of F, respectively. (A) Wt, gfi1aaqmc551het, and gfi1aaqmc551hom embryos display very similar cdh5 expression patterns at 22 hpf. Embryos were stained, photographed, and genotyped; 4 of 18 embryos were gfi1aaqmc551hom. Representative wt, gfi1aaqmc551het, and gfi1aaqmc551hom embryos are shown. (B) The expression pattern of the endothelial gene cdh5 is expanded in the posterior lateral mesoderm of Gfi1aa-depleted embryos. A mix of 15 to 18 hpf embryos derived from gfi1aaqmc551het incross were stained for the expression of cdh5, flat-mounted, photographed, and genotyped. Embryo images were sorted on the basis of the level of cdh5 expression and then arranged according to their development stage, which was judged by the distance between the bilateral PLM stripes. In younger embryos, this distance is larger than in older embryos (see white double arrows). Genotyping revealed that all gfi1aaqmc551hom mutant embryos displayed expanded expression patterns for cdh5 in the PLM when compared with wt and gfi1aaqmc551het embryos. The white arrows indicate the anterior extent of the solid stripe of cdh5+ cells in the PLM. Red arrowheads point at normal cdh5 gene expression in dispersed small clusters of PLM cells in wt and gfi1aaqmc551het embryos.28,81 Red arrows highlight unusually robust cdh5 expression in a solid stripe of PLM cells of gfi1aaqmc551hom mutant embryos. A red bracket indicates robust cdh5 expression in the posterior part of the PLM in the 18 hpf gfi1aaqmc551hom embryo. (C) In the absence of Gfi1aa, mRNA for the endothelial transcription factor Etv2 is ectopically expressed in prRBCs. Embryos from a double WISH experiment are shown. Embryos were first stained for the presence of etv2 mRNA in purple, and subsequently with a probe for hbbe1.1 mRNA in red. In the gfi1aaqmc551het embryos, etv2 is expressed in 2 stripes of EC progenitors, arterial (a) progenitors medially and venous (v) progenitors laterally. This is consistent with previous findings in wt embryos.25 Please note that the hbbe1.1-expressing primitive erythroid (e) progenitors are lateral to and much more closely associated with the arterial EC progenitors. In the gfi1aaqmc551hom mutant embryos, the medial stripe of etv2+ cells is wider and encompasses arterial EC progenitors and prRBCs (a+e). Please note that the purple staining in prRBCs masks any red staining that may be present. (D) The cdh5 expression pattern is expanded in gfi1aasa11633 homozygous mutant embryos. Embryos were stained and genotyped. Representative embryos are shown. (E) Endothelial and erythroid cdh5 expression require the presence of the endothelial TF Etv2. Two- and 4-cell stage embryos from a gfi1aaqmc551hom incross were injected with 10 ng of a previous validated etv2 5′ untranslated region (UTR) MO.63,64 Embryos were collected at 14 hpf and stained by WISH. None of the morphant embryos showed any staining. An 18-hpf wt embryo that had been added to the batch of morphant embryos before the WISH experiment showed normal cdh5 expression in ECs (data not shown), confirming that the WISH procedure successfully detected cdh5 mRNA. (F-G) The level of expression of the EC marker flk1/kdrl in the posterior lateral mesoderm correlates with the genotype of gfi1aa, and not with the genotype of gfi1b. In this experiment, gfi1aaqmc551/gfi1bqmc554 double-heterozygous fish were incrossed. Their embryos were stained by WISH, subsequently photographed, and genotyped. Representative embryos with weak and strong staining are shown. The bar charts in (G) summarize the collective results of the gfi1aa and gfi1b genotyping performed on 14- and 17-hpf somite stage embryos that displayed low or high levels of flk1/kdrl expression in the PLM. The flk1/kdrl data support the view that the EC gene upregulation is transient in gfi1aa single- and gfi1aa/1b double-mutant embryos.
Gfi1aa suppresses the endothelial gene expression program in primitive erythroblasts developing from the posterior lateral mesoderm. The figure shows zebrafish embryos stained in WISH experiments. Lateral views of embryos are shown in panel A. Flat-mounts of the posterior parts of embryos are displayed in panels B-E. Posterior and dorsal views of embryos are presented in the top and bottom panels of F, respectively. (A) Wt, gfi1aaqmc551het, and gfi1aaqmc551hom embryos display very similar cdh5 expression patterns at 22 hpf. Embryos were stained, photographed, and genotyped; 4 of 18 embryos were gfi1aaqmc551hom. Representative wt, gfi1aaqmc551het, and gfi1aaqmc551hom embryos are shown. (B) The expression pattern of the endothelial gene cdh5 is expanded in the posterior lateral mesoderm of Gfi1aa-depleted embryos. A mix of 15 to 18 hpf embryos derived from gfi1aaqmc551het incross were stained for the expression of cdh5, flat-mounted, photographed, and genotyped. Embryo images were sorted on the basis of the level of cdh5 expression and then arranged according to their development stage, which was judged by the distance between the bilateral PLM stripes. In younger embryos, this distance is larger than in older embryos (see white double arrows). Genotyping revealed that all gfi1aaqmc551hom mutant embryos displayed expanded expression patterns for cdh5 in the PLM when compared with wt and gfi1aaqmc551het embryos. The white arrows indicate the anterior extent of the solid stripe of cdh5+ cells in the PLM. Red arrowheads point at normal cdh5 gene expression in dispersed small clusters of PLM cells in wt and gfi1aaqmc551het embryos.28,81 Red arrows highlight unusually robust cdh5 expression in a solid stripe of PLM cells of gfi1aaqmc551hom mutant embryos. A red bracket indicates robust cdh5 expression in the posterior part of the PLM in the 18 hpf gfi1aaqmc551hom embryo. (C) In the absence of Gfi1aa, mRNA for the endothelial transcription factor Etv2 is ectopically expressed in prRBCs. Embryos from a double WISH experiment are shown. Embryos were first stained for the presence of etv2 mRNA in purple, and subsequently with a probe for hbbe1.1 mRNA in red. In the gfi1aaqmc551het embryos, etv2 is expressed in 2 stripes of EC progenitors, arterial (a) progenitors medially and venous (v) progenitors laterally. This is consistent with previous findings in wt embryos.25 Please note that the hbbe1.1-expressing primitive erythroid (e) progenitors are lateral to and much more closely associated with the arterial EC progenitors. In the gfi1aaqmc551hom mutant embryos, the medial stripe of etv2+ cells is wider and encompasses arterial EC progenitors and prRBCs (a+e). Please note that the purple staining in prRBCs masks any red staining that may be present. (D) The cdh5 expression pattern is expanded in gfi1aasa11633 homozygous mutant embryos. Embryos were stained and genotyped. Representative embryos are shown. (E) Endothelial and erythroid cdh5 expression require the presence of the endothelial TF Etv2. Two- and 4-cell stage embryos from a gfi1aaqmc551hom incross were injected with 10 ng of a previous validated etv2 5′ untranslated region (UTR) MO.63,64 Embryos were collected at 14 hpf and stained by WISH. None of the morphant embryos showed any staining. An 18-hpf wt embryo that had been added to the batch of morphant embryos before the WISH experiment showed normal cdh5 expression in ECs (data not shown), confirming that the WISH procedure successfully detected cdh5 mRNA. (F-G) The level of expression of the EC marker flk1/kdrl in the posterior lateral mesoderm correlates with the genotype of gfi1aa, and not with the genotype of gfi1b. In this experiment, gfi1aaqmc551/gfi1bqmc554 double-heterozygous fish were incrossed. Their embryos were stained by WISH, subsequently photographed, and genotyped. Representative embryos with weak and strong staining are shown. The bar charts in (G) summarize the collective results of the gfi1aa and gfi1b genotyping performed on 14- and 17-hpf somite stage embryos that displayed low or high levels of flk1/kdrl expression in the PLM. The flk1/kdrl data support the view that the EC gene upregulation is transient in gfi1aa single- and gfi1aa/1b double-mutant embryos.
Loss of increasing numbers of gfi1aa and gfi1b gene copies causes progressive delays in erythroid maturation, but no obvious defect in definitive hematopoiesis
Next, we performed WISH experiments with probes for late erythroid genes. For this purpose, embryos were collected from incrosses of gfi1aaqmc551/gfi1bsh339, gfi1aaqmc551/gfi1bqmc554, and gfi1aasa11633/gfi1bsh339 double heterozygous fish. We focused on the expression of slc4a1a, the gene that displayed the highest fold reduction in expression in Gfi1aa/1b-depleted prRBCs (Figure 2E). Among the stained 18- to 19-hpf embryos, a quarter displayed hardly any staining. Genotyping identified these embryos as gfi1aaqmc551hom or gfi1aasa11633hom mutants (Figure 6A-C). There was no obvious correlation between the level of staining and the gfi1b genotype (Figure 6A-C). The same experiments performed on embryos from incrosses of single heterozygous gfi1aaqmc551, gfi1bsh339, and gfi1bqmc554 carriers confirmed that Gfi1aa alone was important for normal slc4a1a expression at this stage (supplemental Figure 4).
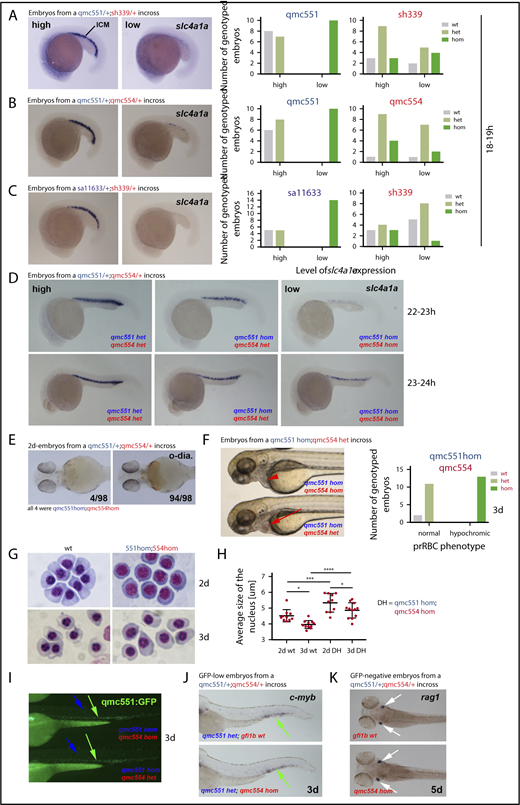
Primitive erythropoiesis is delayed in Gfi1aa/Gfi1b-depleted embryos. Images of embryos stained by RNA whole-mount in situ hybridization are shown in panels A-D and J-K. Embryos in panel E were stained with o-dianisidine. Live embryos are shown in panels F and I. Views of embryos are lateral in panels A-D,F,I,J. Ventral and dorsal views of embryos are shown in panels E and K, respectively. Cohorts of embryos derived from the crosses indicated were stained in panels A-D. Examples of embryos with high and low gene expression are depicted. Bar charts summarize the genotyping data in panels A-C. In panel D, 6/96 22- to 23-hpf and 9/89 23- to 24-hpf embryos had very low slc4a1a expression. Genotyping 11 of these showed that all of them were qmc551/qmc554 double-homozygous mutants. Embryos with slightly stronger staining turned out to be gfi1aaqmc551hom;gfi1bqmc554het carriers. A more comprehensive overview of the WISH data on the 23- to 24-hpf embryos is presented in supplemental Figure 5. In panel E, 98 2-day-old-embryos from an incross of gfi1aaqmc551het;gfi1bqmc554het parents were stained with o-dianisidine (o-dia.) for the presence of hemoglobin. Four embryos displayed reduced staining. Genotyping showed that they were double homozygous mutants. In panel F, 3-day-old embryos with normal (red arrow) and hypochromic (red arrowhead) prRBCs are shown. The bar charts summarize the genotyping results. (G) RBCs were isolated from 2- and 3-day-old wt and double-mutant embryos. Cells were fixed with methanol and stained with Giemsa. (H) The size of the RBC nuclei (n>15 cells per embryo) was determined with Image J for wt and gfi1aaqmc551;gfi1bqmc554 double-mutant embryos at 2 and 3 dpf (n ≥ 10 embryos for every type of embryos and every stage). Average values per embryo are plotted. Mean values and standard deviations are indicated. A 1-way analysis of variance (ANOVA) test revealed that the differences between the mean values were statistically significant for the comparisons indicated (ANOVA test performed on GraphPad Prism: *P < .05; ***P < .001; ****P < .0001). (I) Fluorescent images of the trunk and tail of representative embryos with hypochromic (top) and normal (bottom) blood as shown in panel F. The genotypes of the representative embryos are shown. In panel J, cmyb WISH experiments on GFP-low (ie, gfi1aaqmc551het, embryos from a gfi1aaqmc551/gfi1bqmc554 double heterozygous incross) revealed no differences in staining between embryos. Genotyping revealed that 4 of the 24 embryos were gfi1bqmc554hom. In panel K, 20 5-dpf embryos derived from a gfi1bqmc554het incross were stained for the expression of the T-cell gene rag1. All embryos showed the same level of rag1 expression, including the 5 gfi1bqmc554hom embryos.
Primitive erythropoiesis is delayed in Gfi1aa/Gfi1b-depleted embryos. Images of embryos stained by RNA whole-mount in situ hybridization are shown in panels A-D and J-K. Embryos in panel E were stained with o-dianisidine. Live embryos are shown in panels F and I. Views of embryos are lateral in panels A-D,F,I,J. Ventral and dorsal views of embryos are shown in panels E and K, respectively. Cohorts of embryos derived from the crosses indicated were stained in panels A-D. Examples of embryos with high and low gene expression are depicted. Bar charts summarize the genotyping data in panels A-C. In panel D, 6/96 22- to 23-hpf and 9/89 23- to 24-hpf embryos had very low slc4a1a expression. Genotyping 11 of these showed that all of them were qmc551/qmc554 double-homozygous mutants. Embryos with slightly stronger staining turned out to be gfi1aaqmc551hom;gfi1bqmc554het carriers. A more comprehensive overview of the WISH data on the 23- to 24-hpf embryos is presented in supplemental Figure 5. In panel E, 98 2-day-old-embryos from an incross of gfi1aaqmc551het;gfi1bqmc554het parents were stained with o-dianisidine (o-dia.) for the presence of hemoglobin. Four embryos displayed reduced staining. Genotyping showed that they were double homozygous mutants. In panel F, 3-day-old embryos with normal (red arrow) and hypochromic (red arrowhead) prRBCs are shown. The bar charts summarize the genotyping results. (G) RBCs were isolated from 2- and 3-day-old wt and double-mutant embryos. Cells were fixed with methanol and stained with Giemsa. (H) The size of the RBC nuclei (n>15 cells per embryo) was determined with Image J for wt and gfi1aaqmc551;gfi1bqmc554 double-mutant embryos at 2 and 3 dpf (n ≥ 10 embryos for every type of embryos and every stage). Average values per embryo are plotted. Mean values and standard deviations are indicated. A 1-way analysis of variance (ANOVA) test revealed that the differences between the mean values were statistically significant for the comparisons indicated (ANOVA test performed on GraphPad Prism: *P < .05; ***P < .001; ****P < .0001). (I) Fluorescent images of the trunk and tail of representative embryos with hypochromic (top) and normal (bottom) blood as shown in panel F. The genotypes of the representative embryos are shown. In panel J, cmyb WISH experiments on GFP-low (ie, gfi1aaqmc551het, embryos from a gfi1aaqmc551/gfi1bqmc554 double heterozygous incross) revealed no differences in staining between embryos. Genotyping revealed that 4 of the 24 embryos were gfi1bqmc554hom. In panel K, 20 5-dpf embryos derived from a gfi1bqmc554het incross were stained for the expression of the T-cell gene rag1. All embryos showed the same level of rag1 expression, including the 5 gfi1bqmc554hom embryos.
To determine whether Gfi1aa-depleted prRBCs recovered and whether the role of Gfi1b was detectable at later stages of erythroid differentiation, the WISH experiments were repeated on 22- to 24-hpf gfi1aaqmc551/gfi1bqmc554 embryos. At 22 to 24 hpf, the subset of embryos with very low slc4a1a expression was much smaller (n = 4/98) than before. All embryos in this subset were gfi1aaqmc551/gfi1bqmc554 double homozygotes (Figure 6D; supplemental Figure 5). Embryos with slightly higher slc4a1a expression were gfi1aaqmc551 homozygotes that retained 1 wt copy of gfi1b. Gfi1aaqmc551 mutants with 2 wt gfi1b copies were indistinguishable from wt embryos. Similar observations were made with probes for 3 other late erythroid genes, cahz, epor, and klf1 (supplemental Figure 6). These data allowed 2 conclusions: First, Gfi1aa-depleted RBCs are delayed and not blocked in differentiation, and second, Gfi1b promotes erythroid differentiation, most notably in the absence of Gfi1aa. The presence of increasing numbers of gfi1b wt copies promotes a progressively earlier onset of late erythroid gene expression.
Despite the initial delay, Gfi1aa-deficient prRBCs recover by 3 dpf, and only additional MO-induced loss of Gfi1b causes circulating prRBCs to carry less hemoglobin and display an immature cell morphology.37 Similarly, prRBCs in our gfi1aaqmc551/gfi1bqmc554 double-mutant embryos displayed less hemoglobin (Figure 6E) and were obviously hypochromic (Figure 6F). Hypochromic prRBCs were also observed in gfi1aasa11633/gfi1bsh339 double-mutant embryos (supplemental Figure 7). Giemsa staining of prRBCs isolated from the circulation showed that gfi1aaqmc551/gfi1bqmc554 double-mutant cells looked more immature and carried less condensed nuclei than wt cells (Figure 6G-H). Nuclear condensation between days 2 and 3 revealed that cellular maturation continued in wt and double-mutant prRBCs. Whether the double-mutant cells completed maturation was difficult to follow once definitive RBCs (defRBCs) entered circulation on day 4.36,56
Using a translation-blocking gfi1b MO, an unrelated study had previously suggested an essential role for Gfi1b in definitive hematopoiesis.40 However, both our double-mutant and our gfi1aa-mutant, gfi1b-splice morphant embryos displayed normal qmc551:GFP fluorescence in the CHT (Figure 6I; supplemental Figure 8A). Furthermore, there was normal CHT cmyb expression on day 3 and normal rag1 expression in thymic T-cell progenitors on day 5 in gfi1bqmc554hom mutants (Figure 6J-K) and in gfi1aaqmc551hom gfi1b-splice morphants (supplemental Figure 8B-C), suggesting that loss of Gfi1b alone or in combination with Gfi1aa does not interfere with the onset of definitive hematopoiesis in zebrafish.
Gfi1b single- and gfi1aa/gfi1b double-mutants are viable but carry abnormal erythrocytes
Embryos derived from an incross of double heterozygous gfi1aaqmc551/gfi1bqmc554 carriers were sorted on the basis of GFP expression and raised to adulthood (Figure 7A). At 15 months, all expected genotypes were present in Mendelian ratios (Figure 7B), demonstrating that single and double mutants are viable. None of the fish showed signs of cardiomegaly, a compensatory response to pronounced anemia.57-62 Nevertheless, peripheral RBCs of gfi1bqmc554hom and gfi1bsh339hom fish displayed abnormal nuclear and cellular morphology (Figure 7C; supplemental Figure 9). Flow cytometric analysis of the gfi1bqmc554hom KM cells revealed abnormal forward and side scatter profiles. Relative to wt KM, the ratio of 2 erythroid subpopulations Ery2/Ery1 was reduced and the relative number of progenitors increased in all gfi1bqmc554hom fish (Figure 7D-F). Overall, however, these changes were much milder than those reported for severely anemic fish.53 Interestingly, KM and peripheral RBCs were normal in gfi1aaqmc551hom fish (Figure 7C-E). This is consistent with our previous finding that qmc551:GFP is not expressed in KM RBCs.37 Thus, although Gfi1aa and Gfi1b act together during primitive erythropoiesis, Gfi1b alone is important for adult erythropoiesis.
![Figure 7. Gfi1aa/1b do not mediate Npas4l/Cloche suppression in primitive red blood cells. (A-F) Gfi1b single- and Gfi1aa/1b double-mutant fish are viable but carry abnormal RBCs. (A) An incross of double heterozygous gfi1aaqmc551 and gfi1bqmc554 carriers provided GFP-negative, GFP-low, and GFP-high embryos in Mendelian ratios. These embryos were separated and grown up to adulthood. (B) Genotyping at 15 months revealed that gfi1b wt, gfi1bqmc554het, and gfi1bqmc554hom genotypes were represented in all 3 batches in Mendelian ratios (GraphPad Prism; χ-square tests: P[wt]>0.99; P[het]=.64, and P[hom]=.83). (C) Blood smears were prepared and stained with Giemsa. (D) The forward and side scatter profiles were analyzed for kidney marrow cells isolated from the fish that had been genotyped in panel B. The gating follows a published protocol.53 (E) Relative abundance of 2 subpopulations of live erythrocytes, named Ery1 and Ery2, in the forward and side scatter profiles determined for the kidney marrow cells isolated from the fish genotyped in panel B. (F) Percentage of cells in the progenitor gate of the forward and side scatter profile of the kidney marrow cells isolated from the fish genotyped in panel B. (G-K) Gfi1aa/1b do not suppress the hemangioblast TF Npas4l/Cloche and TFs associated with other mesodermal cell fates. (G) Relative expression levels of selected genes in the 20 hpf prRBCs, as determined by RNA-Seq (see also Figures 1 and 2). The genes were selected as markers for particular cell fates and differentiation stages, as shown in panel H. The schematic diagram shown in panel H describes the relationship of selected cell lineages that arise from the nonaxial mesoderm of the zebrafish embryo. For the prRBC lineage, 2 genes were selected as early and late markers of prRBC differentiation, zpf36l2 and slc4a1a, respectively. For each of the other lineages, a key transcription factor gene was selected as a marker for lineage specification. (I-L) Embryos were stained in WISH experiments. In panels I-L, embryos were derived from incrosses of wt parents and from crosses of gfi1aaqmc551/gfi1bqmc554 double homozygous to gfi1aaqmc551het;gfi1bqmc554hom fish. Numbers of embryos provided on the panels correspond to the number of embryos in the batch used in the WISH experiments. A subset of these embryos was genotyped after the WISH staining. Representative embryos of known genotype are displayed. Posterior views of embryos are shown in panels I and K. Dorsal views are shown in panel J, with anterior pointing toward the left. The left-hand sides of the posterior two-thirds of flat-mounted embryos are shown in panel L. Pax2a is expressed in the pronephric duct (PND). MyoD1 expression highlights the adaxial cells (Ad) and the forming muscle in the developing somites (So). Nkx2.5 is expressed in the anterior bilateral heart fields (HF). At 13 hpf, npas4l/cloche is expressed in blood and in arterial endothelial progenitors in the PLM (K). At 14 hpf (L), npas4l/cloche-expressing cells are arranged in 2 stripes: a medial stripe of arterial (a) and a lateral stripe of future venous (v) angioblasts. Hbbe1.1-expressing prRBC progenitors are located next to the arterial stripe. These prRBCs lack hbbe1.1 expression, but do not gain npas4l/cloche expression in the absence of Gfi1aa and Gfi1b.](https://ash.silverchair-cdn.com/ash/content_public/journal/bloodadvances/2/20/10.1182_bloodadvances.2018020156/4/m_advances020156f7.png?Expires=1763472804&Signature=bNhQKXpy80-R0mBMJr7U3Dx301W0SQYPm1gjEHFUOjEj-NorEFvmZ68CiqbLZGNeQcEspqJAdaF2Qu6MyB1bSYpq12PlS5xkFcVOMoDwfkiKSKO8ydlD-tT3s6d3B2j3YXyfRg4gSbgMoM-zu8oHuNqNeWUHNZVUJ9EB79sjWm0-QCIlC6zt9vsaBAVV9gj232kxZgRykHOMXZNnUXaA6b~JfoLcPjnZrGZDIRHdiUCvi4XiEMJ6EZQQt7vp4K6luNbvcXz49LkZlhpcBPuLK70tKfflCVrt4EshfTqxxTGliQTlVVd8tCZBtzZVtaO0BvMwMmMqjVcccwtm1NjpkA__&Key-Pair-Id=APKAIE5G5CRDK6RD3PGA)
Gfi1aa/1b do not mediate Npas4l/Cloche suppression in primitive red blood cells. (A-F) Gfi1b single- and Gfi1aa/1b double-mutant fish are viable but carry abnormal RBCs. (A) An incross of double heterozygous gfi1aaqmc551 and gfi1bqmc554 carriers provided GFP-negative, GFP-low, and GFP-high embryos in Mendelian ratios. These embryos were separated and grown up to adulthood. (B) Genotyping at 15 months revealed that gfi1b wt, gfi1bqmc554het, and gfi1bqmc554hom genotypes were represented in all 3 batches in Mendelian ratios (GraphPad Prism; χ-square tests: P[wt]>0.99; P[het]=.64, and P[hom]=.83). (C) Blood smears were prepared and stained with Giemsa. (D) The forward and side scatter profiles were analyzed for kidney marrow cells isolated from the fish that had been genotyped in panel B. The gating follows a published protocol.53 (E) Relative abundance of 2 subpopulations of live erythrocytes, named Ery1 and Ery2, in the forward and side scatter profiles determined for the kidney marrow cells isolated from the fish genotyped in panel B. (F) Percentage of cells in the progenitor gate of the forward and side scatter profile of the kidney marrow cells isolated from the fish genotyped in panel B. (G-K) Gfi1aa/1b do not suppress the hemangioblast TF Npas4l/Cloche and TFs associated with other mesodermal cell fates. (G) Relative expression levels of selected genes in the 20 hpf prRBCs, as determined by RNA-Seq (see also Figures 1 and 2). The genes were selected as markers for particular cell fates and differentiation stages, as shown in panel H. The schematic diagram shown in panel H describes the relationship of selected cell lineages that arise from the nonaxial mesoderm of the zebrafish embryo. For the prRBC lineage, 2 genes were selected as early and late markers of prRBC differentiation, zpf36l2 and slc4a1a, respectively. For each of the other lineages, a key transcription factor gene was selected as a marker for lineage specification. (I-L) Embryos were stained in WISH experiments. In panels I-L, embryos were derived from incrosses of wt parents and from crosses of gfi1aaqmc551/gfi1bqmc554 double homozygous to gfi1aaqmc551het;gfi1bqmc554hom fish. Numbers of embryos provided on the panels correspond to the number of embryos in the batch used in the WISH experiments. A subset of these embryos was genotyped after the WISH staining. Representative embryos of known genotype are displayed. Posterior views of embryos are shown in panels I and K. Dorsal views are shown in panel J, with anterior pointing toward the left. The left-hand sides of the posterior two-thirds of flat-mounted embryos are shown in panel L. Pax2a is expressed in the pronephric duct (PND). MyoD1 expression highlights the adaxial cells (Ad) and the forming muscle in the developing somites (So). Nkx2.5 is expressed in the anterior bilateral heart fields (HF). At 13 hpf, npas4l/cloche is expressed in blood and in arterial endothelial progenitors in the PLM (K). At 14 hpf (L), npas4l/cloche-expressing cells are arranged in 2 stripes: a medial stripe of arterial (a) and a lateral stripe of future venous (v) angioblasts. Hbbe1.1-expressing prRBC progenitors are located next to the arterial stripe. These prRBCs lack hbbe1.1 expression, but do not gain npas4l/cloche expression in the absence of Gfi1aa and Gfi1b.
Gfi1aa/1b do not mediate Npas4l/Cloche suppression in primitive red blood cells. (A-F) Gfi1b single- and Gfi1aa/1b double-mutant fish are viable but carry abnormal RBCs. (A) An incross of double heterozygous gfi1aaqmc551 and gfi1bqmc554 carriers provided GFP-negative, GFP-low, and GFP-high embryos in Mendelian ratios. These embryos were separated and grown up to adulthood. (B) Genotyping at 15 months revealed that gfi1b wt, gfi1bqmc554het, and gfi1bqmc554hom genotypes were represented in all 3 batches in Mendelian ratios (GraphPad Prism; χ-square tests: P[wt]>0.99; P[het]=.64, and P[hom]=.83). (C) Blood smears were prepared and stained with Giemsa. (D) The forward and side scatter profiles were analyzed for kidney marrow cells isolated from the fish that had been genotyped in panel B. The gating follows a published protocol.53 (E) Relative abundance of 2 subpopulations of live erythrocytes, named Ery1 and Ery2, in the forward and side scatter profiles determined for the kidney marrow cells isolated from the fish genotyped in panel B. (F) Percentage of cells in the progenitor gate of the forward and side scatter profile of the kidney marrow cells isolated from the fish genotyped in panel B. (G-K) Gfi1aa/1b do not suppress the hemangioblast TF Npas4l/Cloche and TFs associated with other mesodermal cell fates. (G) Relative expression levels of selected genes in the 20 hpf prRBCs, as determined by RNA-Seq (see also Figures 1 and 2). The genes were selected as markers for particular cell fates and differentiation stages, as shown in panel H. The schematic diagram shown in panel H describes the relationship of selected cell lineages that arise from the nonaxial mesoderm of the zebrafish embryo. For the prRBC lineage, 2 genes were selected as early and late markers of prRBC differentiation, zpf36l2 and slc4a1a, respectively. For each of the other lineages, a key transcription factor gene was selected as a marker for lineage specification. (I-L) Embryos were stained in WISH experiments. In panels I-L, embryos were derived from incrosses of wt parents and from crosses of gfi1aaqmc551/gfi1bqmc554 double homozygous to gfi1aaqmc551het;gfi1bqmc554hom fish. Numbers of embryos provided on the panels correspond to the number of embryos in the batch used in the WISH experiments. A subset of these embryos was genotyped after the WISH staining. Representative embryos of known genotype are displayed. Posterior views of embryos are shown in panels I and K. Dorsal views are shown in panel J, with anterior pointing toward the left. The left-hand sides of the posterior two-thirds of flat-mounted embryos are shown in panel L. Pax2a is expressed in the pronephric duct (PND). MyoD1 expression highlights the adaxial cells (Ad) and the forming muscle in the developing somites (So). Nkx2.5 is expressed in the anterior bilateral heart fields (HF). At 13 hpf, npas4l/cloche is expressed in blood and in arterial endothelial progenitors in the PLM (K). At 14 hpf (L), npas4l/cloche-expressing cells are arranged in 2 stripes: a medial stripe of arterial (a) and a lateral stripe of future venous (v) angioblasts. Hbbe1.1-expressing prRBC progenitors are located next to the arterial stripe. These prRBCs lack hbbe1.1 expression, but do not gain npas4l/cloche expression in the absence of Gfi1aa and Gfi1b.
Gfi1aa/1b do not mediate the suppression of the hemangioblast transcription factor Npas4l/Cloche in primitive red blood cell progenitors
Our 20-hpf RNA-Seq data showed that Gfi1aa/1b-depleted prRBCs displayed reduced expression of the late erythroid transcription program (slc4a1a) and elevated levels of early erythroid (zfp36l2) and endothelial genes (etv2), gene expression changes that the subsequent WISH experiments revealed to reflect a delay in cellular differentiation. Forcing the suppression of EC genes in Gfi1aa-depleted embryos with an etv2 MO63,64 only partially restored slc4a1a expression levels (supplemental Figure 10), showing that this is only one aspect of Gfi1aa’s role.
Our transcriptome analysis did not suggest that Gfi1aa/1b suppressed other mesodermal transcription programs or downregulated the hemangioblast TF Npas4l/Cloche in prRBCs (Figure 7G-H). To see whether this was also true at earlier stages, we performed WISH experiments on gfi1aaqmc551/gfi1bqmc554 double-mutant embryos we derived in sufficiently large numbers from the identified double-mutant parents. These WISH data revealed that even at earlier stages, there was no ectopic expression of myoD1, pax2a, and nkx2.5 in Gfi1aa/Gfi1b-depleted RBCs in the PLM (Figure 7I-J). We also found no evidence for an abnormal maintenance of npas4l/cloche expression in double-mutant prRBCs (Figure 7K-L). While at 13 hpf, the npas4l/cloche expression domain encompasses prRBCs and arterial EC progenitors (Figure 7K),18 only the medial DA angioblasts retain this expression by 14 hpf (Figure 7L). Hbbe1.1-expressing prRBCs switch npas4l/cloche off in wt embryos. In double-mutant embryos, that was no different. Npas4l/cloche was downregulated, but the lack of hbbe1.1 mRNA indicated that prRBC differentiation was delayed (Figure 7L). From these data, we conclude that Gfi1aa/1b-deficient mesodermal cells progress normally through early hemangioblast stages and into the erythroid cell lineage, where in the wt, first Gfi1aa and then Gfi1b are expressed to suppress EC and early erythroid genes to promote late erythroid differentiation at its normal speed.
Discussion
Cellular differentiation proceeds by step-wise progression through individual regulatory states hard-wired in the genomic DNA sequence.65,66 Gene regulatory networks of transcription factors, under the influence of extracellular signals, act in subcircuits to define each of these regulatory states. Progression from one state to another involves the activation of the next subcircuit, as well as the suppression of previous and alternative ones in negative feed forward loops. Our RNA-Seq analysis identifies Gfi1aa and Gfi1b as actors in a negative feed forward loop that suppresses the early erythroid, as well as the alternative EC regulatory states to promote late erythroid differentiation. Studying the kinetics of EC and erythroid gene expression in the synchronously developing prRBCs, our WISH experiments reveal that early cellular differentiation was not completely blocked, but delayed, in gfi1aa/1b mutant embryos. Additional mechanisms must exist that ensure developmental progression, albeit at a reduced speed. Its early onset of expression makes Gfi1aa the prominent player in early prRBC differentiation, a role that it later shares with Gfi1b. The prolonged maintenance of gfi1aa expression in gfi1aa/gfi1b mutants likely reflects delayed cellular maturation rather than the kind of auto- or cross-regulation that was reported in other contexts.67-71 In the adult, Gfi1b alone is important for the formation of normal defRBCs. Their asynchronous development in the KM makes it difficult to examine whether their differentiation is delayed in the absence of Gfi1b.
The phenotype of our gfi1aa/1b double-mutant embryos is very similar to the phenotype of the lsd1-mutant zebrafish.72 In particular, the early widespread etv2 expression in the PLM and the late posterior restriction of EC gene expression suggest that lsd1-mutant prRBCs are not blocked, as suggested,72 but delayed in differentiation, and that lysine-specific demethylase 1 (Lsd1) and Gfi1aa/1b act in the same pathway. Lsd1 is a histone demethylase that acts as corepressor and coactivator in a context-dependent manner.73-75 During hematopoiesis, Lsd1 interacts with numerous TFs, including Gfi1 and Gfi1b.76-78 Our data suggest that in prRBCs, Gfi1aa/1b are the TFs that take Lsd1 to its target genes, one of which is etv2.72 Depletion of the endothelial TF Etv2 blocks ectopic endothelial gene expression and only slightly elevates slc4a1a expression in gfi1aa-mutant prRBCs.
The need to suppress EC genes in early prRBCs highlights the bipotent nature of the progenitor cells from which prRBCs arise. Whether PLM cells themselves are hemangioblasts or constitute a mix of angioblasts and erythroid progenitors derived from hemangioblasts is unclear. Lineage labeling studies have identified hemangioblasts during early gastrulation.17 Blood and endothelial gene expression, however, commence after gastrulation and show considerable overlap in the PLM.16,21-25,79-82 Expression of both gene sets relies on the TF Npas4l/Cloche,23,79,81,83 which itself is expressed only from the end of gastrulation.18 Notch and Wnt signaling appear to differentially bias the fate choice of hemangioblasts. Notch favors prRBC differentiation in nascent mesoderm,20 whereas Wnt promotes endothelial development specifically in the PLM.19 Our finding that Gfi1aa suppresses EC gene expression in prRBCs of the PLM implies that these prRBCs have only recently developed from hemangioblasts.
Our data confirm and extend our knowledge on the role of Gfi1/1b during erythropoiesis in the vertebrate embryo. Gfi1b-mutant mouse embryos display defects in primitive and definitive erythropoiesis. Snapshot analyses show that they carry prRBCs with immature morphology at embryonic day (E) 9.5-10.5, and lack all enucleated defRBCs at E14.84 Gfi1b-mutant mice eventually die at E15.84 Gfi1/Gfi1b-double-knockout mouse embryos die at E11 and display strongly reduced βH1 and βmajor globin expression at E8.5,85 suggesting a more severe defect in the development of prRBC and pre-defRBCs of the yolk sac. In the double mutants, pre-defRBCs, identified as CD41+, Gfi1:GFP, and Gfi1b:GFP-expressing cells, fail to enter circulation and remain trapped in the yolk sac vasculature.85 Reverse transcription PCR showed that they display elevated levels of several EC mRNAs, suggesting that mouse Gfi1/Gfi1b normally repress EC genes in yolk sac HECs as they undergo EHT.85 Here, we show for the first time that Gfi1/Gfi1b also suppress EC genes in prRBCs as they arise from hemangioblasts. It is likely that the same is true in the mouse.
Although Gfi1/Gfi1b-depleted RBCs are abnormal in mouse and fish mutants, the consequences for the affected individuals are dramatically different. Gfi1b-single- and Gfi1/Gfi1b-double-mutant mice die in utero,84,85 whereas mice with an erythroid-specific deletion of Gfi1b die perinatally.86 Conditional deletion of Gfi1b in adult mouse bone marrow cells blocks erythropoiesis and is lethal within 3 weeks.87 By contrast, single- and double-mutant zebrafish are viable. Their differential survival may reflect obvious differences between extra- and intrauterine embryogenesis, differences in RBC biology or adult physiology that affect the fitness of the cells or the selection pressures they experience. Numerous examples show that gene essentiality is context-dependent.88
Our novel gfi1b-mutant lines show that definitive hematopoiesis proceeds normally in the absence of Gfi1b. Consistent with this, gfi1aa, and not gfi1b, is expressed in HECs of the vDA, and gfi1ab expression is triggered in its absence.37 In the mouse, Gfi1 and Gfi1b act redundantly in HSC formation89 and maintenance.90 Whether loss of all 3 Gfi1/Gfi1b TFs in zebrafish block HSC formation by interfering with EHT in the vDA or inhibit subsequent HSC maintenance remains to be examined.
The full-text version of this article contains a data supplement.
Acknowledgments
The authors thank David Onion and Nicola Croxall for their help in flow cytometry. The authors also thank the 2017/18 third-year project students Harry Oughton, Iman Mustafa, Jenny Walsh, Kabilas Parameswaran, Maria Blasco Cabildo, and Sita Mall for their help in this project.
This work was supported by Medical Research Council grants (G0601134 and MR/J000841/1) (M.G.), an MRC PhD studentship (Y.H.), a University of Nottingham International PhD studentship (D.U.), and a Chinese Scholarship Council PhD studentship (Y.C.).
Authorship
Contribution: C.M., J.L.R., Y.H., D.U., S.M., Y.C., S.E., R.N.W., and M.G. performed experiments; F.S. and M.G. performed the bioinformatics; R.N.W. and M.G. conceived the study; M.G. prepared the manuscript; and C.M., J.L.R., Y.H., and R.N.W. critiqued the output for important intellectual content.
Conflict-of-interest disclosure: The authors declare no competing financial interests.
Correspondence: Martin Gering, School of Life Sciences, University of Nottingham, Queen’s Medical Centre, Nottingham NG7 2UH, United Kingdom; e-mail: martin.gering@nottingham.ac.uk.

