

Key Points
Group I PAKs act as signaling hubs in RTK-dependent pathways in ALL.
Inhibition of group I PAKs by FRAX486 augments the antileukemic efficacy of midostaurin in FLT3-driven ALL.

Abstract
Receptor tyrosine kinase (RTK)-dependent signaling has been implicated in the pathogenesis of acute lymphoblastic leukemia (ALL) of childhood. However, the RTK-dependent signaling state and its interpretation with regard to biological behavior are often elusive. To decipher signaling circuits that link RTK activity with biological output in vivo, we established patient-derived xenograft ALL (PDX-ALL) models with dependencies on fms-like tyrosine kinase 3 (FLT3) and platelet-derived growth factor receptor β (PDGFRB), which were interrogated by phosphoproteomics using iTRAQ mass spectrometry. Signaling circuits were determined by receptor type and cellular context with few generic features, among which we identified group I p21-activated kinases (PAKs) as potential therapeutic targets. Growth factor stimulation markedly increased catalytic activities of PAK1 and PAK2. RNA interference (RNAi)-mediated or pharmacological inhibition of PAKs using allosteric or adenosine triphosphate (ATP)-competitive compounds attenuated cell growth and increased apoptosis in vitro. Notably, PAK1- or PAK2-directed RNAi enhanced the antiproliferative effects of the type III RTK and protein kinase C inhibitor midostaurin. Treatment of FLT3- or PDGFRB-dependent ALLs with ATP-competitive PAK inhibitors markedly decreased catalytic activities of both PAK isoforms. In FLT3-driven ALL, this effect was augmented by coadministration of midostaurin resulting in synergistic effects on growth inhibition and apoptosis. Finally, combined treatment of FLT3D835H PDX-ALL with the ATP-competitive group I PAK inhibitor FRAX486 and midostaurin in vivo significantly prolonged leukemia progression-free survival compared with midostaurin monotherapy or control. Our study establishes PAKs as potential downstream targets in RTK-dependent ALL of childhood, the inhibition of which might help prevent the selection or acquisition of resistance mutations toward tyrosine kinase inhibitors.
Introduction
The relevance of receptor tyrosine kinase (RTK) signaling in cancer biology is undisputed in the face of numerous examples of its oncogenic activity.1 Mutation or aberrant expression of RTKs is frequently encountered in human cancers, often leading to their constitutive activation.2 In acute lymphoblastic leukemia (ALL) of childhood fms-like tyrosine kinase 3 (FLT3), platelet-derived growth factor receptor β (PDGFRB), and macrophage colony-stimulating factor 1 receptor are prominent examples that are targeted for mutation.3-6 Augmented RTK activity has also been demonstrated as a leukemogenic factor in the context of molecular aberrations that perturb differentiation processes in the hematopoietic lineage.7 In addition, deregulated RTK expression and activity has been observed following targeted inhibition of constitutively active kinases or kinase-dependent pathways in a variety of other malignancies, which confer pharmacological resistance through control of central biological processes.8-10 These findings indicate that dynamic changes in multiple kinases or key nodal players of signaling networks can be inflicted by pharmacological and genetic perturbations during the course of the disease. A deeper understanding of RTK-driven processes on a system-wide scale will be key in defining critical components of signaling networks amenable to therapeutic intervention. In primary ALL, RTK-dependent signaling and its interpretation with regard to specific biological behavior is poorly defined in part due to a lack of suitable experimental models.11,12
Here, we describe the establishment of patient-derived xenografts (PDXs) as RTK-dependent models of primary human ALL, which were interrogated by a phosphoproteomic approach to the signaling state. Among actionable RTK-dependent targets, we identified p21-activated protein kinases (PAKs; PAK1 and PAK2), which mediate oncogenic signals through a variety of key substrates along multiple pathways depending on the cellular context.13,14 We demonstrate that inhibition of group I PAK disrupts RTK-dependent growth and survival mechanisms and augments an RTK-directed treatment approach in childhood ALL.
Methods
Patient samples
Primary ALL samples were collected from peripheral blood or bone marrow aspirates after informed consent was obtained from all patients or their legal guardians in accordance with institutional ethics boards (Hamburg WF50-08 and PVN3409; Munich 068-08). CD34+ hematopoietic precursors, mature B and T cells were isolated from umbilical cord or peripheral blood of healthy donors using CD34, CD19, and CD3 MACS MicroBeads (Miltenyi Biotec), respectively. Otherwise, hematopoietic progenitors were fluorescence-activated cell sorted (FACS) from bone marrow samples of ALL patients in remission. ALL samples for xenotransplantation were provided by the CoALL Study Group or the German Research Center for Environmental Health, Munich.
Cell culture, proliferation, and viability assays
Primary ALL samples were cultured in StemSpan SFEM media (StemCell Technologies) supplemented with 10% fetal calf serum and antibiotics. Cell lines were cultivated under standard conditions. ALL cells were stimulated using 0.1 ng/mL to 100 ng/mL specific RTK ligands. Proliferation and cell cycle analyses were performed using the CellTiter 96 Non-Radioactive Cell Proliferation Assay (Promega) and the APC/FITC BrdU Flow kit (BD Pharmingen). Apoptosis was determined by propidium iodide (PI) incorporation and annexin V staining (BD Biosciences) or caspase 3/7 cleavage assay (Promega).
Flow cytometry
Flow cytometry analyses were performed on FACSCanto I/II machines (BD Biosciences) using FACSDiva software. Cell sorting was performed on a FACSAria 3 (BD Biosciences). Antibodies are listed in supplemental Methods.
Protein analysis
Cell lysis was performed using kinase lysis buffer. Protein concentrations were determined by DC protein assay (Bio-Rad). RTK expression, ligand expression, and phosphorylation were analyzed by sandwich enzyme-linked immunosorbent assay (ELISA; R&D Systems) (supplemental Figure 1A). Tyrosine phosphorylation was analyzed using the biotinylated monoclonal antibody 4G10 (Millipore). In vitro kinase assays (IVKs) were done after immunoprecipitation with 1 µg of PAK1 or PAK2 antibody (Bethyl) using γ-32P–adenosine triphosphate (ATP) and histone 4 (H4) as a substrate.
Lentiviral infection
Lentiviral particles were produced in HEK293T cells after transfection (Profection; Promega) of helper plasmids and pLKO.1-YFP/GFP (Sigma-Aldrich)/pLKO.1-Tet-on (Novartis) containing the specific short hairpin RNA (shRNA) and the reporter gene yellow fluorescent protein (YFP) or Gaussia luciferase (G-Luc). Viral particles were concentrated by preparative centrifugation.
SNP analysis
Single-nucleotide polymorphism (SNP) analyses of genomic DNA were performed by the genome-wide human SNP Nsp/Sty 5.0/6.0 assay (Affymetrix) using human SNP 6.0 arrays (Affymetrix) (refer to supplemental Methods for further details).
Mass spectrometry
In vivo–propagated xenografted ALL (XT-ALL) cells were isolated and stimulated in triplicate with specific ligands for indicated times and lysed in kinase lysis buffer. Samples were digested using molecular weight filters, generated peptides were iTRAQ-labeled and pooled, and phosphopeptides were enriched using TiO2. Nanoscale liquid chromatography coupled to tandem mass spectrometry (Nano-LC-MS/MS) was conducted on an LTQ OrbitrapVelos (Thermo Scientific) coupled to an Ultimate 3000 Liquid Chromatography system (Dionex). Raw data were processed by Proteome Discoverer 1.3 (Thermo Scientific) using Mascot and Sequest for database search against the human Uniprot database (4 November 2010; 20 260 sequences). For data interpretation, only phosphorylated peptides with a false discovery rate <1% were considered and phosphorylation site localization probabilities >90% were defined as confident.
Animal experiments
Animal experiments were performed in accordance with ARRIVE guidelines and legal regulations (Hamburg 55/08 and 43/13; Munich 55.2-1-54-2531-2-07).15 ALL cells were transplanted into NSG (NOD.Cg-PrkdcscidIl2rgtm1Wjl/SzJ) mice (3 × 10⁴ to 1.5 × 10⁷ cells per animal) by injection into the bone marrow of tibiae. Bioluminescent imaging was performed on an IVIS Spectrum 200 device using coelenterazine (SYNCHEM) as substrate as previously described.16
Data analysis
RTK expression heat maps were designed with Xact 8.05 (SciLab) and Multi Experiment Viewer 4.7.4. Error bars represent standard deviation (SD) or range of measurements. Statistical significance was determined by 2-tailed t test for unequal variance or 2-way analysis of variance (ANOVA). P values were calculated using Prism software. Analysis of phosphoproteomic data were performed using the statistical programming language R.17 Phosphosites not to be matched to a unique protein were removed. Data were transformed to log2 scale and identical phosphosites were averaged to the median. In first-tier analyses, phosphosites were defined to be jointly phosphorylated or dephosphorylated for a given time point t in models A and B if phosphorylationA,t × phosphorylationB,t > 1. Jointly regulated phosphosites with similar regulation in at least 3 of 9 comparisons were selected for heat-map analysis using an average linkage method and Euclidian distance as similarity measure. Drug synergism was calculated using Combenefit.18 Kaplan-Meier survival analyses were performed by log-rank test.
Results
Expression of RTKs in ALL and lymphopoiesis
To establish experimental models for the functional interrogation of RTK signaling in ALL, we first assessed the expression of RTKs in naive leukemic lymphoblasts. Based on in silico transcriptome analyses of accessible expression data sets (http://www.stjuderesearch.org/data/ALL1; GSE635-660, GSE42038), 20 candidate RTKs were chosen for further investigation based on prevalence and minimum expression level (refer to ELISA in supplemental Methods). Using a sandwich ELISA, protein expression of selected RTKs was absolutely quantified in a diverse cohort of n = 106 primary ALLs (Figure 1A; supplemental Tables 1 and 2). The majority of RTKs revealed differential and heterogeneous expression across ALL subtypes, among which ephrin- and fms-like RTK family members and insulin-like growth factor 1 (IGF-1) receptor (IGF1R) were the most frequently encountered receptors in ALL. In a principal component analysis of ALL subgroups only T-cell ALL (T-ALL) showed an association with a distinct RTK profile, mainly determined by high EPHB6 expression (Figure 1A; supplemental Figure 1B). RTK expression of primary ALLs was closely recapitulated in ALL cell lines in contrast to mature B and T cells as well as CD34+ progenitor cells, which exhibited sparse expression of RTKs (supplemental Figure 1C). In a complementary approach, multicolor FACS and scanning revealed varying donor- and differentiation-dependent surface expression of FLT3, PDGFRB as well as IGF1R in normal lymphopoietic precursors clearly enriched in ALL (Figure 1B; supplemental Figure 1D). Notwithstanding a widespread presence of growth factors in the microenvironment of primary ALLs, expressed RTKs were found in a weakly or nonphosphorylated but functional state most likely due to continuous rather than pulsatile activation, the short-lived nature of induced receptor phosphorylation, and often weak autophosphorylation of mutated RTKs as shown for FLT3ITD, FLT3D835H, and EBF1-PDGFRB (supplemental Figure 2A-F). These findings suggest that an interrogation of RTK-dependent signaling in ALL likely requires a growth factor potentiated state to yield valuable information on critical components of downstream circuits.
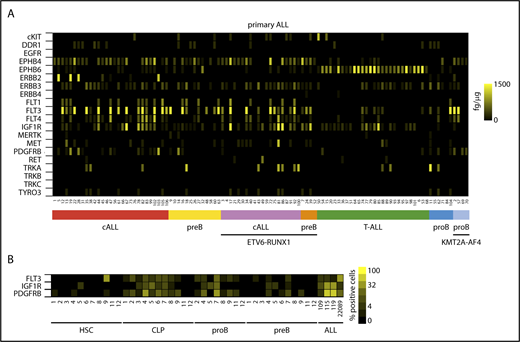
Expression of RTKs in ALL and normal lymphopoiesis. (A) Heat map of mean quantitative RTK protein expression data on n = 106 ALL samples representing different immunological and genetic ALL subtypes determined by quantitative sandwich ELISA performed in duplicate. Color scale bar indicates amount of RTK protein (femtogram) per microgram protein lysate using recombinant proteins as internal standards. (B) RTK surface expression in hematopoietic progenitor cells from bone marrow of ALL patients in complete remission determined by FACS of progenitor subpopulations in comparison with primary ALL samples (denoted as ALL). Pro-B and pre-B progenitors as defined in supplemental Figure 1D. Color scale indicates receptor surface expression as percentage of total cell population. cALL, common ALL; CLP, common lymphoid progenitor; HSC, hematopoietic stem cell.
Expression of RTKs in ALL and normal lymphopoiesis. (A) Heat map of mean quantitative RTK protein expression data on n = 106 ALL samples representing different immunological and genetic ALL subtypes determined by quantitative sandwich ELISA performed in duplicate. Color scale bar indicates amount of RTK protein (femtogram) per microgram protein lysate using recombinant proteins as internal standards. (B) RTK surface expression in hematopoietic progenitor cells from bone marrow of ALL patients in complete remission determined by FACS of progenitor subpopulations in comparison with primary ALL samples (denoted as ALL). Pro-B and pre-B progenitors as defined in supplemental Figure 1D. Color scale indicates receptor surface expression as percentage of total cell population. cALL, common ALL; CLP, common lymphoid progenitor; HSC, hematopoietic stem cell.
Establishment and evaluation of RTK-dependent models of primary human ALL
To determine the impact of RTK activation on ALL, we first tested the effect of respective growth factors on receptor phosphorylation and proliferation in primary ALLs, XT-ALLs, and ALL cell lines. Depending on the type of receptor and its expression level, stimulation with corresponding ligands increased receptor phosphorylation, in vitro proliferation, and viability of primary ALLs and ALL cell lines as shown by RTK-specific phosphotyrosine (p-Tyr) ELISA and 3-(4,5-dimethylthiazol-2-yl)-2,5-diphenyltetrazolium bromide (MTT) assay (Figure 2A-B; supplemental Figure 3A). To set up RTK-dependent in vivo ALL models, we focused on FLT3 and PDGFRB, sometimes coexpressed RTKs that exhibited growth-promoting effects on short-term cultivated primary and XT-ALL cells (Figure 2B-D). In reciprocal experiments, we assessed whether repression of FLT3 or PDGFRB would result in reverse biological effects, that is, attenuated growth or cell death. To this end, we applied RNAi using independent shRNAs (3-5 per RTK) that were tested in RTK-expressing ALL models and selected based on 3 criteria: (1) on-target knockdown efficiency (≥70%), (2) absence of off-target effects on coexpressed distinct RTK, and (3) discernible impact on proliferation or viability of ALL cells in vitro (supplemental Figure 3B-D). Three independent PDX models of primary ALL with verified RTK gene sequence and copy number (ALL114 FLT3WT, ALL22089 FTL3D835H, ALL109 PDGFRBWT) were chosen from a panel of established XT-ALLs showing growth factor responsiveness and robust expression of target RTKs upon serial retransplantation (Figure 2C-D; supplemental Figure 4A-C). Lentiviral expression of RTK-targeting shRNA in vivo resulted in largely insufficient engraftment and subsequent loss or reduction of YFP-coexpressing leukemia cells in the peripheral blood and bone marrow of xenografted animals as shown by FACS monitoring (Figure 2E; supplemental Figure 4D-F).

Distinct RTKs determine growth and survival of ALL. (A) Tyrosine phosphorylation of RTKs in primary ALLs, XT-ALLs, and ALL cell lines before and after ligand stimulation determined by quantitative sandwich ELISA. Mean values (plus or minus range) of technical duplicates are shown. Experiments were reproduced independently using biological replicates with similar results except for primary ALL due to limited material. (B) MTT assay of primary ALL cells after stimulation with RTK-specific ligands. Relative proliferation over time (days) normalized to nonstimulated controls. Combination: Simultaneous application of ligands FLT3L, platelet-derived growth factor β chain homodimer (PDGF-BB), and IGF-1 according to surface expression of corresponding RTK in individual ALL. Assays were performed in triplicate. Mean values plus or minus SD are shown. (C) Heat map of RTK expression in a panel of established XT-ALLs determined by ELISA. Color scale bar indicates absolute amount of protein (femtograms) per microgram of protein lysate. (D) Proliferation of selected XT-ALL under FLT3 or PDGF-BB stimulation over time normalized to nonstimulated control using MTT assay. Mean values plus or minus SD are shown. (E) In vivo growth and survival of PDX-ALLs (XT-ALL22089, XT-ALL109, XT-ALL114) upon FLT3 (sh4FLT3) or PDGFRB (sh2PDGF)-directed RNAi compared with scrambled shRNA (sh1SCR). Dot plots represent mean percentage plus or minus SD of YFP-reporter positive XT-ALL cells in bone marrow of euthanized animals at the onset of overt clinical disease 6 to 8 weeks after transplantation. Competitive leukemia cell engraftment and progression of disease were monitored by YFP reporter fluorescence of shRNA-expressing target cells in peripheral blood in relation to the total human CD45+ leukemia population (supplemental Figure 4E-F). Number of mice per cohort is indicated. Mean values plus or minus SD are shown (2-tailed Mann-Whitney U test; **P < .01; ***P < .001). BCP-ALL, B-cell precursor ALL; SCF, stem cell factor; VEGF, vascular endothelial growth factor.
Distinct RTKs determine growth and survival of ALL. (A) Tyrosine phosphorylation of RTKs in primary ALLs, XT-ALLs, and ALL cell lines before and after ligand stimulation determined by quantitative sandwich ELISA. Mean values (plus or minus range) of technical duplicates are shown. Experiments were reproduced independently using biological replicates with similar results except for primary ALL due to limited material. (B) MTT assay of primary ALL cells after stimulation with RTK-specific ligands. Relative proliferation over time (days) normalized to nonstimulated controls. Combination: Simultaneous application of ligands FLT3L, platelet-derived growth factor β chain homodimer (PDGF-BB), and IGF-1 according to surface expression of corresponding RTK in individual ALL. Assays were performed in triplicate. Mean values plus or minus SD are shown. (C) Heat map of RTK expression in a panel of established XT-ALLs determined by ELISA. Color scale bar indicates absolute amount of protein (femtograms) per microgram of protein lysate. (D) Proliferation of selected XT-ALL under FLT3 or PDGF-BB stimulation over time normalized to nonstimulated control using MTT assay. Mean values plus or minus SD are shown. (E) In vivo growth and survival of PDX-ALLs (XT-ALL22089, XT-ALL109, XT-ALL114) upon FLT3 (sh4FLT3) or PDGFRB (sh2PDGF)-directed RNAi compared with scrambled shRNA (sh1SCR). Dot plots represent mean percentage plus or minus SD of YFP-reporter positive XT-ALL cells in bone marrow of euthanized animals at the onset of overt clinical disease 6 to 8 weeks after transplantation. Competitive leukemia cell engraftment and progression of disease were monitored by YFP reporter fluorescence of shRNA-expressing target cells in peripheral blood in relation to the total human CD45+ leukemia population (supplemental Figure 4E-F). Number of mice per cohort is indicated. Mean values plus or minus SD are shown (2-tailed Mann-Whitney U test; **P < .01; ***P < .001). BCP-ALL, B-cell precursor ALL; SCF, stem cell factor; VEGF, vascular endothelial growth factor.
Phosphoproteomic analyses identify group I PAKs as targets of RTKs in ALL
To achieve a more comprehensive characterization of the structure and composition of signaling circuits, potentiated RTK-dependent pathways were screened for phosphoregulated targets by MS in the selected XT-ALLs (ALL22089, ALL109, ALL114) propagated in NSG mice. After transplantation, leukemic cells were isolated from euthanized mice at the onset of overt clinical disease and specifically stimulated in triplicate with FLT3L and/or PDGF-BB over time (0, 10, 30, 60 minutes) to potentiate the signaling state. The dynamics of global phosphorylation were monitored by tandem MS/MS subsequent to iTRAQ labeling and TiO2 enrichment of phosphopeptides (supplemental Figure 5A). Activation of corresponding RTKs induced tyrosine phosphorylation in whole-cell lysates serving as an internal validation (supplemental Figure 5B-C). A total of 7319 phosphosites corresponding to 2173 unambiguous phosphoproteins were identified, a substantial fraction of which overlapped between the 4 experimental conditions in 3 distinct models of ALL (21.4% phosphosites and 43.5% phosphoproteins, respectively) (Figure 3A; supplemental Figure 5D; supplemental Table 3). Generic and unique phosphoregulated proteins were functionally categorized, reflecting a high diversity of signaling processes between models (supplemental Figure 5E). Next, we screened for phosphoregulated targets with druggable enzymatic activity applying stringent filtering conditions [cutoff: log(fold change A) × log(fold change B) > 1 at ≥3 time points and in ≥2 independent PDX models] and identified PAK2 as a potential candidate in FLT3L-stimulated ALLs (Figure 3B-C; supplemental Figure 5E). Phosphoregulated sites were discernible at S141/143 of the regulatory domain of PAK2 (Figure 3B-C; supplemental Figure 7A; supplemental Table 3). FLT3-dependent phosphoregulation at S141 of PAK2 was independently confirmed in XT-ALL22089 and FLT3-amplified SEM pro-B ALL cells. Conversely, pharmacological inhibition of FLT3 by midostaurin (PKC412) or lestaurtinib (CEP-701) reduced baseline phosphorylation at S141 of PAK2 as shown by immunoblot analysis (Figure 4A).
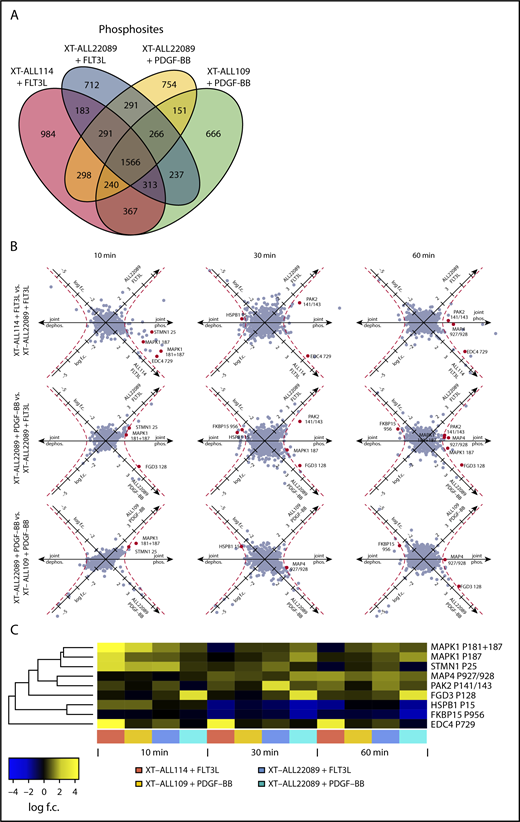
RTK-activation induced phosphoregulation in PDX-ALLs. (A) Venn diagram depicting total number and overlap of phosphosites identified by tandem MS/MS of XT-ALL114 cells stimulated with FLT3L, XT-ALL22089 cells stimulated with PDGF-BB or FLT3L, and XT-ALL109 cells stimulated with PDGF-BB, respectively. Data were combined from triplicate experiments each comprising all time points of stimulation. (B) Visualization of FLT3L and PDGF-BB induced phosphoregulation over a time course using a log2-transformed scale in 9 pairwise comparisons with varying cellular context. Axis denotes direction of phosphoregulation. Red dashed line corresponds to geometric mean of log scale fold-changes > 1; red dots represent regulated phosphosites with similar regulation in 3 of 9 comparisons. (C) Heat map visualizes fold-change of phosphoregulation of red marked phosphosites from panel B. Log f.c., logarithmic fold-change.
RTK-activation induced phosphoregulation in PDX-ALLs. (A) Venn diagram depicting total number and overlap of phosphosites identified by tandem MS/MS of XT-ALL114 cells stimulated with FLT3L, XT-ALL22089 cells stimulated with PDGF-BB or FLT3L, and XT-ALL109 cells stimulated with PDGF-BB, respectively. Data were combined from triplicate experiments each comprising all time points of stimulation. (B) Visualization of FLT3L and PDGF-BB induced phosphoregulation over a time course using a log2-transformed scale in 9 pairwise comparisons with varying cellular context. Axis denotes direction of phosphoregulation. Red dashed line corresponds to geometric mean of log scale fold-changes > 1; red dots represent regulated phosphosites with similar regulation in 3 of 9 comparisons. (C) Heat map visualizes fold-change of phosphoregulation of red marked phosphosites from panel B. Log f.c., logarithmic fold-change.
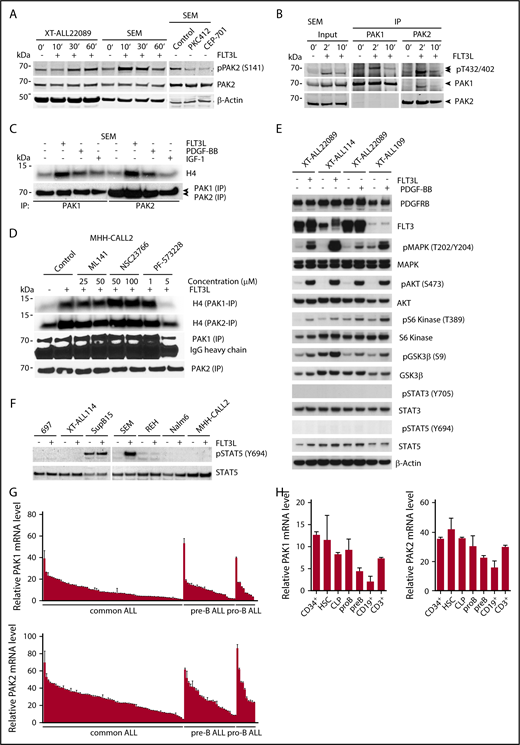
Expression and activity of group I PAKs in ALL. (A) Immunoblot analysis of PAK2 S141 phosphorylation in XT-ALL22089 and SEM cells after FLT3L stimulation or pharmacological inhibition of FLT3 with PKC412 or CEP-701 compared with solvent control. PAK2 S141 phosphorylation was observed in additional FLT3-expressing XT-ALLs and ALL cell lines (supplemental Figure 7G-H). β-actin served as loading control. (B) Immunoprecipitation (IP) of PAK1 vs PAK2 and phosphoimmunoblot analysis of pT402/432 in catalytic domains of PAK2 and PAK1, respectively. SEM cells were stimulated with FLT3L and harvested at indicated times. Pull-down efficiencies were determined by PAK1/PAK2–directed immunoblot analysis. Input control using approximately one-tenth of protein lysate. Arrowheads mark specific PAK isoforms. (C) Growth factor (FLT3L, PDGF-BB, IGF-1) stimulation leads to activation of PAK1 and PAK2 in SEM cells as demonstrated by IVK assay using H4 as substrate. (D) IVK assay after PAK1 or PAK2 IP in FLT3L-stimulated MHH-CALL2 cells treated with CDC42 inhibitor ML141, RAC1 inhibitor NSC23766, and FAK inhibitor PF-573228 at indicated concentrations compared with nonstimulated, untreated control. (E) Phosphoimmunoblot of growth factor induced canonical signaling pathways including MAPK, AKT, S6 kinase, GSK3β, STAT3, and STAT5 in 3 distinct XT-ALLs. β-actin served as loading control. (F) Phosphoimmunoblot of STAT5 activation (pY694) in various ALL models upon FLT3L stimulation. Total STAT5a/b served as loading control. (G) Mean relative expression plus or minus SD of PAK1 and PAK2 transcripts in primary B-cell precursor ALLs (n = 122) was determined by RT-PCR normalized toward β2-microglobulin. (H) In analogy to panel G, mean relative expression of PAK1 and PAK2 transcripts plus or minus SD in HSCs, lymphopoietic precursors (CLP, pro-B, pre-B), mature peripheral blood CD19+ B cells, and CD3+ T cells. CD34+ hematopoietic stem/precursor cells were purified from umbilical cord blood (refer also to supplemental Figure 1D). mRNA, messenger RNA.
Expression and activity of group I PAKs in ALL. (A) Immunoblot analysis of PAK2 S141 phosphorylation in XT-ALL22089 and SEM cells after FLT3L stimulation or pharmacological inhibition of FLT3 with PKC412 or CEP-701 compared with solvent control. PAK2 S141 phosphorylation was observed in additional FLT3-expressing XT-ALLs and ALL cell lines (supplemental Figure 7G-H). β-actin served as loading control. (B) Immunoprecipitation (IP) of PAK1 vs PAK2 and phosphoimmunoblot analysis of pT402/432 in catalytic domains of PAK2 and PAK1, respectively. SEM cells were stimulated with FLT3L and harvested at indicated times. Pull-down efficiencies were determined by PAK1/PAK2–directed immunoblot analysis. Input control using approximately one-tenth of protein lysate. Arrowheads mark specific PAK isoforms. (C) Growth factor (FLT3L, PDGF-BB, IGF-1) stimulation leads to activation of PAK1 and PAK2 in SEM cells as demonstrated by IVK assay using H4 as substrate. (D) IVK assay after PAK1 or PAK2 IP in FLT3L-stimulated MHH-CALL2 cells treated with CDC42 inhibitor ML141, RAC1 inhibitor NSC23766, and FAK inhibitor PF-573228 at indicated concentrations compared with nonstimulated, untreated control. (E) Phosphoimmunoblot of growth factor induced canonical signaling pathways including MAPK, AKT, S6 kinase, GSK3β, STAT3, and STAT5 in 3 distinct XT-ALLs. β-actin served as loading control. (F) Phosphoimmunoblot of STAT5 activation (pY694) in various ALL models upon FLT3L stimulation. Total STAT5a/b served as loading control. (G) Mean relative expression plus or minus SD of PAK1 and PAK2 transcripts in primary B-cell precursor ALLs (n = 122) was determined by RT-PCR normalized toward β2-microglobulin. (H) In analogy to panel G, mean relative expression of PAK1 and PAK2 transcripts plus or minus SD in HSCs, lymphopoietic precursors (CLP, pro-B, pre-B), mature peripheral blood CD19+ B cells, and CD3+ T cells. CD34+ hematopoietic stem/precursor cells were purified from umbilical cord blood (refer also to supplemental Figure 1D). mRNA, messenger RNA.
Reanalysis of iTRAQ-MS/MS data under less stringent filtering conditions revealed a ≥1.5 < 2.0-fold phosphoregulation at T212 of PAK1 in FLT3- as well as PDGF-BB–stimulated XT-ALLs (supplemental Table 3). To evaluate the effect of RTK-dependent signaling on PAK1 and PAK2 activities, we examined the catalytic loops of both isoforms. We observed a rapid and short-lived induction of T432/T402 phosphorylation at catalytic sites of both PAK1 and PAK2 in SEM cells (Figure 4B). Activation of PAK1 and PAK2 by different growth factors (FLT3L, PDGF-BB, or IGF-1) was further confirmed in various ALL cell lines by IVK assay, suggesting that PAK1 and PAK2 act as signaling hubs in a variety of RTK-dependent circuits in ALL (Figure 4C; supplemental Figure 7B). To decipher signaling events downstream of RTKs, we evaluated RAC1, CDC42, and focal adhesion kinase (FAK) as potential activators of PAK as previously described.13,19 As demonstrated in MHH-CALL2 cells, FLT3L-induced PAK activities were not affected by pharmacological inhibition of RAC1 or CDC42. In contrast, inhibition of FAK resulted in decreased PAK activities suggesting FAK as an upstream activator of PAK (Figure 4D). PDX-ALL models selected for iTRAQ-MS/MS recruited canonical signaling pathways (MAPK, phosphatidylinositol 3-kinase [PI3K], S6 kinase, glycogen synthase kinase 3-β [GSK3-β]) upon stimulation of RTK without activation (ie, Y694 phosphorylation) of STAT5 (Figure 4E). This latter observation was confirmed in a variety of ALL lines except for FTL3-amplified SEM ALL exhibiting a marked phosphorylation of STAT5 Y694 upon stimulation with FLT3L. BCR-ABL–rearranged SupB15 and FTL3ITD MV4-11 cells showed constitutive phosphorylation of STAT5 Y694 due to aberrant direct activation of STAT5 by BCR-ABL and mislocalized FLT3ITD, respectively (Figure 4F; supplemental Figure 7C).19-21
As a next step, we evaluated the presence of group I PAKs in a more comprehensive manner by measuring their transcripts in a large cohort (n = 122) of primary BCP-ALL, ALL cell lines, and in FACS-sorted lymphopoietic precursor cells using reverse transcription–polymerase chain reaction (RT-PCR). PAK1 and PAK2 were almost ubiquitously but variably expressed across BCP-ALL, ALL cell lines as well as in hematopoietic stem cells (HSCs) and lymphopoietic precursor cells (Figure 4G-H; supplemental Figure 7D-E; supplemental Table 4). By contrast, PAK3 lacked significant expression at transcript and protein levels in the lymphopoietic lineage including ALL (supplemental Figure 7F-H).
PAK inhibition affects in vitro growth and survival of ALL cells
Based on the hypothesis that generic elements of RTK-dependent circuits mediate cellular survival in ALL, we selected PAK1 and PAK2 for further functional analysis. To modulate PAK expression, we applied RNAi using several independent sh/small interfering RNA directed against PAK1 (n = 3) or PAK2 (n = 5) that caused moderate antiproliferative or proapoptotic effects depending on the targeted isoform and its level of repression (supplemental Figure 8A-F). To decipher and preclude compensatory effects between group I PAK isoforms, we used a tetracycline-inducible (Tet-on) RNAi system that allowed for efficient isoform-specific or combined repression of PAK1 and PAK2. To this end, we established lentivirally (pLKO-Tet-on) transduced SEM single-cell clones expressing fluorescent reporters to track single or double PAK knockdown cells (Figure 5A). Upon induction of single PAK1 or combined PAK1/PAK2 knockdown, we observed a significantly increased apoptosis of SEM cells as demonstrated by annexin V/PI FACS scan and caspase 3/7 cleavage assay. In contrast, repression of PAK2 alone had only subtle effects on cell viability (Figure 5A; supplemental Figure 8G-I). Intriguingly, both PAK1 and PAK2 depletion enhanced the antiproliferative effects of midostaurin (PKC412) on SEM cells (Figure 5B).
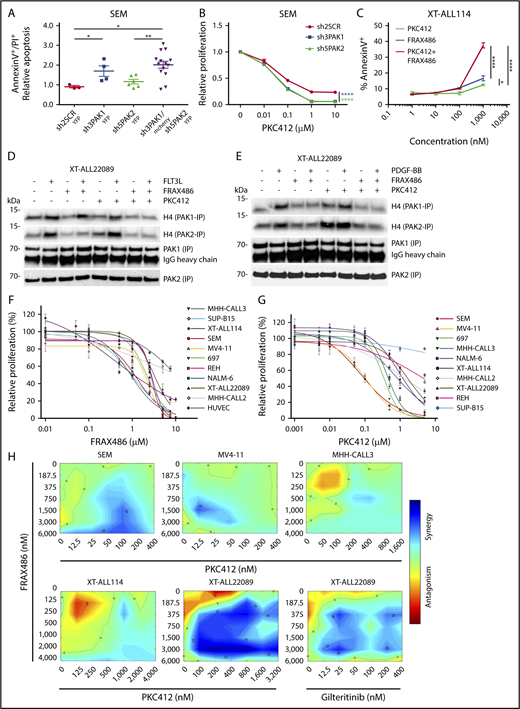
Inhibition of group I PAKs causes cytotoxicity in various ALL and shows synergism with FLT3 inhibition in FLT3-driven ALL. (A) Apoptosis of pro-B SEM cells under PAK-directed tetracycline-induced RNAi. Mean fold-change plus or minus SD of apoptosis is shown in YFP+ shPAK1- or shPAK2-expressing single-cell clones vs mCherry and YFP double-positive shPAK1 and shPAK2–coexpressing cells compared with shSCR-YFP (scrambled RNA) control (also see supplemental Figure 8G-I). shRNA sequences are listed according to indicated shRNA number in supplemental Methods. Mann-Whitney U test; *P ≤ .05; **P < .01. (B) Proliferation of pro-B SEM cells under treatment with titrated concentrations of midostaurin (PKC412) and simultaneous PAK1 or PAK2-directed RNAi compared with shSCR control shown by MTT assay. (C) Apoptosis of FLT3WT-dependent XT-ALL114 under treatment with titrated concentrations of ATP-competitive group I PAK inhibitor FRAX486 or midostaurin (PKC412) and combination of both at equimolar concentrations. Early apoptosis measured by annexin V FACS analysis (also see supplemental Figure 9I). (B-C) Two-way ANOVA test; *P < .05; **P < .01; ****P < .0001). (D-E) Analysis of PAK1 and PAK2 activities in FLT3D835H and PDGFRBWT coexpressing XT-ALL22089 under ligand stimulation (D, FLT3L; E, PDGF-BB) and treatment with FRAX486 or PKC412 or a combination of FRAX486 and PKC412 using radioactive IVK with H4 as kinase substrate after PAK1/2 IP. (F-G) MTT assays depicting pharmacosensitivities of genetically distinct BCP-ALL including XT-ALL and ALL lines toward FRAX486 (F) and midostaurin (PKC412) (G). FLT3ITD-carrying monocytic MV4-11 and endothelial HUVEC cell lines included as controls. Mean plus or minus SD of technical triplicates is given. Biological replicates yielded similar results. (H) Synergism between FRAX486 and midostaurin (PKC412) or gilteritinib in different FLT3-dependent leukemia models. Color bar represents degree of synergism vs antagonism. Assay was based on IC50 measurements of leukemia cells exposed to single drug. Synergy plots were generated using the Combenefit tool.18
Inhibition of group I PAKs causes cytotoxicity in various ALL and shows synergism with FLT3 inhibition in FLT3-driven ALL. (A) Apoptosis of pro-B SEM cells under PAK-directed tetracycline-induced RNAi. Mean fold-change plus or minus SD of apoptosis is shown in YFP+ shPAK1- or shPAK2-expressing single-cell clones vs mCherry and YFP double-positive shPAK1 and shPAK2–coexpressing cells compared with shSCR-YFP (scrambled RNA) control (also see supplemental Figure 8G-I). shRNA sequences are listed according to indicated shRNA number in supplemental Methods. Mann-Whitney U test; *P ≤ .05; **P < .01. (B) Proliferation of pro-B SEM cells under treatment with titrated concentrations of midostaurin (PKC412) and simultaneous PAK1 or PAK2-directed RNAi compared with shSCR control shown by MTT assay. (C) Apoptosis of FLT3WT-dependent XT-ALL114 under treatment with titrated concentrations of ATP-competitive group I PAK inhibitor FRAX486 or midostaurin (PKC412) and combination of both at equimolar concentrations. Early apoptosis measured by annexin V FACS analysis (also see supplemental Figure 9I). (B-C) Two-way ANOVA test; *P < .05; **P < .01; ****P < .0001). (D-E) Analysis of PAK1 and PAK2 activities in FLT3D835H and PDGFRBWT coexpressing XT-ALL22089 under ligand stimulation (D, FLT3L; E, PDGF-BB) and treatment with FRAX486 or PKC412 or a combination of FRAX486 and PKC412 using radioactive IVK with H4 as kinase substrate after PAK1/2 IP. (F-G) MTT assays depicting pharmacosensitivities of genetically distinct BCP-ALL including XT-ALL and ALL lines toward FRAX486 (F) and midostaurin (PKC412) (G). FLT3ITD-carrying monocytic MV4-11 and endothelial HUVEC cell lines included as controls. Mean plus or minus SD of technical triplicates is given. Biological replicates yielded similar results. (H) Synergism between FRAX486 and midostaurin (PKC412) or gilteritinib in different FLT3-dependent leukemia models. Color bar represents degree of synergism vs antagonism. Assay was based on IC50 measurements of leukemia cells exposed to single drug. Synergy plots were generated using the Combenefit tool.18
To take this observation forward into a PAK-directed therapeutic setting, we tested an allosteric and various ATP-competitive PAK inhibitors with regard to proliferation and viability of RTK-dependent ALL. First, the allosteric PAK group I inhibitor IPA-3, which provides enhanced specificity compared with ATP-competitive compounds, markedly induced apoptosis in various ALL models compared with its derivative control compound PIR3.5 (supplemental Figure 9A-C).22 Second, we assessed the sensitivity of ALL cells toward the pan-PAK inhibitor PF-3758309, an ATP-competitive compound, with rather selective activity against PAK1 of group 1 and equipotent activity against group II PAKs (PAK4-6). PF-3758309 treatment significantly decreased viability of FLT3-driven XT-22089 and SEM cells in a dose-dependent manner but its in vivo use is hampered by substantial drug efflux and low bioavailability (supplemental Figure 9D-G).23,24 Third, we evaluated FRAX486, a compound based on a pyrido-[2,3-d]-pyrimidine-7-one core, which exhibits group I PAK selectivity and low affinity off-target effects on RTKs.25 FRAX486 exerted potent proapoptotic effects on FLT3-dependent XT-ALLs, which were augmented by the combined use of midostaurin (Figure 5C; supplemental Figure 9H-I). Importantly, FRAX486 treatment of FTL3D835H XT-ALL22089 and various FLT3-expressing ALL lines inhibited baseline and FLT3L-induced activities of PAK1 and PAK2, surpassing the repressive effects of midostaurin (Figure 5D-E; supplemental Figure 10A-B). Combined treatment of XT-ALL22089 with FRAX486 and midostaurin resulted in the strongest inhibition of FLT3L-induced PAK activities. Inhibitory effects of FRAX486 on PAK1 and PAK2 were recapitulated upon PDGF-BB stimulation of XT-ALL22089, whereas midostaurin had no effect on PDGF-BB–induced PAK activities as expected (Figure 5D-E). It has previously been shown that FRAX486 inhibits recombinant PAK1 and PAK2 with nanomolar potency (50% inhibitory concentration [IC50] = 8.25 and 39.5 nM, respectively).26 The slightly greater inhibitory potency of FRAX486 toward PAK1 compared with PAK2 could not be confirmed in our cell-based assays requiring substantially higher IC50, but it was recapitulated in a cell-free IVK assay using recombinant, constitutively active PAK proteins (supplemental Figure 10C). To gain a more comprehensive and rigorous overview of drug sensitivities of ALL toward FRAX486 compared with midostaurin, we tested a variety of XT-ALL and ALL lines as well as monocytic MV4-11 and endothelial HUVEC cell lines as controls in MTT assays (Figure 5F-G). We observed up to ∼2.5-fold differential sensitivities toward FRAX486 in the majority of ALL models tested. FLT3-driven XT-ALL114 and SEM ALL, E2A-PBX1+ MHH-CALL3, and BCR-ABL–driven SupB15 cells exhibited greatest sensitivities (IC50 ∼ 1.0 μM), whereas hyperdiploid MHH-CALL2 and control HUVEC cells proved to be more resistant. In comparison, sensitivities of ALL models to midostaurin varied by ∼1 log with FLT3-amplified SEM and FLT3ITD MV4-11 control cells being the most sensitive ones (IC50 ∼ 100 nM) as anticipated. To test synergism between FRAX486 and midostaurin in MTT assays, we selected 5 FLT3-dependent leukemia models, treated with titrated drug combinations based on IC50 measurements, and calculated synergy using Combenefit.18 We identified a varying degree of synergism in each model, however, XT-ALL22089, moderately sensitive toward single drugs, proved to be an outstanding example of synergistic effects of dual inhibition, which was recapitulated by a combination of FRAX486 and gilteritinib indicative of FLT3-specific effects (Figure 5H).
FRAX486 increases the antileukemic efficacy of PKC412 in vivo
To assess the antileukemic efficacy of PAK inhibition in vivo, we used FRAX486, which exhibits favorable pharmacokinetic properties upon subcutaneous injection and ameliorates fragile X syndrome phenotypes in Fmr knockout mice.26 A 2-week course of subcutaneous FRAX486 applied to xenografted NSG mice resulted in a dose-dependent remission of XT-ALL22089 compared with control-treated animals without discernible side effects (Figure 6A; supplemental Figure 11A). Based on the observation of increased antileukemic efficacy under simultaneous FLT3 and PAK inhibition in vitro, we consequently evaluated the leukemia progression-free survival under a combined regimen of FRAX486 and midostaurin in comparison with midostaurin or control treatment each scheduled as a 2-week induction course. To this end, 3 cohorts of XT-ALL22089–engrafted NSG mice were treated with (1) FRAX486 (20 mg/kg daily subcutaneously) and midostaurin (100 mg/kg daily) applied by oral gavage (n = 9 mice), (2) midostaurin (100 mg/kg daily) alone (n = 10 mice), or (3) vehicle control via oral gavage (n = 7 mice). Because of midostaurin-related gastrointestinal side effects, a dose reduction was implemented after 7 days in monotherapy as well as combined regimen arms (midostaurin, 50 mg/kg daily; FRAX486, 10 mg/kg daily). Treatment duration was prolonged to 3 weeks, but mice in the combination arm did not reach the cumulative doses of midostaurin and FRAX486 as intended because treatment had to be interrupted to allow mice to recover from sustained weight losses. Over the course of treatment, mice given FRAX486 and midostaurin combined exhibited significantly less leukemia burden than animals treated with midostaurin alone or vehicle control (Figure 6B-C; supplemental Figure 11B-C). In accordance with in vitro observations of synergistic dual inhibition of RTK and PAK activities, Kaplan-Meier analyses demonstrated significantly prolonged leukemia progression-free survival after combined treatment with FRAX486 and midostaurin compared with midostaurin monotherapy and control cohorts (Figure 6D).
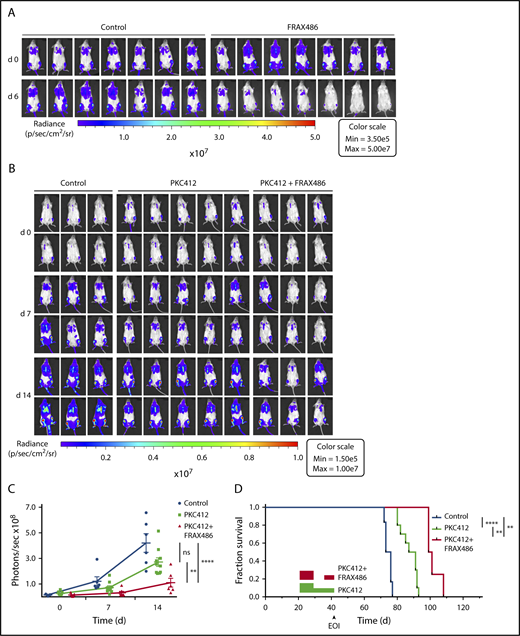
PAK inhibitor FRAX486 induces remission of ALL and prolongs survival in combination with midostaurin. (A) In vivo bioluminescent imaging of G-Luc transgenic ALL22089 xenografted in NSG mice on days 0 and 6 of a treatment course with FRAX486 (20 mg/kg daily). Control animals were treated with solvent in buffer. Color bar represents photon emission per second (also see supplemental Figure 11A). (B) In analogy to panel A in vivo imaging of G-Luc ALL22089 xenografted NSG mice on days 0, 7, and 14 of PKC412 monotherapy vs combined PKC412 and FRAX486 treatment compared with vehicle-treated controls. (C) Photon emissions per cohort and day of treatment are presented as mean plus or minus SD of photons per second in a dot plot. Mann-Whitney U test, 2-tailed; **P < .01; ***P < .001 (for day 21 imaging data refer to supplemental Figure 11B-C). (D) Kaplan-Meier analysis of leukemia progression-free survival of G-Luc ALL22089 xenografted NSG mice treated with midostaurin vs midostaurin in combination with FRAX486 compared with vehicle control. Rectangular boxes: red, combined treatment; green, PKC412 monotherapy. Note dose reduction and treatment pause due to gastrointestinal toxicity. Three mice were lost in the combined regimen arm due to gastrointestinal toxicity and 1 mouse in the control arm died during imaging under general anesthesia. Log-rank test; **P < .01; ****P < .0001. EOI, end of induction treatment; ns, not significant.
PAK inhibitor FRAX486 induces remission of ALL and prolongs survival in combination with midostaurin. (A) In vivo bioluminescent imaging of G-Luc transgenic ALL22089 xenografted in NSG mice on days 0 and 6 of a treatment course with FRAX486 (20 mg/kg daily). Control animals were treated with solvent in buffer. Color bar represents photon emission per second (also see supplemental Figure 11A). (B) In analogy to panel A in vivo imaging of G-Luc ALL22089 xenografted NSG mice on days 0, 7, and 14 of PKC412 monotherapy vs combined PKC412 and FRAX486 treatment compared with vehicle-treated controls. (C) Photon emissions per cohort and day of treatment are presented as mean plus or minus SD of photons per second in a dot plot. Mann-Whitney U test, 2-tailed; **P < .01; ***P < .001 (for day 21 imaging data refer to supplemental Figure 11B-C). (D) Kaplan-Meier analysis of leukemia progression-free survival of G-Luc ALL22089 xenografted NSG mice treated with midostaurin vs midostaurin in combination with FRAX486 compared with vehicle control. Rectangular boxes: red, combined treatment; green, PKC412 monotherapy. Note dose reduction and treatment pause due to gastrointestinal toxicity. Three mice were lost in the combined regimen arm due to gastrointestinal toxicity and 1 mouse in the control arm died during imaging under general anesthesia. Log-rank test; **P < .01; ****P < .0001. EOI, end of induction treatment; ns, not significant.
Discussion
Signaling processes underlying the malignant phenotype of ALL are largely undefined. We took a functional approach to link the growth-promoting activity of ligand-activated RTKs with phosphoproteomic layers of cellular regulation because the interrogation of the signaling behavior at its basal (or constitutively active) state might lack valuable information on signal processing and interpretation toward biological output due to prioritization of dynamic range over signal strength or counterbalancing feedback mechanisms, which mask oncogenic signaling in ALL.27-29 Despite a considerable phosphoproteomic similarity at baseline, potentiated phosphoregulated networks differed between individual receptors in the same cellular context and between identical RTKs expressed in distinct although related ALL cell types. As a common theme, generic growth signals were transmitted via signaling circuits with few common features largely confined to MAPK/AKT, RS6K1, microtubule assembly, and others (supplemental Figure 5E). Among overlapping phosphoregulated proteins, we identified PAK1 and PAK2, which have been implicated in oncogenic pathways of cancer.13 Notably, in a supervised analysis of iTRAQ-MS/MS data sets, we mined a substantial fraction of previously known group I PAK substrates assigned to diverse functions such as growth signaling, cell motility, survival, and others, rendering correlative evidence of PAK-dependent phosphoregulation in RTK-driven pathways (supplemental Figure 6).
In ALL, FAK might serve as a functional link between RTK and PAK activation, although RTK signaling to PAK via FAK did not involve RAC1 and CDC42 as canonical activators of PAK1 in contrast to a previously reported scenario in myeloid 32D cells.19 In an effort to identify PAK-binding partners, we performed MS/MS after PAK immunoprecipitation and detected GTPases GIT1/2 and ARGHEF6, which may undergo tyrosine phosphorylation and constitute potential activators of PAK as well as substrates of RTK signaling (supplemental Table 5). In regard to downstream signaling events, the cytoskeletal regulator and vinblastine target stathmin exhibited the strongest phosphoregulation among established PAK substrates (supplemental Figures 5E and 6). In addition, BAD and CRAF are plausible PAK targets that are involved in apoptosis, but they lacked consistent RTK-dependent phosphoregulation as shown by iTRAQ-MS/MS.13,30 As a novel, potentially relevant PAK target, we identified swiprosin (EFHD2) as a PAK-binding partner involved in B-cell receptor signaling and apoptosis (supplemental Table 5).31,32 In FLT3ITD- and BCR-ABL–driven models of leukemogenesis, PAKs appear to target the transcription factor STAT5, which is indispensable for transformation of BCR-ABL– or TEL-JAK2–rearranged B-progenitor cells.20,33 In a BCR-ABL context, PAK1 has been reported to directly interact with STAT5, which is targeted for phosphorylation at S780 leading to nuclear translocation independent of Y694 phosphorylation and dimerization of STAT5 molecules.34 We detected STAT5a phosphorylation at S780 in our PDX-ALL models, however, neither significant phosphoregulation of S780 nor phosphorylation of Y694 was discernible, which could be biased by incomplete coverage and insufficient enrichment of tyrosine-phosphorylated peptides by TiO2 (supplemental Figure 6; supplemental Table 3). Nevertheless, pY694-STAT5–directed immunoblot analyses revealed STAT5 activation only in FLT3ITD-carrying or FLT3-amplified cells in contrast to FLT3WT, FLT3D835H, or PDGFRBWT in accordance with previous reports on mislocalized FLT3ITD aberrantly activating STAT5 in contrast to FTL3WT (Figure 4E-F; supplemental Figure 7C).21
RTK-directed therapeutic approaches have been pursued in KMT2A-rearranged ALL overexpressing FLT3WT or specific types of Ph-like ALL of childhood.4,35 Tyrosine kinase inhibitor (TKI) monotherapy has demonstrated potential efficacy, but there is consensus that patients will benefit most from a combination with chemotherapy to prevent selection or acquisition of resistance mutations toward TKI as demonstrated for midostaurin in the treatment of adult FLT3-mutated AML.36 Our studies suggest that a functional network-directed approach to leukemia signaling may extend our knowledge of therapeutic options beyond genetically defined targets. The strong inhibitory effect of FRAX486 on PAK1 and PAK2 catalytic activities in PDX-ALL indicates a predominant ATP-competitive mechanism, although additional effects on the scaffolding function of PAK or off-target upstream RTKs cannot be excluded.25,37 Further preclinical tests are needed to evaluate the feasibility of a simultaneous RTK and PAK inhibition in combination with chemotherapy to improve the depth of remission and decrease the risk of relapse in suitable models of RTK-dependent ALL. In analogy to FVB and C57BL/6 mouse models of neuropsychiatric disease, FRAX486 monotherapy did not cause major side effects in our NSG PDX-ALL model.26,38 However, FRAX486 aggravated gastrointestinal side effects of simultaneously administered midostaurin. A detailed preclinical analysis of the safety profile of PAK inhibitors is still missing. In particular, the undisputed role of PAK2 in angiogenic signaling and its presumptive function in HSC maintenance need to be addressed before PAK inhibitors enter clinical trials.13,39 Notwithstanding this cautionary note, our study represents a proof of concept of how functional interrogation of RTK-dependent signaling circuits identifies potential therapeutic targets in childhood ALL.
The mass spectrometry data reported in this article have been deposited in the Proteomics Identifications Database (project name: ALL leukemia; accession number PRD000749). The SNP array data reported in this article have been deposited in the Gene Expression Omnibus database (super series accession number GSE42054).
The full-text version of this article contains a data supplement.
Acknowledgments
The authors thank Arne Düsedau (Heinrich Pette Institute) for flow cytometry sorting, Axel Leingärtner and Michael Horn-Glander for in vivo imaging (University Cancer Center Hamburg at Universitätsklinikum Hamburg-Eppendorf), and Dagmar Grabowski and Sonja Bartl (Department of Pediatric Oncology, University Medical Center Hamburg) for technical assistance.
This work was supported by Fördergemeinschaft Kinderkrebs–Zentrum Hamburg e.V., Madeleine Schickedanz KinderKrebsStiftung, Burkhard Meyer Stiftung and Ministerium für Kultur und Wissenschaft des Landes Nordrhein–Westfalen, Regierende Bürgermeister von Berlin–inkl. Wissenschaft und Forschung, and Bundesministerium für Bildung und Forschung. P.N. and A.S. received support from Bundesministerium für Bildung und Forschung for MedSys Project SARA 31P5800.
Authorship
Contribution: I.-K.S., K.D., and S.P. performed research, analyzed data, and wrote parts of the paper; M.K., S.B., F.B., M.T., K.G., V.M., M.K.-N., H.G., J.M., and L.B. performed research and analyzed data; J.S. performed research, analyzed data, and revised the manuscript; A.W. performed and supervised animal experiments; M. Bockmayr performed bioinformatics analyses and wrote parts of the paper; M. Blohm provided critical patient samples and revised the manuscript; I.J. provided essential experimental tools and models; R.P.Z. and A.S. supervised and analyzed phosphoproteomics; and P.N. and M.A.H. jointly designed and supervised the work and wrote the paper.
Conflict-of-interest disclosure: The authors declare no competing financial interests.
Correspondence: Martin A. Horstmann, Research Institute Children’s Cancer Center Hamburg, Department of Pediatric Hematology and Oncology, University Medical Center Hamburg, Martinistr 52, 20246 Hamburg, Germany; e-mail: horstman@uke.de.

