

Key Points
Deregulation of Notch1 signaling in mature murine B cells promotes Treg and Th2 cell–dominant T-cell responses via IL-33.
The activation signature of Notch signaling in human DLBCL parallels IL33 expression and Treg cell–rich gene-expression signatures.

Abstract
The Notch-signaling pathway in a variety of mature B-cell neoplasms is often activated by gene alterations, but its role remains unclear. Here, we show that B cells harboring dysregulated activation of Notch1 signaling have an immunomodulatory effect on T cells by amplifying regulatory T (Treg) and T helper 2 (Th2) cell responses in an interleukin-33 (IL-33)-dependent manner. A conditional mouse model, in which constitutive expression of an active form of Notch1 is induced in B cells by Aicda gene promoter-driven Cre recombinase, revealed no obvious phenotypic changes in B cells; however, mice demonstrated an expansion of Treg and Th2 cell subsets and a decrease in cytokine production by Th1 and CD8+ T cells. The mice were susceptible to soft tissue sarcoma and defective production of CD8+ T cells specific for inoculated tumor cells, suggesting impaired antitumor T-cell activity. Gene-expression microarray revealed that altered T-cell responses were due to increased IL-33 production by Notch1-activated B cells. Knockout of IL33 or blockade of IL-33 by a receptor-blocking antibody abrogated the Treg and Th2 cell–dominant T-cell response triggered by B cells. Gene-expression data derived from human diffuse large B-cell lymphoma (DLBCL) samples showed that an activated Notch-signaling signature correlates positively with IL33 expression and Treg cell–rich gene-expression signatures. These findings indicate that B cells harboring dysregulated Notch signaling alter T-cell responses via IL-33, and suggest that aberrant activation of Notch signaling plays a role in fostering immune privilege in mature B-cell neoplasms.
Introduction
The Notch-signaling pathway plays diverse roles in lymphocyte development and differentiation. Mammalian Notch receptors comprise 4 homologs (Notch1-4) and are associated with broad biological functions in lymphocytes. Notch signaling is activated by ligand binding, upon which the Notch intracellular domain (NICD) is cleaved by ADAM-family metalloproteases and γ-secretase,1-3 translocates to the nucleus, and activates target transcription factors.4,5 Notch1 signaling has a major effect on T-cell lineage commitment and intrathymic T-cell development,6,7 whereas Notch2 plays a key role in progression of transitional B cells to marginal zone B cells.5,8 By contrast, Notch1 expression in mature B cells is increased markedly by activation of B-cell receptor signaling or lipopolysaccharide (LPS),9,10 and Notch1 signaling plays a role in terminal differentiation of B cells.10,11 Germinal center (GC) B cells express both Notch1 and Notch2, and Notch-signaling activity also protects GC B cells from apoptosis.12,13
Genetic alterations in Notch1 and Notch2 occur in B-cell malignancies such as chronic lymphocytic leukemia,14,15 mantle cell lymphoma,16 diffuse large B-cell lymphoma (DLBCL),17,18 and follicular lymphoma (FL),19 as well as in classical Hodgkin lymphoma, which is derived mostly by mature B cells.20,21 Most Notch mutations are localized in the PEST domain, resulting in truncation of the protein via removal of degradation signals14-17,19 ; this causes aberrant activation of Notch signaling.22,23 In addition, loss-of-function mutations in negative regulators of the Notch pathway, such as DTX1 and SPEN, play a role in DLBCL.24,25 These mutations are associated with aggressive B-cell neoplasms14-17,19 ; however, the underlying mechanism(s) remains obscure.
Here, we examined the effect of aberrant Notch1 signaling in mature B cells using transgenic (Tg) mice conditionally expressing an active form of Notch1 (Notch1 intracellular domain [NICD1]) in B cells expressing the Aicda gene. We found that mature B cells showing constitutive expression of NICD1 enhance regulatory T (Treg) and T helper 2 (Th2) cell responses in an interleukin-33 (IL-33)-dependent manner. Moreover, expression-profiling analysis of human DLBCL samples revealed a positive correlation between an activated Notch-signaling signature, IL33 expression, and Treg cell–rich gene-expression signatures. Taken together, the data provide evidence that B cells with aberrant activation of Notch1 signaling exert a novel immunomodulatory function, and suggest that Notch-activating mutations play a role in immune evasion by mature B-cell neoplasms.
Methods
Mice
Aicda-CreTg/Tg/Rosa26-reporter red fluorescent protein knock-in (RFPKI/KI) mice,26-28 conditional CAG-CAT-NICD1Tg/− mice,29 and IL33 knockout (IL33KO/KO) mice30 were previously described. All mice were bred under specific pathogen-free conditions and analyzed at 12 to 14 weeks of age, unless stated otherwise. All animal experiments were approved by the animal research committee of Kyoto University (approval number MedKyo17095).
Flow cytometry, cell sorting (fluorescence-activated cell sorting), and antibodies
Flow cytometry analysis was performed using FACSCalibur and FACSAria II flow cytometers (BD Biosciences, San Jose, CA); data were analyzed with FlowJo software (version 10.1; Tree Star, Stanford, CA). Cell sorting was performed using a FACSAria II cell sorter (BD Biosciences). Antibodies and buffers used for stimulation, fixation, and permeabilization are listed in supplemental Experimental procedures.
Gene-expression analysis by quantitative PCR
Total RNA was extracted using an RNeasy Mini kit (Qiagen, Hilden, Germany) and complementary DNA (cDNA) was synthesized using the SuperScript III First-Strand Synthesis system (Life Technologies, Carlsbad, CA). Quantitative polymerase chain reaction (PCR) was performed using SYBR Premix Ex Taq II (Takara, Shiga, Japan). Relative expression of genes was normalized to ACTB expression. The sequences of the primers used for quantitative PCR are listed in supplemental Experimental procedures.
Microarray-based gene-expression analysis
Total RNA was extracted from splenic CD19+RFP+ B cells (isolated from mice) using an RNeasy Mini kit (Qiagen). Equal amounts of RNA derived from 3 NICD1 mice and 3 control mice were pooled, reverse transcribed, and labeled with cyanin-5 and cyanin-3, respectively, using a Low Input Quick Amp labeling kit (Agilent Technologies, Santa Clara, CA). Labeled complementary RNA was applied to an Agilent SurePrint G3 Mouse 8×60K v2 microarray. The slide was scanned by an Agilent G2505C microarray scanner. Agilent Feature Extraction software (version 10.7.3.1) was used for background subtraction, LOWESS normalization, and calculation of the P value log ratio.
Immunofluorescence staining for IL-33
Splenocytes were isolated from mice, fixed, permeabilized, and incubated with an anti–IL-33 antibody, as described in supplemental Experimental procedures. Cells were then deposited on slides by cytospin centrifugation and mounted in ProLong Diamond Antifade Mountant with 4′,6-diamidino-2-phenylindole (DAPI; Life Technologies). Fluorescence signals generated by fluorescein isothiocyanate (FITC), RFP, and DAPI were imaged using a BZ-8100 fluorescence microscope (Keyence, Osaka, Japan).
In vitro induction of IL-33 expression by B cells upon Notch ligation
Splenic B cells isolated from wild-type (WT) C57BL/6 (B6) mice (gated on B220+CD19+) were stimulated with 5 μg/mL LPS in the presence of irradiated L cells transduced with mock-, Dll1-, Dll4-, or Jagged1-expressing vectors.31 N-[N-(3, 5-difluorophenacetyl)-l-alanyl]-S-phenylglycine t-butyl ester (DAPT; Sigma-Aldrich, St. Louis, MO) was added to block Notch signaling. After 72 hours of culture, the concentration of IL-33 in the culture medium was measured in a bead-based LEGENDplex immunoassay (BioLegend, San Diego, CA). L cells were cultured under the same conditions in the absence of B cells to measure background IL-33 levels. The amount of IL-33 released by B cells was calculated by subtracting the background IL-33 concentration from each measurement. Similarly, splenic B cells isolated from WT B6 mice were stimulated with 5 μg/mL LPS with irradiated L cells transduced with mock- or Dll1-expressing vectors31 for 48 hours with or without an anti–Dll1-blocking antibody (clone HMD1-5; Bio X Cell, West Lebanon, NH), and quantitative reverse transcription PCR was performed for the measurement of gene expression of B cells, as described in “Gene-expression analysis by quantitative PCR.”
Cytokine production assay of T cells cultured with B cells
Splenic CD4+ and CD8+ T cells isolated from WT B6 mice (sorted as CD3+/CD4+ and CD3+/CD8+, respectively) were cocultured with splenic RFP+ B cells isolated from NICD1 mice and controls (sorted as B220+CD19+RFP+) in the presence of Dynabeads Mouse CD3/CD28 T-activator (Invitrogen, Carlsbad, CA) and 5 μg/mL LPS. An anti–IL-33 receptor ST2-blocking antibody (clone DIH4; BioLegend) was added to block IL-33 signaling. After 108 hours, the concentrations of IL-10, IL-4, IL-5, IL-13, and interferon-γ (IFN-γ) in the culture medium was measured in a bead-based LEGENDplex immunoassay (BioLegend). T cells were also cultured under the same conditions in the absence of B cells to measure background levels of T-cell cytokine production.
Evaluation of tumor-specific T-cell responses
Mice (12-14 weeks of age) were injected subcutaneously with 5 × 10⁵ B16-ovalbumin (OVA) melanoma cells.32 At 21 days postinjection, tumor-infiltrating lymphocytes were isolated from tumor cell suspensions by Ficoll-Paque centrifugation (GE Healthcare, Buckinghamshire, United Kingdom). The percentage of OVA-specific CD8+ T cells was determined by flow cytometry. Total RNA was extracted from bulk tumors using TRIzol Reagent (Invitrogen) and cDNA was synthesized, and quantitative PCR was performed as described in “Gene-expression analysis by quantitative PCR.”
Immunohistochemical analysis of DLBCL biopsy specimens
Formalin-fixed, paraffin-embedded biopsy sections from 40 DLBCL patients treated at Kyoto University Hospital were immunohistochemically analyzed for IL-33 expression using an antibody specific for IL-33 (Abcam, Cambridge, MA). Clinical samples and data were used with the approval of the institutional review board of Kyoto University Hospital (approval number E2391) and in accordance with the provisions of the Declaration of Helsinki.
Analysis of European Genome-phenome Archive data sets
Clinical and RNA sequencing (RNA-Seq) gene-expression data derived from the core set of 624 DLBCL samples were obtained from the European Genome-phenome Archive (EGA) (data set identifier [ID]: EGAD00001003600),33 and analyzed as described in supplemental Experimental procedures.
Statistical analysis
Statistical analysis was performed as described in supplemental Experimental procedures.
Results
Deregulated Notch1 signaling in mature B cells does not alter B-cell phenotypes except for an increase in GC B cells
To investigate the effect of activated Notch signaling in mature B cells, we generated a mouse model in which NICD1, an active form of Notch1, was expressed in B cells upon crossing mice carrying the NICD1 transgene preceded by a loxP-flanked transcriptional stopper (CAG-CAT-NICD1)29 with mice carrying both the Aicda-Cre transgene and a Rosa26-reporter KI allele of Cre-inducible RFP.26-28 NICD1 and RFP proteins were expressed constitutively after Aicda promoter-driven expression of Cre recombinase (Figure 1A).27 Aicda-CreTg/−/conditional NICD1Tg/−/Rosa26-reporter RFPKI/WT offspring, designated hereafter as NICD1 mice, and littermate controls (Aicda-CreTg/−/conditional NICD1−/−/Rosa26-reporter RFPKI/WT) exhibited a similar percentage of RFP+ cells within the splenic CD19+ B-cell (5.3% vs 5.1%, respectively) and CD19+CD95+ GC B-cell (77% vs 77%, respectively; Figure 1B) populations. Single-cell PCR genotyping confirmed that a mean 89% of splenic RFP+ B cells but none of the RFP− B or T cells from NICD1 mice carried the genetically activated NICD1 transgene with the loxP-flanked stopper deletion (supplemental Figure 1A). Consequently, NICD1 protein expression increased; in addition, expression of messenger RNA (mRNA) encoding NRARP and Notch3, both direct Notch target genes,34,35 was higher in RFP+ B cells from NICD1 mice than in those from controls (Figure 1C-D). RFP+ cells also accounted for 0.6% to 0.7% of splenic CD3+ T cells in NICD1 mice and controls, as previously reported (Figure 1B).28 The percentage of RFP+ T cells in NICD1 mice and age-matched controls was similar, and activation of the NICD1 transgene did not confer a growth advantage on this small population of T cells.
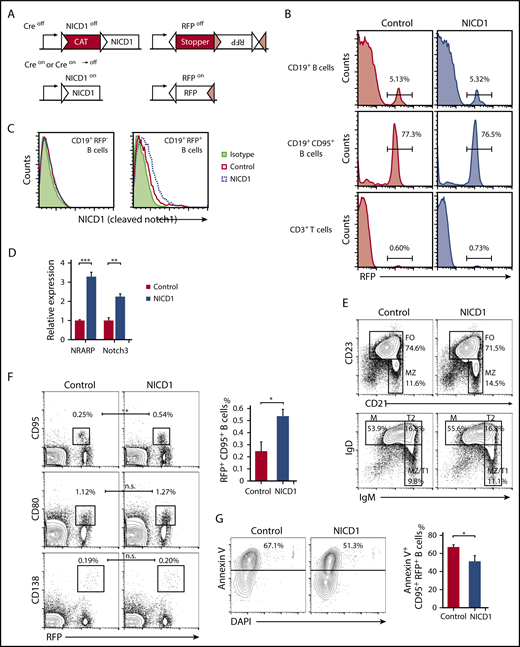
B-cell subsets and characteristics of the conditional mouse model harboring Notch1-activated mature B cells. (A) Schematic structure of the Tg and KI alleles of the Aicda-CreTg/−/conditional NICD1Tg/−/Rosa26-reporter RFPKI/WT mice (NICD1 mice). The NICD1 transgene is preceded by a transcriptional stopper (CAT) flanked by a pair of loxP sites (white triangles). The reporter RFP locus harbors 2 pairs of loxP sites (white and pink triangles) that are pairwise compatible. Constitutive expression of NICD1 and RFP was achieved via Cre-dependent recombination steps involving deletion of the stoppers and inversion of the RFP gene. (B) The percentage of RFP-expressing cells within the splenic CD19+ B-cell, CD19+CD95+ B-cell, and CD3+ T-cell populations of NICD1 mice and controls was evaluated by flow cytometry. (C) NICD1 protein expression in splenic CD19+RFP+ B cells and CD19+RFP− B cells from NICD1 mice and controls, as examined by intracellular flow cytometric analysis. (D) Expression of mRNA encoding NRARP and Notch3 in splenic CD19+RFP+ B cells isolated from NICD1 mice and controls, as evaluated by quantitative PCR. Expression levels are expressed relative to those detected in RFP+ B cells from control mice. (E) CD21 vs CD23 and IgM vs IgD profiles of splenic B220+CD19+ B cells from NICD1 mice and controls, as examined by flow cytometry. (F) RFP vs CD95 and CD80 profiles of splenic B220+CD19+ B cells, and RFP vs CD138 profiles of splenocytes from NICD1 mice and controls. (G) Flow cytometric analysis of apoptotic splenic CD19+CD95+ GC B cells from NICD1 mice and controls, as detected by staining for Annexin V and DAPI. In panels B and E-G, the mean percentage of cells from 3 individual mice per group is shown. In panels D and G, data in the bar graphs are expressed as the mean and standard error of the mean (SEM) from 3 individual mice per group. In panel D, **P < .01 and ***P < .001 (Tukey-Kramer test). In panels F-G, *P < .05 (Student t test). FO, follicular B cell; M, mature B cell; MZ, marginal zone B cell; T1, transitional 1 B cell; T2, transitional 2 B cell.
B-cell subsets and characteristics of the conditional mouse model harboring Notch1-activated mature B cells. (A) Schematic structure of the Tg and KI alleles of the Aicda-CreTg/−/conditional NICD1Tg/−/Rosa26-reporter RFPKI/WT mice (NICD1 mice). The NICD1 transgene is preceded by a transcriptional stopper (CAT) flanked by a pair of loxP sites (white triangles). The reporter RFP locus harbors 2 pairs of loxP sites (white and pink triangles) that are pairwise compatible. Constitutive expression of NICD1 and RFP was achieved via Cre-dependent recombination steps involving deletion of the stoppers and inversion of the RFP gene. (B) The percentage of RFP-expressing cells within the splenic CD19+ B-cell, CD19+CD95+ B-cell, and CD3+ T-cell populations of NICD1 mice and controls was evaluated by flow cytometry. (C) NICD1 protein expression in splenic CD19+RFP+ B cells and CD19+RFP− B cells from NICD1 mice and controls, as examined by intracellular flow cytometric analysis. (D) Expression of mRNA encoding NRARP and Notch3 in splenic CD19+RFP+ B cells isolated from NICD1 mice and controls, as evaluated by quantitative PCR. Expression levels are expressed relative to those detected in RFP+ B cells from control mice. (E) CD21 vs CD23 and IgM vs IgD profiles of splenic B220+CD19+ B cells from NICD1 mice and controls, as examined by flow cytometry. (F) RFP vs CD95 and CD80 profiles of splenic B220+CD19+ B cells, and RFP vs CD138 profiles of splenocytes from NICD1 mice and controls. (G) Flow cytometric analysis of apoptotic splenic CD19+CD95+ GC B cells from NICD1 mice and controls, as detected by staining for Annexin V and DAPI. In panels B and E-G, the mean percentage of cells from 3 individual mice per group is shown. In panels D and G, data in the bar graphs are expressed as the mean and standard error of the mean (SEM) from 3 individual mice per group. In panel D, **P < .01 and ***P < .001 (Tukey-Kramer test). In panels F-G, *P < .05 (Student t test). FO, follicular B cell; M, mature B cell; MZ, marginal zone B cell; T1, transitional 1 B cell; T2, transitional 2 B cell.
Conditional expression of NICD1, driven at the early B-cell developmental stage by the CD19 promoter, increases differentiation toward marginal zone B cells and impairs follicular B-cell differentiation36 ; however, the ratio of splenic follicular B (B220+CD21+CD23+) cells to marginal zone B (B220+CD21highCD23−) cells in our NICD1 mice was not significantly affected, nor were the percentages of splenic transitional 1 (T1) B (B220+IgMhighIgDlow), transitional 2 (T2) B (B220+IgMhighIgDhigh), and mature B (B220+IgMlowIgDint) cells, memory B (CD19+RFP+CD80+) cells, or plasma (B220lowCD138+RFP+) cells (Figure 1E-F; supplemental Figure 1B). The total number and percentage of splenic CD19+ B cells and CD19+RFP+ B cells was also unaffected (Figure 1B). However, the percentage of splenic GC B (CD19+RFP+CD95+) cells in NICD1 mice increased significantly (Figure 1F). Because the percentage of apoptotic cells (determined by Annexin V staining) within the GC B-cell population of NICD1 mice was lower than that in controls (Figure 1G), the increase in the percentage of GC B cells may be due to an antiapoptotic effect of Notch signaling on GC B cells, as previously reported.13 We also evaluated expression of activation markers CD40 and CD86 by splenic RFP+ B cells and found that it was not significantly different in NICD1 mice and controls (supplemental Figure 1C). In summary, specific induction of Notch signaling in mature B cells did not alter B-cell phenotypes, although it did increase the percentage of GC B cells.
NICD1 mice demonstrate Treg and Th2 cell–dominant T-cell responses
Intracellular flow cytometric analysis of splenic T cells revealed an increase in the percentages of Treg (Foxp3+) and Th2 (IL-4+) cells (by 2.0- and 1.4-fold, respectively) in NICD1 mice when compared with those in controls (Figure 2A). Similarly, the percentage of IL-10–producing CD4+ T cells increased 2.5-fold (Figure 2A). By contrast, the percentage of Th1 (IFN-γ+) and Th17 (IL-17A+) cells in NICD1 mice fell by 32% and 45%, respectively, compared with those in controls (Figure 2A). The percentage of IFN-γ–producing CD8+ T cells in NICD1 mice also fell significantly (by 36%; Figure 2B), although that of IFN-γ–producing natural killer (NK; B220mid CD49b+) cells did not change significantly (Figure 2C).
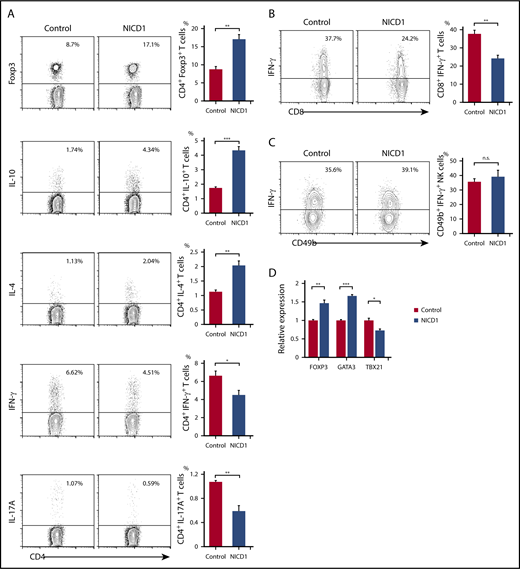
Alteration of T-cell subsets and cytokine production in NICD1 mice. (A) Intracellular flow cytometric analysis of splenic CD3+CD4+ T cells from NICD1 mice and controls. T cells were stimulated with phorbol 12-myristate 13-acetate (PMA), ionomycin, brefeldin A, and monensin for 5 hours before analysis. (B) Intracellular flow cytometric analysis of splenic CD3+CD8+ T cells from NICD1 mice and controls. (C) Intracellular flow cytometric analysis of splenic B220midCD49b+ NK cells from NICD1 mice and controls. In panels A-C, the mean percentage of cells from 3 to 4 individual mice per group is shown. Data in the bar graphs are expressed as the mean and SEM. *P < .05, **P < .01, and ***P < .001 (Student t test). (D) Expression of mRNA encoding FOXP3, GATA3, and TBX21 by splenic CD3+CD4+ T cells isolated from NICD1 mice and controls, as evaluated by quantitative PCR. Expression levels are expressed relative to those detected in CD4+ T cells from control mice. Data in the bar graphs are expressed as the mean and SEM from 4 individual mice per group. *P < .05, **P < .01, and ***P < .001 (Tukey-Kramer test). n.s., not significant.
Alteration of T-cell subsets and cytokine production in NICD1 mice. (A) Intracellular flow cytometric analysis of splenic CD3+CD4+ T cells from NICD1 mice and controls. T cells were stimulated with phorbol 12-myristate 13-acetate (PMA), ionomycin, brefeldin A, and monensin for 5 hours before analysis. (B) Intracellular flow cytometric analysis of splenic CD3+CD8+ T cells from NICD1 mice and controls. (C) Intracellular flow cytometric analysis of splenic B220midCD49b+ NK cells from NICD1 mice and controls. In panels A-C, the mean percentage of cells from 3 to 4 individual mice per group is shown. Data in the bar graphs are expressed as the mean and SEM. *P < .05, **P < .01, and ***P < .001 (Student t test). (D) Expression of mRNA encoding FOXP3, GATA3, and TBX21 by splenic CD3+CD4+ T cells isolated from NICD1 mice and controls, as evaluated by quantitative PCR. Expression levels are expressed relative to those detected in CD4+ T cells from control mice. Data in the bar graphs are expressed as the mean and SEM from 4 individual mice per group. *P < .05, **P < .01, and ***P < .001 (Tukey-Kramer test). n.s., not significant.
Also, we found that expression of FOXP3 and GATA3 (Treg and Th2 cell–specific transcription factors, respectively) increased significantly in splenic CD3+CD4+ T cells of NICD1 mice. By contrast, expression of TBX21, a Th1 cell–specific transcription factor, fell significantly (Figure 2D). These alterations in T-cell subsets could not be attributed to the small population of RFP+ T cells because we found no significant preference for any T-cell subsets within these T-cell populations in NICD1 mice compared with controls (supplemental Figure 2).
Although NICD1 mice did not develop B-cell neoplasms harboring a genetically activated NICD1 transgene during the follow-up period, they often developed soft tissue sarcomas in the extremities, tail, and nasal cavity at ∼1 year of age (Figure 3A-B). Soft tissue sarcoma is a common tumor that develops spontaneously in old WT B6 mice.37,38 None of the tumor samples (n = 7) carried the genetically activated NICD1 transgene (supplemental Figure 1D), suggesting that they did not result from a direct oncogenic effect of NICD1.
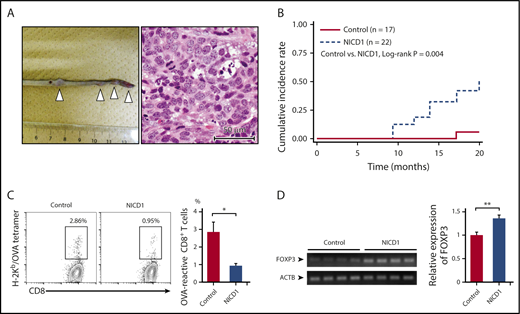
NICD1 mice are susceptible to malignant neoplasms. (A) Representative image showing multiplying soft tissue sarcomas (white triangles) in the tail of NICD1 mice (left) and histological examination by hematoxylin and eosin staining (right). Scale (left panel) in centimeters. (B) Kaplan-Meier curves showing the cumulative incidence rates of soft tissue sarcoma in NICD1 mice and controls. (C) Impaired tumor-specific CD8+ T-cell response in NICD1 mice. NICD1 mice and controls were injected subcutaneously with 5 × 10⁵ B16-OVA melanoma cells. Tumor-infiltrating lymphocytes were isolated and the percentage of OVA-specific CD3+ CD8+ T cells was examined by flow cytometry. The mean percentage of cells from 4 individual mice per group is shown. Data in the bar graphs are expressed as the mean and SEM. *P < .05 (Student t test). (D) Expression of mRNA encoding FOXP3 in inoculated B16-OVA melanoma tissue in NICD1 mice and controls, as evaluated by quantitative PCR. Expression levels are expressed relative to those detected in tumors from control mice. Data in the bar graphs are expressed as the mean and SEM from 4 individual mice per group. **P < .01 (Student t test).
NICD1 mice are susceptible to malignant neoplasms. (A) Representative image showing multiplying soft tissue sarcomas (white triangles) in the tail of NICD1 mice (left) and histological examination by hematoxylin and eosin staining (right). Scale (left panel) in centimeters. (B) Kaplan-Meier curves showing the cumulative incidence rates of soft tissue sarcoma in NICD1 mice and controls. (C) Impaired tumor-specific CD8+ T-cell response in NICD1 mice. NICD1 mice and controls were injected subcutaneously with 5 × 10⁵ B16-OVA melanoma cells. Tumor-infiltrating lymphocytes were isolated and the percentage of OVA-specific CD3+ CD8+ T cells was examined by flow cytometry. The mean percentage of cells from 4 individual mice per group is shown. Data in the bar graphs are expressed as the mean and SEM. *P < .05 (Student t test). (D) Expression of mRNA encoding FOXP3 in inoculated B16-OVA melanoma tissue in NICD1 mice and controls, as evaluated by quantitative PCR. Expression levels are expressed relative to those detected in tumors from control mice. Data in the bar graphs are expressed as the mean and SEM from 4 individual mice per group. **P < .01 (Student t test).
To examine the capacity to develop tumor-specific T cells, we injected NICD1 mice and controls subcutaneously with 5 × 10⁵ B16-OVA melanoma cells32 and examined the percentage of OVA-specific T cells within the tumor-infiltrating CD8+ T-cell population on day 21. The results showed that the amount of OVA-specific T cells in NICD1 mice fell by 67% (Figure 3C) compared with that in controls. In addition, FOXP3 expression in B16 tumors borne by NICD1 mice was significantly higher than that in controls (Figure 3D). These findings suggest that a Treg cell–rich immune-privileged state is likely to occur in NICD1 mice, which may increase the risk of spontaneous sarcoma development.
Activation of Notch signaling in mature B cells promotes production and extracellular release of IL-33
To clarify the mechanism underlying altered T-cell responses in NICD1 mice, we next performed gene-expression microarray analysis to compare gene expression between splenic RFP+ B cells from NICD1 mice and controls. Among 108 genes upregulated significantly (threefold or higher and P value log ratio < .01) in B cells from NICD1 mice, we identified IL33 as a candidate gene responsible for altered T-cell responses because it was associated with gene ontology (GO) terms “extracellular region” (GO:0005576) and “regulation of immune response” (GO:0050776) (supplemental Table 1).39,40
Intracellular flow cytometric analysis confirmed increased expression of IL-33 protein by splenic RFP+ B cells from NICD1 mice (Figure 4A). Immunofluorescence staining of splenocytes isolated from NICD1 mice revealed that a mean 25.5% of RFP+ cells were positive for IL-33 in both the nuclei and cytoplasm; the remaining cells were positive only in the nuclei (Figure 4B). These findings suggest that IL-33 is actively produced and released by Notch1-activated mature B cells. We found that splenic CD19+RFP+ B cells within the highest quartile of intracellular IL-33 expression were larger in size and more enriched with CD80highCD86high activated memory B cells, but not with CD95+ GC B cells, compared with the remaining CD19+RFP+ B cells (Figure 4C-D).
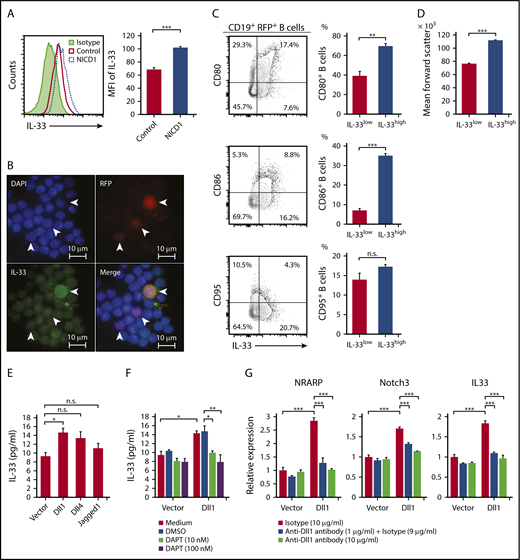
Production of IL-33 by B cells upon activation of Notch signaling. (A) IL-33 expression by splenic CD19+RFP+ B cells from NICD1 mice and controls, as examined by intracellular flow cytometric analysis. (B) Representative images of splenocytes of NICD1 mice immunofluorescently stained for IL-33 and RFP. Cells were stained for intracellular IL-33 and then cytospin slides prepared. Slides were then counterstained with DAPI. White arrowheads indicate RFP+ cells. (C) CD80, CD86, and CD95 expression profiles of splenic CD19+RFP+ B cells from NICD1 mice were compared between cells within the highest quartile and those within lower 3 quartiles of intracellular IL-33 expression. (D) Comparison of mean forward scatter of splenic CD19+RFP+ B cells from NICD1 mice between cells within the highest quartile and those within lower 3 quartiles of intracellular IL-33 expression. In panels C-D, the mean percentage of cells from 3 individual mice per group is shown. In panels A-D, data in the bar graphs are expressed as the mean and SEM from 3 individual mice. **P < .01 and ***P < .001 (Student t test). (E) IL-33 production by splenic CD19+ B cells from WT B6 mice stimulated with LPS in vitro and cultured in the presence of L cells expressing Dll1, Dll4, and Jagged1 was compared with that cultured in the presence of mock-transduced L cells. (F) Inhibition of Dll1-mediated IL-33 production by WT B cells upon addition of a Notch-signaling inhibitor, DAPT. Splenic CD19+ B cells from WT B6 mice were stimulated with LPS in vitro and cultured in the presence of L cells with or without Dll1 expression. (G) Dll1-mediated induction of NRARP, Notch3, and IL33 gene expression in WT B cells, as evaluated by quantitative PCR. Splenic CD19+ B cells from WT B6 mice were stimulated with LPS in vitro and cultured in the presence of L cells with or without Dll1 expression. Dll1-Notch signaling was inhibited by the addition of an anti–Dll1-blocking antibody. Expression levels are demonstrated relative to those detected in B cells cocultured with mock-transduced L cells and without a Dll1-blocking antibody. In panels E-G, data in the bar graphs are expressed as the mean and SEM from 3 independent experiments. (E) *P < .05 (Dunnett test). (F-G) *P < .05, **P < .01, and ***P < .01 (Tukey-Kramer test). DMSO, dimethyl sulfoxide; MFI, mean fluorescence intensity.
Production of IL-33 by B cells upon activation of Notch signaling. (A) IL-33 expression by splenic CD19+RFP+ B cells from NICD1 mice and controls, as examined by intracellular flow cytometric analysis. (B) Representative images of splenocytes of NICD1 mice immunofluorescently stained for IL-33 and RFP. Cells were stained for intracellular IL-33 and then cytospin slides prepared. Slides were then counterstained with DAPI. White arrowheads indicate RFP+ cells. (C) CD80, CD86, and CD95 expression profiles of splenic CD19+RFP+ B cells from NICD1 mice were compared between cells within the highest quartile and those within lower 3 quartiles of intracellular IL-33 expression. (D) Comparison of mean forward scatter of splenic CD19+RFP+ B cells from NICD1 mice between cells within the highest quartile and those within lower 3 quartiles of intracellular IL-33 expression. In panels C-D, the mean percentage of cells from 3 individual mice per group is shown. In panels A-D, data in the bar graphs are expressed as the mean and SEM from 3 individual mice. **P < .01 and ***P < .001 (Student t test). (E) IL-33 production by splenic CD19+ B cells from WT B6 mice stimulated with LPS in vitro and cultured in the presence of L cells expressing Dll1, Dll4, and Jagged1 was compared with that cultured in the presence of mock-transduced L cells. (F) Inhibition of Dll1-mediated IL-33 production by WT B cells upon addition of a Notch-signaling inhibitor, DAPT. Splenic CD19+ B cells from WT B6 mice were stimulated with LPS in vitro and cultured in the presence of L cells with or without Dll1 expression. (G) Dll1-mediated induction of NRARP, Notch3, and IL33 gene expression in WT B cells, as evaluated by quantitative PCR. Splenic CD19+ B cells from WT B6 mice were stimulated with LPS in vitro and cultured in the presence of L cells with or without Dll1 expression. Dll1-Notch signaling was inhibited by the addition of an anti–Dll1-blocking antibody. Expression levels are demonstrated relative to those detected in B cells cocultured with mock-transduced L cells and without a Dll1-blocking antibody. In panels E-G, data in the bar graphs are expressed as the mean and SEM from 3 independent experiments. (E) *P < .05 (Dunnett test). (F-G) *P < .05, **P < .01, and ***P < .01 (Tukey-Kramer test). DMSO, dimethyl sulfoxide; MFI, mean fluorescence intensity.
To investigate whether IL-33 is released from B cells upon activation of Notch signaling, we stimulated splenic CD19+ B cells from WT B6 mice with LPS and Notch ligands (Dll1, Dll4, and Jagged1) expressed on murine fibroblast L cells.31 The level of IL-33 released from B cells was highest when the cells were cultured in the presence of 1 of the Notch ligands, Dll1 (Figure 4E). Importantly, the Dll1-mediated increase in IL-33 secretion was successfully blocked by inhibiting Notch signaling using a γ-secretase inhibitor, DAPT (Figure 4F). We also found that expression levels of Notch target genes NRARP and Notch3 were significantly increased by Dll1 ligation as well as IL33 expression, and they were inhibited by the addition of a Dll1-blocking antibody (Figure 4G). These results indicate that IL-33 secretion by B cells increases upon ligation of the Notch receptor.
Notch1-activated mature B cells increase production of Treg and Th2 cell–associated cytokines via IL-33
To examine whether IL-33 secreted by NICD1-expressing mature B cells modulates T-cell immune responses, we stimulated splenic CD4+ T cells isolated from WT B6 mice with RFP+ B cells isolated from NICD1 mice and controls and then measured cytokine production. After 4.5 days of coculture, T cells from both groups proliferated and produced cytokines in response to haplotype-mismatched B cells. Notably, the levels of Treg and Th2 cell–associated cytokines, IL-10, IL-4, IL-5, and IL-13 produced by T cells cocultured with NICD1 mouse B cells were 1.8-, 1.3-, 2.3-, and 2.7-fold, respectively, higher than those produced by T cells cocultured with control B cells (Figure 5A). Expression of the IL-33 receptor ST2 was detected on a part of Treg and Th2 cells as previously described (supplemental Figure 3).41-44 The increased cytokine production was abrogated by blocking ST2 (Figure 5A). By contrast, IFN-γ production by CD4+ and CD8+ T cells cultured with NICD1 mouse B cells and control B cells was similar and not affected by the addition of an ST2-blocking antibody (Figure 5A-B). Together, these results indicate that IL-33 produced by Notch1-activated mature B cells increases Treg and Th2 cell–associated cytokine production by stimulated T cells.
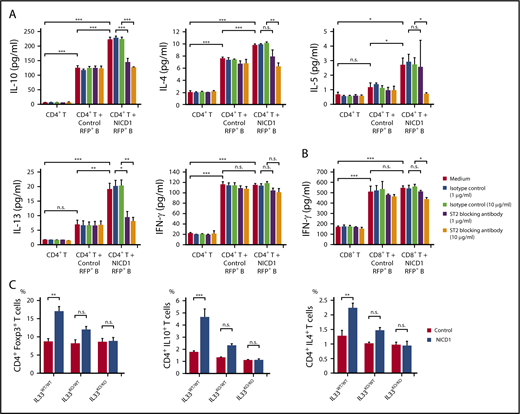
Treg and Th2 cell–associated cytokine production by stimulated T cells is increased by Notch1-activated mature B cells. (A) Cytokine production by WT CD3+CD4+ T cells cultured in vitro with or without CD19+RFP+ B cells from NICD1 mice and controls and stimulated with LPS and anti-CD3/anti-CD28 activators. An anti–IL-33 receptor ST2-blocking antibody was added as indicated. Cytokine concentration in the culture medium was measured in a bead-based immunoassay after 4.5 days of culture. (B) IFN-γ production by WT CD3+CD8+ T cells cultured in vitro with or without CD19+RFP+ B cells from NICD1 mice and controls and stimulated with LPS and anti-CD3/anti-CD28 activators. In panels A-B, data in the bar graphs are expressed as the mean and SEM from 3 independent experiments. *P < .05, **P < .01, and ***P < .001 (Tukey-Kramer test). (C) Percentages of Treg and Th2–cell subsets and IL-10–producing T cells within the splenic CD3+ CD4+ T-cell population from NICD1 mice and controls on the IL33WT/WT, IL33KO/WT, or IL33KO/KO background, as determined by intracellular flow cytometric analysis. Data in the bar graphs are expressed as the mean and SEM from 3 to 4 individual mice. **P < .01 and ***P < .001 (Tukey-Kramer test).
Treg and Th2 cell–associated cytokine production by stimulated T cells is increased by Notch1-activated mature B cells. (A) Cytokine production by WT CD3+CD4+ T cells cultured in vitro with or without CD19+RFP+ B cells from NICD1 mice and controls and stimulated with LPS and anti-CD3/anti-CD28 activators. An anti–IL-33 receptor ST2-blocking antibody was added as indicated. Cytokine concentration in the culture medium was measured in a bead-based immunoassay after 4.5 days of culture. (B) IFN-γ production by WT CD3+CD8+ T cells cultured in vitro with or without CD19+RFP+ B cells from NICD1 mice and controls and stimulated with LPS and anti-CD3/anti-CD28 activators. In panels A-B, data in the bar graphs are expressed as the mean and SEM from 3 independent experiments. *P < .05, **P < .01, and ***P < .001 (Tukey-Kramer test). (C) Percentages of Treg and Th2–cell subsets and IL-10–producing T cells within the splenic CD3+ CD4+ T-cell population from NICD1 mice and controls on the IL33WT/WT, IL33KO/WT, or IL33KO/KO background, as determined by intracellular flow cytometric analysis. Data in the bar graphs are expressed as the mean and SEM from 3 to 4 individual mice. **P < .01 and ***P < .001 (Tukey-Kramer test).
Lack of IL-33 abrogates Treg and Th2 cell-dominant T-cell responses in NICD1 mice
Next, we generated NICD1 mice and controls on IL33KO/WT and IL33KO/KO backgrounds by crossing mice with IL33KO/KO mice.30 Although IL-33 deficiency in itself did not affect the percentages of Treg and Th2 cells, the increased percentages of Treg and Th2 cells observed in NICD1 mice became less marked on the IL33KO/WT background, and, strikingly, the difference was abolished on the IL33KO/KO background (Figure 5C). The increase in IL-10–producing CD4+ T cells in NICD1 mice also fell on the IL33KO/WT background and was lost completely on the IL33KO/KO background (Figure 5C). Notably, development of soft tissue sarcomas observed in NICD1 mice was not observed in NICD1 mice on the IL33KO/WT or the IL33KO/KO background during the same follow-up period (supplemental Figure 4). These results indicate that IL-33 is responsible for the Notch1-activated mature B-cell–mediated immunomodulatory effect on T cells in vivo.
Activation of Notch signaling correlates positively with IL33 expression and Treg cell–rich gene-expression signatures in human DLBCL
Finally, we examined IL-33 expression in 40 human DLBCL biopsy specimens by immunohistochemistry and confirmed that tumor cells in 10 of 40 samples (25%) were positive for IL-33 in both the nuclei and cytoplasm, suggesting that IL-33 is actively produced by these tumor cells; the remaining tumor cells expressed IL-33 only in the nuclei (Figure 6A). Clinical characteristics and prognosis were not significantly different between patients with and without cytoplasmic IL-33 expression (supplemental Figure 5A; supplemental Table 2).

Gene-expression signature analysis of Notch-activated DLBCL. (A) Representative immunohistochemical images showing IL-33 staining of DLBCL samples with negative (left) and positive (right) expression of cytoplasmic IL-33. Samples were evaluated as positive for cytoplasmic IL-33 expression if the cytoplasm of 30% or more of tumor cells was stained for IL-33. Clinical characteristics and prognosis were compared between cytoplasmic IL-33–positive and –negative groups. (B) RNA-Seq gene-expression data derived from 624 DLBCL samples obtained from EGA. Notch-signaling activity was calculated as the geometric mean of the expression of 66 direct Notch target genes. Notch-signaling activity vs IL33 expression. (C) GSEA enrichment plot for DLBCL with high Notch-signaling activity (n = 312) vs that with low Notch-signaling activity (n = 312), and high IL33 expression (n = 312) vs low IL33 expression (n = 312), for genes upregulated in adult Treg cells in comparison with adult conventional T cells (GSE25087_TREG_VS_TCONV_ADULT_UP). (D) Intratumor immune cell activity was calculated as the geometric mean of the expression of immune metagenes. Notch-signaling activity and IL33 expression vs intratumor CD8+ T-cell activity (top), Treg cell activity (middle), and the log ratio of intratumor CD8+ T-cell activity to Treg cell activity (bottom). FDR, false discovery rate; FPKM, fragments per kilobase of exon per million fragments mapped; NES, normalized enrichment score; rho, Spearman rank correlation coefficient.
Gene-expression signature analysis of Notch-activated DLBCL. (A) Representative immunohistochemical images showing IL-33 staining of DLBCL samples with negative (left) and positive (right) expression of cytoplasmic IL-33. Samples were evaluated as positive for cytoplasmic IL-33 expression if the cytoplasm of 30% or more of tumor cells was stained for IL-33. Clinical characteristics and prognosis were compared between cytoplasmic IL-33–positive and –negative groups. (B) RNA-Seq gene-expression data derived from 624 DLBCL samples obtained from EGA. Notch-signaling activity was calculated as the geometric mean of the expression of 66 direct Notch target genes. Notch-signaling activity vs IL33 expression. (C) GSEA enrichment plot for DLBCL with high Notch-signaling activity (n = 312) vs that with low Notch-signaling activity (n = 312), and high IL33 expression (n = 312) vs low IL33 expression (n = 312), for genes upregulated in adult Treg cells in comparison with adult conventional T cells (GSE25087_TREG_VS_TCONV_ADULT_UP). (D) Intratumor immune cell activity was calculated as the geometric mean of the expression of immune metagenes. Notch-signaling activity and IL33 expression vs intratumor CD8+ T-cell activity (top), Treg cell activity (middle), and the log ratio of intratumor CD8+ T-cell activity to Treg cell activity (bottom). FDR, false discovery rate; FPKM, fragments per kilobase of exon per million fragments mapped; NES, normalized enrichment score; rho, Spearman rank correlation coefficient.
We next analyzed RNA-Seq gene-expression data derived from 624 DLBCL samples in EGA (data set ID: EGAD00001003600).33 Notch-signaling activity was calculated as the geometric mean of the expression of 66 direct Notch target genes (supplemental Table 3).35 We found that Notch-signaling activity paralleled IL33 expression strongly (Figure 6B). There was no difference in the International Prognostic Index, cell of origin, and overall survival between groups with high and low Notch-signaling activity (supplemental Table 4), whereas tumors with high IL33 expression were slightly associated with better survival (supplemental Figure 5B; supplemental Table 5), which may be explained by better survival in DLBCL with Treg cell–rich signature.33 Gene set enrichment analysis (GSEA) showed that enrichment of gene sets related to Treg cells was highly associated with DLBCL showing high Notch-signaling activity and with DLBCL showing high IL33 expression (Figure 6C).45 We further assessed tumor-infiltrating immune cell populations based on log-average expression levels of gene sets representing each immune cell type (immune metagenes).46 Both Notch-signaling activity and IL33 expression correlated positively with expression of metagenes related to infiltrating Treg cells, whereas they showed a weaker correlation with metagene expression representing infiltrating CD8+ T cells (Figure 6D). Consequently, the intratumor CD8+ T/Treg cell ratio calculated from expression levels of immune metagenes decreased along with activation of Notch signaling and IL33 expression in DLBCL (Figure 6D). As Notch target genes may vary among tissues or cell types,35,47,48 we reevaluated the significance of Notch-signaling activity based on 46 genes of Notch-dependent signature identified in chronic lymphocytic leukemia cells (supplemental Table 6).47 Recalculated Notch-signaling activity also strongly paralleled IL33 expression, and was highly associated with the enrichment of gene sets associated with Treg cells (supplemental Figure 5C-D). Collectively, these data indicate that both activation of Notch signaling and IL33 expression are associated with a Treg cell–rich tumor microenvironment in DLBCL.
Discussion
Here, we show that mature B cells with aberrantly activated Notch1 signaling increase Treg and Th2 cell subsets in vivo and increase production of Treg and Th2 cell–associated cytokines by T cells. These immunomodulatory effects of B cells are mediated principally by IL-33. Moreover, expression profiling analysis of human DLBCL samples indicated that Notch-signaling activity correlates positively with IL33 expression and a Treg cell–rich tumor microenvironment. Collectively, the data demonstrate a novel immunomodulatory function of Notch1-activated mature B cells that drives T-cell immunity toward Treg and Th2 cell–dominant responses via the IL-33–ST2 pathway.
Notch ligands Dll1 and Jagged1 are often expressed by B-cell lymphoma cells,49-52 as well as by bystander cells such as follicular dendritic cells.13 Because Notch signaling is activated by binding to its ligand on adjacent cells,53 it seems conceivable that Notch signaling in B-cell lymphoma cells can be activated by these ligands through cell-cell interactions. Moreover, Notch-truncating mutations resulting in lack of degradation signals14-17,19 and loss-of-function mutations of genes coding for negative regulators of the Notch pathway, such as DTX1 and SPEN,24,25 can cause aberrant activation of Notch signaling in B-cell lymphoma.22,23 Chromosomal gain of 9q33-q34 is a frequent genomic imbalance in DLBCL with the GC B-cell signature and FL54,55 ; this can increase the copy number of the Notch1 gene located at 9q34, which may be another mechanism responsible for aberrant activation of Notch1 signaling. IL-33 is a member of the IL-1 family of cytokines and is released from endothelial and epithelial cells upon necrosis or mechanical stress.30,44,56,57 In accordance with the present study, Notch-signaling–mediated induction of IL-33 expression was reported in endothelial cells, and this process is considered to be regulated directly by the active Notch-RBP-Jκ complex because several evolutionary conserved RBP-Jκ binding regions have been identified in the IL33 gene.58
Because the amount of IL-33 secreted by ex vivo–activated B cells was subtle, and its concentration in blood plasma was not significantly altered in our mouse model (data not shown), we hypothesize that pertinent targets of IL-33 released from B cells with constitutive Notch-signaling activation are adjacent T cells.59,60 The IL-33 receptor ST2 is preferentially expressed by Treg and Th2 cells,41-44 and signaling through ST2 increases production of Treg and Th2 cell–associated cytokines.42,44 Moreover, IL-33 increases differentiation of Treg cells and provides a signal for Treg cell accumulation and maintenance in inflamed tissues.42 These reports accord well with our findings that Notch1-activated mature B cells increase cytokine production by Treg and Th2 cells via IL-33. IL-33 can occasionally amplify Th1 and CD8+ T-cell responses, but this process requires a 2-signal sequence: first IL-12, and then IL-33, is required for induction of IFN-γ synthesis.61-63 In our mouse model, Th1 and CD8+ T cells were suppressed, probably by immunosuppressive cytokines such as IL-10 produced by the greater numbers of Treg and Th2 cells.64,65
Accumulating evidence suggests that B cells play a critical role in modulating antitumor immune responses against both B-cell neoplasms and solid cancers.66-69 The immunoinhibitory functions of B cells and B-cell lymphoma cells have been explained by molecules such as IL-10, TGF-β, IL-35, and PD-L1.70-72 Based on the decreased capacity of NICD1 mice to develop tumor-specific CD8+ T-cell immunity, as well as the increased percentage of spontaneous soft tissue sarcomas, it is suggested that Notch-signaling activation may be 1 of the mechanisms by which B cells exert immunosuppressive functions. Expression-profiling analysis of human DLBCL suggests that activation of Notch signaling fosters a Treg cell–rich immune-privileged status via IL-33. Because recent reports of preclinical models of human solid tumors imply that IL-33 blockade may be an effective way of reducing accumulation of Treg cells in the tumor microenvironment and limit tumor growth,73,74 the IL-33-ST2 pathway would be a promising therapeutic target for treatment of DLBCL.
In summary, we demonstrate that B cells with dysregulated Notch1 signaling have a novel immunomodulatory effect on T cells by promoting Treg and Th2 cell–dominant responses via the IL-33–ST2 pathway. In addition, we show that this immunomodulatory mechanism is associated with an immune-privileged state in DLBCL. We propose that pharmacological strategies to interfere with this mechanism would be a potential treatment of B-cell lymphoma showing aberrant activation of Notch signaling.
The full-text version of this article contains a data supplement.
Acknowledgments
The authors thank T. Kitawaki and K. Shirakawa (Kyoto University) for critical comments and helpful suggestions. The B16-OVA and L-cell lines were kindly provided by N. Minato and T. Kitawaki, respectively. The authors also thank T. Honjo (Kyoto University) and M. Busslinger (Research Institute of Molecular Pathology, Vienna, Austria) for providing Aicda-Cre mice, H. J. Fehling (Ulm University, Ulm, Germany) for providing Rosa26-reporter RFP mice, and Y. Saga (National Institute of Genetics, Mishima, Japan) for providing conditional CAG-CAT-NICD1 transgenic mice. The authors also thank A. Reddy and S. S. Dave (Duke University, Durham, NC) for providing A sequencing data of DLBCL.
This work was supported by the Japan Society for the Promotion of Science (JSPS) under Grants-in-Aid for JSPS Research Fellow (no. 14J05725) and Scientific Research (no. 15K09474).
Authorship
Contribution: H.A. conducted all of the experiments and collected data; H.A., M.N., and A.T-K. designed the experiments and wrote the manuscript; Y.O., W.K., and K.I. assisted with animal experiments and fluorescence-activated cell sorting analysis; and K.Y. and T.Y. provided the IL33KO/KO mice and advice regarding the manuscript.
Conflict-of-interest disclosure: The authors declare no competing financial interests.
Correspondence: Momoko Nishikori, Department of Hematology and Oncology, Graduate School of Medicine, Kyoto University, 54 Shogoin Kawahara-cho, Sakyo-ku, Kyoto 606-8507, Japan; e-mail: nishikor@kuhp.kyoto-u.ac.jp.

