Key Points
Cord blood T cells are ontogenetically distinct from the peripheral blood T cells.
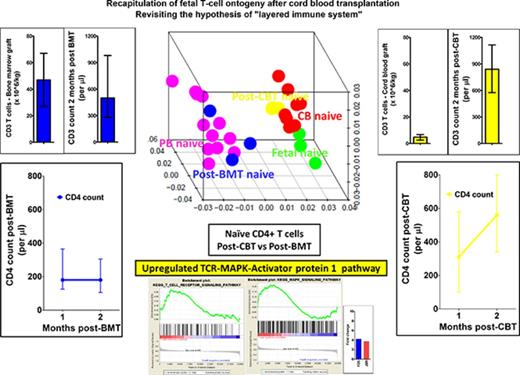
Recapitulation of fetal ontogeny after cord blood transplantation results in rapid CD4+ T-cell reconstitution.
Abstract
Omission of in vivo T-cell depletion promotes rapid, thymic-independent CD4+-biased T-cell recovery after cord blood transplant. This enhanced T-cell reconstitution differs from that seen after stem cell transplant from other stem cell sources, but the mechanism is not known. Here, we demonstrate that the transcription profile of naive CD4+ T cells from cord blood and that of lymphocytes reconstituting after cord blood transplantation is similar to the transcription profile of fetal CD4+ T cells. This profile is distinct to that of naive CD4+ T cells from peripheral blood and that of lymphocytes reconstituting after T-replete bone marrow transplantation. The transcription profile of reconstituting naive CD4+ T cells from cord blood transplant recipients was upregulated in the T-cell receptor (TCR) signaling pathway and its transcription factor activator protein-1 (AP-1). Furthermore, a small molecule inhibitor of AP-1 proportionally inhibited cord blood CD4+ T-cell proliferation (P < .05). Together, these findings suggest that reconstituting cord blood CD4+ T cells reflect the properties of fetal ontogenesis, and enhanced TCR signaling is responsible for the rapid restoration of the unique CD4+ T-cell biased adaptive immunity after cord blood transplantation.
Introduction
T-cell reconstitution in the early posttransplant period occurs through expansion of T cells carried with the graft and is driven by antigens and/or the posttransplant lymphopenic environment.1 This expansion of T cells in the lymphopenic environment is termed homeostatic proliferation.2 T-cell replete cord blood transplantation (CBT) results in a rapid thymus-independent T-cell reconstitution, which is strikingly CD4+ biased compared with the well-established observation of CD8+ T-cell biased expansion after T-cell replete bone marrow transplant (BMT).3,4 In addition, a normal T-cell spectratype is observed as early as 30 days after a T-cell replete CBT.3 Conversely, in vivo T-cell depletion with antithymocyte globulin in CBT curbs this thymus-independent T-cell expansion, resulting in prolonged T-cell lymphopenia with late memory T-cell skewing.5,6
The distinct lymphocyte kinetics and a diverse T-cell repertoire after T-replete CBT is associated with antiviral reconstitution and potent antileukemic effect in the clinic.3,5,7-9 Further, we have demonstrated a robust antileukemic effect mediated by cord blood (CB) T cells compared with peripheral blood (PB) T cells in an in vivo animal model.10 CB T cells also appear much more sensitive than PB T cells to even small amounts of antithymocyte globulin.11 These observations suggest differential behavior of CB and PB T cells after HCT.
Fetal and adult lymphocytes in birds, mammals, and humans have been described to have distinct ontogenetic origins.12,13 The fetal origin of CB T cells may endow them with an enhanced ability to fill the immunological void after HCT through processes involved in lymphopenia-induced proliferation such as T-cell receptor (TCR) or cytokine signaling.14-16 Hence, we questioned whether early thymus-independent T-cell reconstitution after T-replete CBT recapitulates fetal T-cell ontogeny and, if so, whether upregulation of distinct cell signaling and biological processes could explain the enhanced T-cell proliferation after CBT.
Methods
Immune reconstitution
The immune reconstitution study was approved by the Great Ormond Street Hospital’s Institutional Review Board (protocol number 05/Q0508/61), and written informed consent was obtained from patients’ parents according to the Declaration of Helsinki. Serial monitoring of immune reconstitution was undertaken at 1, 2, and 6 months in 70 consecutive patients with T-cell replete transplant (30 CBT, 40 BMT). T-cell recovery was characterized by flow cytometry using fluorescein isothiocyanate or phycoerythrin-labeled Ab against CD3, CD4, and CD8. Transplant characteristics are shown in Table 1.
Demographics of cord blood and bone marrow recipients that contributed to the T-cell reconstitution study
| CBT (n = 30; 26 single-cord and 4 double-cord) . | BMT (n = 40) . |
|---|---|
| Age at transplant | |
| 1 y (0.1-12) | 4.3 y (0.6-12) |
| Diagnosis | |
| Acute leukemia, 12 (40%); myelodysplastic syndrome/chronic myeloid leukemia, 2 (6%); immunodeficiency, 12 (40%); hemophagocytic lymphohistiocytosis 4 (14%) | Acute leukemia, 17 (42%); myelodysplastic syndrome/chronic myeloid leukemia, 3 (8%); immunodeficiency, 13 (32%); hemophagocytic lymphohistiocytosis, 5 (13%); metabolic, 2 (5%) |
| Conditioning | |
| Myeloablative conditioning, 29 (97%; TBI or Bu-based or treosulfan-based); no conditioning, 1 (3%) | Myeloablative conditioning, 40 (100%; TBI or Bu-based or treosulfan-based) |
| HLA matching | |
| ≤8/10: 17 | 10/10: 40 |
| 9/10: 14 | |
| 10/10: 03 | |
| Acute GVHD | |
| Grade II: 10 (33%) | Grade II: 7 (18%) |
| Grade III-IV: 5 (16%) | Grade III-IV: 3 (8%) |
| Viral reactivations | |
| CMV: 4 (13%) | CMV: 7 (17%) |
| ADV: 4 (13%) | ADV: 4 (10%) |
Cord blood and peripheral blood samples
All CB samples were obtained with prior consent and ethical committee approval from the Anthony Nolan cord blood bank (Research Ethics Committee reference 10/H0405/27). Fully informed written consent was obtained from pregnant mothers. PB samples were obtained from healthy volunteers and transplant recipients after written informed consent. The study had full ethical approval from the Anthony Nolan and Royal Free Hospital Research Ethics Committee. PB samples of healthy children with frozen CB samples were obtained with prior consent and ethical committee approval from the National Research Ethics Committee (Research Ethics Committee reference 11/LO/1505).
Fluorescence-activated cell sorting
Mononuclear cell preparations were incubated in flow cytometry staining buffer (phosphate buffered saline with 2% fetal bovine serum and 2 mM EDTA) with surface antibodies conjugated to fluorochromes. CD4-fluorescein isothiocyanate (BD Biosciences), CCR7-PE (eBioscience), and CD45RA-antigen-presenting cells (APCs; BD Biosciences) were used for surface staining of naive CD4+ T cells, and fluorescence-activated cell sorting was performed on a BD FACS Aria III cell sorter. The preparation of RNA for microarray analysis are detailed in supplemental Data.
Experimental design
Biological replicates of samples from normal donor CB (n = 3) and normal donor PB (n = 3) were compared in 3 separate experiments. The third experiment compared CB and PB samples from the same donors, thus allowing a paired analysis. In the same experiment, we also performed biological replicates of reconstituting naive CD4+ T cells at 2 months after CBT (n = 3) and BMT (n = 3). The details of transplant recipients are presented in supplemental Table 1.
An Affymetrix Human Genome U133 Plus 2.0 Array dataset of naive CD4+ T cells isolated from fetal lymph nodes (18-22 weeks gestational age) was retrieved (GSE25119).13 The relationship between the fetal CD4+ T-cell transcriptome and that of the naive CD4+ T cells from normal donor CB and normal donor PB, and during early T-cell reconstitution after T-replete CBT and BMT, were compared.
An Affymetrix Human Genome U133 Plus 2.0 Array dataset of T-regulatory cells isolated from fetal lymph nodes (18-22 weeks gestational age) and adult PB were also retrieved (GSE25119).13 Thus, the relationship between CD4+ T-regulatory cell transcriptome and naive CD4+ T cells from normal donor CB and during early reconstitution after CBT was also elucidated.
Microarray data analysis: quality control and statistical analysis
Quality control analysis deemed the gene expression profiles (GEPs) to be of good quality. The quality control and statistical analysis are detailed in supplemental Methods.
Pathway analysis
Gene set enrichment analysis on the data sets was performed to identify differentially regulated pathways.17 The details of pathway analysis are presented in the supplemental Methods.
Proliferation assays
The role of upregulated pathways and the relevant transcription factors in proliferation of naive CD4+ T cells was assessed with carboxy-fluorescein diacetate succinimidyl ester dye dilution experiments.18 These experiments are detailed in the supplemental Data.
Results
Rapid T-cell reconstitution occurs after T-replete CBT compared with T-replete BMT despite 1 log lower T cells in the cord blood graft
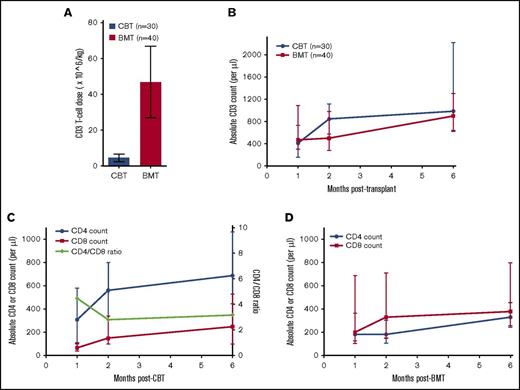
We have previously reported on immune reconstitution after T-replete CB grafts.3 We can now extend our initial report to compare a cohort of 40 consecutive T-replete bone marrow (BM) grafts (Table 1). CBT recipients (n = 30) received a median T-cell dose of 4.75 × 10⁶/kg (interquartile range, 2.5-6.7). In comparison, T cells carried with sibling BM grafts (n = 40) were 10-fold higher (median, 45 × 106/kg; interquartile range, 27-67; P < .0001; Figure 1A). Despite the lower number of T cells carried with the CB grafts, we observed unprecedented thymus-independent expansion of the T-cell pool. The median T-cell count 2 months after CBT was 840 × 106/L (interquartile range, 575-1115) compared with a significantly lower median of 500 × 106/L (interquartile range, 280-980) after BMT (Figure 1B).
Immune reconstitution after T-replete CBT and BMT. (A) Bar graph showing T-cells carried with a cord blood and a bone marrow graft. A median of 4 × 10⁶/kg T cells are infused with a cord blood graft compared with 10 times more T cells (45 × 106/kg) infused with a bone marrow graft (P < .0001). The bar graph represents the median, and error bars represent the 25th and 75th centiles. (B) Line graph showing T-cell reconstitution after T-replete CBT and BMT. Despite a 10 times lower number of T cells infused with the cord blood graft, a significantly higher CD3+ T-cell recovery is observed 2 months post-CBT compared with after BMT. (C-D) Line graph showing CD4+ and CD8+ T-cell recovery after CBT and BMT, respectively. The T-cell recovery observed after T-replete CBT was asymmetrically CD4+ T-cell biased in contrast to CD8+ T-cell biased immune reconstitution after T-replete BMT. The dots represent the median, and the error bars represent the 25th and 75th centile. The green line represents CD4:CD8 ratio plotted on the right Y-axis.
Immune reconstitution after T-replete CBT and BMT. (A) Bar graph showing T-cells carried with a cord blood and a bone marrow graft. A median of 4 × 10⁶/kg T cells are infused with a cord blood graft compared with 10 times more T cells (45 × 106/kg) infused with a bone marrow graft (P < .0001). The bar graph represents the median, and error bars represent the 25th and 75th centiles. (B) Line graph showing T-cell reconstitution after T-replete CBT and BMT. Despite a 10 times lower number of T cells infused with the cord blood graft, a significantly higher CD3+ T-cell recovery is observed 2 months post-CBT compared with after BMT. (C-D) Line graph showing CD4+ and CD8+ T-cell recovery after CBT and BMT, respectively. The T-cell recovery observed after T-replete CBT was asymmetrically CD4+ T-cell biased in contrast to CD8+ T-cell biased immune reconstitution after T-replete BMT. The dots represent the median, and the error bars represent the 25th and 75th centile. The green line represents CD4:CD8 ratio plotted on the right Y-axis.
We further studied the differences in CD4+ or CD8+ T-cell compartment after CBT and BMT. As previously described, early T-cell recovery after BMT was CD8+ T-cell biased, whereas CD4+ T-cell biased immune reconstitution was observed after CBT. At 1 month posttransplant, T-cell reconstitution after CBT was strikingly CD4+ T-cell biased with a CD4:CD8 ratio of 4.5:1. T-cell reconstitution after CBT remained numerically superior at 1, 2, and 6 months compared with BMT, again with a CD4+ T-cell bias (Figure 1C-D). Thus, T cells carried with the CB graft are endowed with the enhanced ability to restore adaptive immunity.
T-cell replete CBT recapitulates fetal T-cell ontogeny
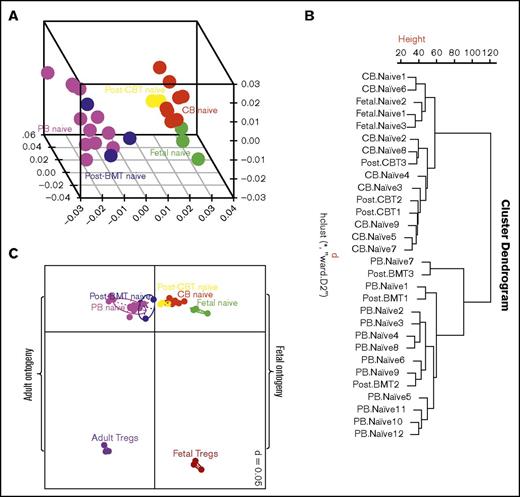
To gain more insight into the enhanced ability of CB T cells to proliferate in the lymphopenic environment, we compared the GEP of flow cytometrically sorted naive CD4+ T cells from normal CB and PB donors. The naive CD4+ T cells from CB and PB clustered into 2 distinct groups on hierarchical clustering and 3 dimensional principal component analysis. These GEPs were then compared with those of reconstituting naive CD4+ T cells 2 months after CBT and BMT. The GEPs of naive CD4+ T cells after CBT and BMT clustered with the GEPs of naive CD4+ T cells from CB and PB, respectively (Figure 2A-B). We then studied how the above GEPs related to naive CD4+ T cells derived from fetal mesenteric lymph nodes. Interestingly, the GEPs of naive CD4+ T cells from CB and during early reconstitution after CBT clustered with those of naive fetal CD4+ T cells (Figure 2A-B). These observations suggest CB and PB T cells are ontogenetically distinct, and CD4+ T cells in the CB and those reconstituting early post-CBT share a fetal type gene expression program.
Exploratory analysis of gene expression profiles. (A) Three-dimensional principal component analysis and (B) unsupervised hierarchical clustering of gene expression profile of naive CD4+ T cells from cord blood, peripheral blood, fetal mesenteric lymph nodes and 2 months after CBT and BMT. Naive cord blood CD4+ T cells have a distinct transcription profile to naive peripheral blood CD4+ T cells, but similar to fetal T cells. Cord blood T cells during early reconstitution after CBT retain the fetal-like transcription profile, and thus recapitulate fetal ontogeny. (C) Two-dimensional principal component analysis showing a relationship among naive CD4+ T cells from cord blood, peripheral blood, and fetal mesenteric lymph nodes, and 2 months after CBT and BMT, vs T-regulatory cells from fetal mesenteric lymph nodes and peripheral blood. T cells segregate based on developmental stage and T-cell type. Thus, confirming the distinct transcription profile of naive CD4+ T cells after CBT is not a result of adoption of T-regulatory function.
Exploratory analysis of gene expression profiles. (A) Three-dimensional principal component analysis and (B) unsupervised hierarchical clustering of gene expression profile of naive CD4+ T cells from cord blood, peripheral blood, fetal mesenteric lymph nodes and 2 months after CBT and BMT. Naive cord blood CD4+ T cells have a distinct transcription profile to naive peripheral blood CD4+ T cells, but similar to fetal T cells. Cord blood T cells during early reconstitution after CBT retain the fetal-like transcription profile, and thus recapitulate fetal ontogeny. (C) Two-dimensional principal component analysis showing a relationship among naive CD4+ T cells from cord blood, peripheral blood, and fetal mesenteric lymph nodes, and 2 months after CBT and BMT, vs T-regulatory cells from fetal mesenteric lymph nodes and peripheral blood. T cells segregate based on developmental stage and T-cell type. Thus, confirming the distinct transcription profile of naive CD4+ T cells after CBT is not a result of adoption of T-regulatory function.
Fetal ontogeny is biased toward T-regulatory function.19,20 We therefore compared the relationship between naive CD4+ T cells and T-regulatory cells from fetus and adults. In a 2-dimensional principal component analysis, naive CD4+ T cells and T-regulatory cells segregated depending on the developmental stage and T-cell type (Figure 2C). The gene expression profile of naive CB T cells and T cells recovering after CBT was distinct from both adult and fetal Tregs. Thus, the distinct profile of naive CB CD4+ T cells after CBT does not appear to reflect adoption of a T-regulatory fate.
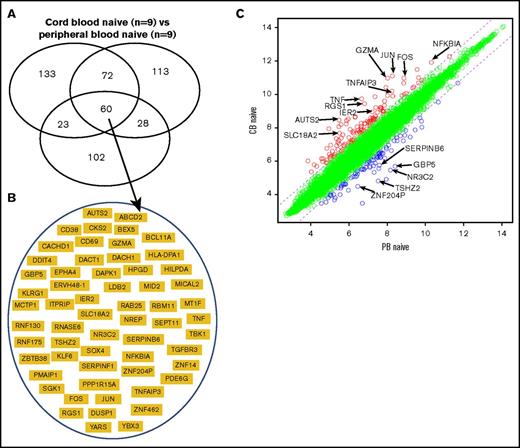
To further define a distinct molecular “signature” of naive CB CD4+ T cells, we identified differentially expressed genes in 3 separate microarray experiments comparing naive CD4+ T cells from CB and PB. In the 3 experiments, 288, 273, and 213 genes were differentially expressed. Sixty genes overlapped in the 3 experiments (Figure 3A; supplemental Table 2). These 60 genes therefore represent a distinct molecular “signature” of naive CB CD4+ T cells (Figure 3B-C).
Transcriptional signature of naive cord blood CD4+ T cells. (A) Venn diagram of differentially expressed genes in 3 microarray experiments comparing the naive CD4+ T cells from normal donor cord blood and peripheral blood. Sixty genes overlapped in the 3 experiments. (B) Sixty genes that represent the signature of naive cord blood CD4+ T cells. (C) Scatterplot of pairwise global gene expression comparison of naive cord blood CD4+ T cells and naive peripheral blood CD4+ T cells. Gene expression values are plotted on a log scale. Genes that were differentially expressed between groups (determined using P < .05 and fold-change ≥2) are indicated in red and blue. Specific genes that were differentially expressed are highlighted with arrows.
Transcriptional signature of naive cord blood CD4+ T cells. (A) Venn diagram of differentially expressed genes in 3 microarray experiments comparing the naive CD4+ T cells from normal donor cord blood and peripheral blood. Sixty genes overlapped in the 3 experiments. (B) Sixty genes that represent the signature of naive cord blood CD4+ T cells. (C) Scatterplot of pairwise global gene expression comparison of naive cord blood CD4+ T cells and naive peripheral blood CD4+ T cells. Gene expression values are plotted on a log scale. Genes that were differentially expressed between groups (determined using P < .05 and fold-change ≥2) are indicated in red and blue. Specific genes that were differentially expressed are highlighted with arrows.
Transcriptional profile of naive cord blood CD4+ T cells is enriched in a molecular program induced in the lymphopenic environment
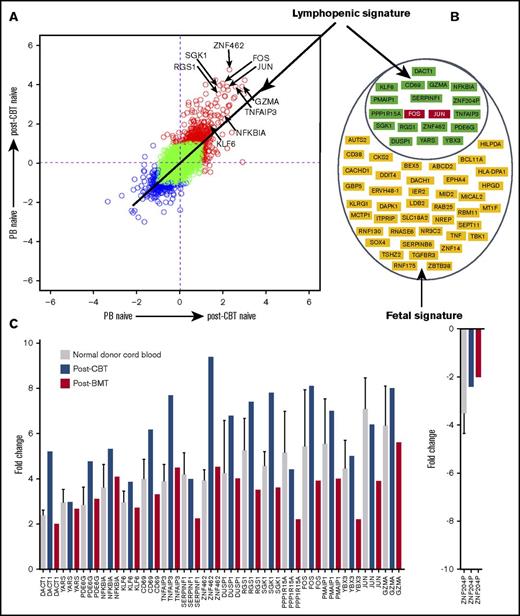
The distinct molecular signature of CB CD4+ T cells is likely to be driven by the stage of ontogeny and lymphopenic environment of the fetus.21-23 We therefore attempted to identify the genes responsible for lymphopenia-induced proliferation by examining those induced in the steady-state naive CD4+ T cells of the bone marrow graft after infusion into a (lymphopenic) transplant recipient. Nineteen of 60 overlapping genes representing the “signature” of naive CB CD4+ T cells were also differentially expressed in reconstituting naive PB CD4+ T cells after T-replete BMT (supplemental Figure 1A; supplemental Table 3). These 19 genes remained differentially expressed in the reconstituting naive CD4+ T cells after T-replete CBT (supplemental Figure 1B), and the upregulation or downregulation of all these 19 genes was higher in reconstituting naive CD4+ T cells after CBT than after BMT (Figure 4A-C). Thus, the differential regulation of these 19 genes in the posttransplant lymphopenic environment indicates their role in lymphopenia-induced proliferation, and the remaining 41 genes are likely to reflect the ontogeny of early life (supplemental Figures 1C and 2).
Transcriptional signature of naive cord blood CD4+ T cells is rich in genes induced in the lymphopenic environment. (A) Scatterplot of pairwise global gene expression comparison comparing gene expression in the 2 posttransplant environments (ie, cord blood transplantation and bone marrow transplantation). Gene expression values are plotted on a log scale, and specific genes upregulated in the lymphopenic environment are highlighted with arrows. (B) Nineteen genes induced in the lymphopenic signature and 41 genes of fetal signature. (C) Bar plot showing mean (and where possible, standard deviation) transcript values of 19 upregulated/downregulated genes representing genes induced in the lymphopenic environment. Interestingly, the differential regulation of 19 genes was higher in the naive CD4+ T cells from the cord blood and during early reconstitution after CBT than compared with bone marrow transplantation.
Transcriptional signature of naive cord blood CD4+ T cells is rich in genes induced in the lymphopenic environment. (A) Scatterplot of pairwise global gene expression comparison comparing gene expression in the 2 posttransplant environments (ie, cord blood transplantation and bone marrow transplantation). Gene expression values are plotted on a log scale, and specific genes upregulated in the lymphopenic environment are highlighted with arrows. (B) Nineteen genes induced in the lymphopenic signature and 41 genes of fetal signature. (C) Bar plot showing mean (and where possible, standard deviation) transcript values of 19 upregulated/downregulated genes representing genes induced in the lymphopenic environment. Interestingly, the differential regulation of 19 genes was higher in the naive CD4+ T cells from the cord blood and during early reconstitution after CBT than compared with bone marrow transplantation.
T-cell receptor and cell cycling pathways are highly upregulated in reconstituting naive cord blood CD4+ T cells
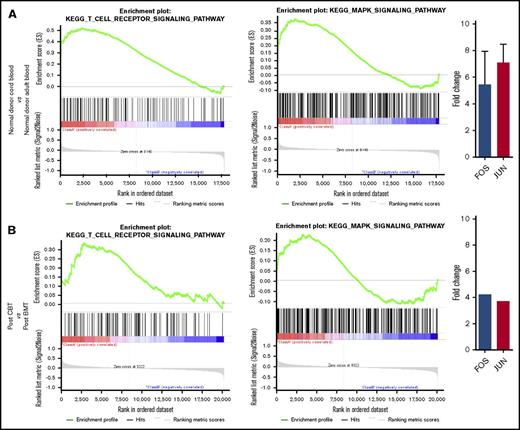
The distinct transcription program induced in the lymphopenic environment included the transcription factors c-fos and c-jun, which together form the AP-1 complex and were both highly upregulated in naive cord blood CD4+ T cells (Figure 4C). We therefore sought to understand the type of stimulus that induces the upregulation of AP-1 activity and found that TCR and MAPK signaling pathways were significantly upregulated canonical pathways in the naive CD4+ T cells from CB and the reconstituting naive CD4+ T cells after CBT and BMT (P < .001; FDR q value < 0.1; supplemental Figures 3 and 4A-B; Figure 5A). The canonical pathways upregulated at P < .005 and FDR q value < 0.1 and their relationship with TCR and MAPK signaling after enrichment mapping are shown in Table 2 and supplemental Figure 5. AP-1 is a crucial transcription factor complex of TCR signaling, and it is well-established that TCR activation induces MAPK signaling,24 and accordingly, we found significantly upregulated MAPK signaling in all the lymphopenic states. Finally, on comparing naive CD4+ T cells from the 2 posttransplant lymphopenic conditions (ie, CBT vs BMT, TCR, and MAPK signaling) were found to be upregulated after CBT compared with BMT (P < .02; FDR q value < 0.25; Figure 5B). Similarly, upregulation of c-fos and c-jun was significantly higher after CBT than after BMT (Figure 5B).
Plots showing upregulation of TCR-MAPK-AP1 signaling in the cord blood CD4+ T cells. (A) Gene expression profile of naive CD4+ T cells from cord blood and peripheral blood donors were compared to derive enrichment plots of TCR and MAPK signaling and transcript values of the 2 important transcription factors FOS and JUN (AP-1 complex). FOS and JUN upregulation is expressed as mean (and, where possible, as standard deviation). (B) When naive CD4+ T cells from the 2 posttransplant lymphopenic conditions (ie, CBT vs BMT) were compared, reconstituting CD4+ T cells after CBT were observed to have an upregulated TCR and MAPK signaling.
Plots showing upregulation of TCR-MAPK-AP1 signaling in the cord blood CD4+ T cells. (A) Gene expression profile of naive CD4+ T cells from cord blood and peripheral blood donors were compared to derive enrichment plots of TCR and MAPK signaling and transcript values of the 2 important transcription factors FOS and JUN (AP-1 complex). FOS and JUN upregulation is expressed as mean (and, where possible, as standard deviation). (B) When naive CD4+ T cells from the 2 posttransplant lymphopenic conditions (ie, CBT vs BMT) were compared, reconstituting CD4+ T cells after CBT were observed to have an upregulated TCR and MAPK signaling.
Significant canonical pathways in naive cord blood CD4+ T cells after enrichment mapping (at P < .005; FDR q value < 0.1) of gene set enrichment analysis pathways
| Name . | Size . | ES . | NES . | NOM P value . | FDR q value . |
|---|---|---|---|---|---|
| BIOCARTA_STRESS_PATHWAY | 25 | 0.747852 | 2.153037 | 0 | 0.002696 |
| BIOCARTA_TNFR2_PATHWAY | 18 | 0.747083 | 2.006501 | 0 | 0.005757 |
| BIOCARTA_GPCR_PATHWAY | 32 | 0.649287 | 1.973769 | 0 | 0.008621 |
| KEGG_T_CELL_RECEPTOR_SIGNALING_PATHWAY | 107 | 0.511906 | 1.956901 | 0 | 0.009042 |
| BIOCARTA_MET_PATHWAY | 35 | 0.63085 | 1.940215 | 0 | 0.010134 |
| BIOCARTA_TCR_PATHWAY | 42 | 0.590207 | 1.891878 | 0 | 0.014213 |
| BIOCARTA_MAPK_PATHWAY | 86 | 0.490017 | 1.785455 | 0 | 0.023409 |
| KEGG_MAPK_SIGNALING_PATHWAY | 257 | 0.363248 | 1.548704 | .0015873 | 0.096791 |
| BIOCARTA_PPARA_PATHWAY | 54 | 0.507107 | 1.717286 | .00174216 | 0.037614 |
| BIOCARTA_PYK2_PATHWAY | 26 | 0.635627 | 1.843618 | .00174825 | 0.019434 |
| BIOCARTA_INTEGRIN_PATHWAY | 35 | 0.568651 | 1.794564 | .00190476 | 0.023841 |
| BIOCARTA_HSP27_PATHWAY | 15 | 0.698828 | 1.79994 | .00195313 | 0.023302 |
| BIOCARTA_CDMAC_PATHWAY | 16 | 0.768664 | 1.966973 | .00199601 | 0.008 |
| BIOCARTA_INSULIN_PATHWAY | 21 | 0.67222 | 1.866742 | .00205339 | 0.018618 |
| BIOCARTA_IL1R_PATHWAY | 33 | 0.582227 | 1.803144 | .00361664 | 0.024056 |
| BIOCARTA_IGF1_PATHWAY | 21 | 0.648103 | 1.779082 | .00365631 | 0.024106 |
| BIOCARTA_RELA_PATHWAY | 16 | 0.715302 | 1.845727 | .0037594 | 0.020061 |
| BIOCARTA_RACCYCD_PATHWAY | 26 | 0.628528 | 1.833218 | .003861 | 0.02129 |
| BIOCARTA_IL6_PATHWAY | 22 | 0.684749 | 1.897918 | .00391389 | 0.013879 |
Bold text indicates pathways that are discussed in the “Results” and “Discussion.”
ES, enrichment score; FDR, false discovery rate; NES, normalized enrichment score; NOM, nominal.
We also found that tissue homeostasis regulating biological processes such as cell cycling and apoptosis were also significantly upregulated in all the lymphopenic states such as CB and posttransplantation (P < .001; FDR q value < 0.1; supplemental Figure 6A-B; supplemental Table 4). However, similar to TCR-MAPK signaling, the upregulation of tissue homeostasis regulating processes was significantly higher after CBT compared with BMT (supplemental Figure 6B). Thus, upregulated TCR-MAPK signals and tissue homeostasis regulating biological processes may endow naive CB CD4+ T cells with an enhanced cell cycling ability in the lymphopenic environment.
Ligation of TCR with self-MHC molecules mediate enhanced proliferation of cord blood CD4+ T cells through the AP-1 transcription factor complex
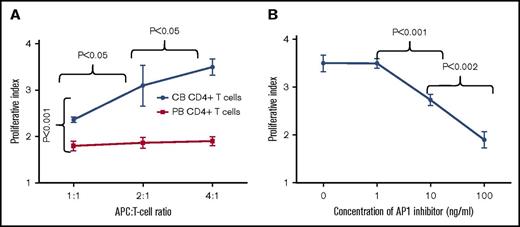
To determine whether TCR signaling mediates enhanced proliferation of naive CB CD4+ T cells, carboxyfluorescein diacetate succinimidyl ester-labeled CB and PB CD3+ T cells were cultured with self-APCs in an increasing APC:T-cell ratio. The proliferative indices of CB CD4+ T cells with APC:T cell ratio of 1:1, 2:1, and 4:1 were 2.3 (±0.05), 2.9 (±0.2), and 3.5 (±0.17), respectively (Figure 6A; supplemental Figure 7A). In contrast, proliferative indices of PB CD4+ T cells with an APC:T cell ratio of 1:1, 2:1, and 4:1 were 1.8 (±0.1), 1.8 (±0.1), and 1.9 (±0.1), respectively (Figure 6A; supplemental Figure 7B). Thus, significantly higher proliferation of CB CD4+ T cells occurred compared with PB CD4+ T cells (P < .05). A significant effect of an increasing APC:T-cell ratio was observed on proliferation of CB CD4+ T cells without such an effect on the PB CD4+ T cells (P < .05).
AP-1 transcription factor complex mediates rapid proliferation of cord blood CD4+ T cells. (A) Line graph showing increased proliferation of cord blood CD4+ T cells in response to self-APCs. Cord blood CD4+ T-cell proliferation increased with an increasing APC:T-cell ratio of 1:1, 2:1, and 4:1. However, no such effect was observed on peripheral blood CD4+ T cells. (B) Line graph showing inhibition of cord blood CD4+ T-cell proliferation at different concentrations of AP-1 inhibitor. The inhibitory effect was proportional to the increasing concentration of AP-1 inhibitor. The dots represent mean and error bars represent standard deviation.
AP-1 transcription factor complex mediates rapid proliferation of cord blood CD4+ T cells. (A) Line graph showing increased proliferation of cord blood CD4+ T cells in response to self-APCs. Cord blood CD4+ T-cell proliferation increased with an increasing APC:T-cell ratio of 1:1, 2:1, and 4:1. However, no such effect was observed on peripheral blood CD4+ T cells. (B) Line graph showing inhibition of cord blood CD4+ T-cell proliferation at different concentrations of AP-1 inhibitor. The inhibitory effect was proportional to the increasing concentration of AP-1 inhibitor. The dots represent mean and error bars represent standard deviation.
Finally, we studied the effect of an AP-1 inhibitor on proliferation of CB CD4+ T cells to confirm AP-1 mediated regulation of TCR-MAPK signals in CB CD4+ T cells. The proliferative indices of CB CD4+ T cells cultured with APC’s at an APC:T cell ratio of 4:1 and an AP-1 inhibitor concentration of 1 ng/mL, 10 ng/mL, and 100 ng/mL were 3.5 (±0.1), 2.7 (±0.1), and 1.9 (±0.1) respectively (Figure 6B; supplemental Figure 7C). Thus, increasing concentrations of AP-1 inhibitor had a significantly increased inhibitory effect on CB CD4+ T-cell proliferation, indicating that AP-1 inhibition attenuated TCR-MAPK signals (P < .05). These data suggest that MHC:TCR interactions through AP-1 complex mediates enhanced proliferation of CB CD4+ T cells.
Discussion
A growing body of evidence supports distinct ontogenic origins of the fetal and adult lymphoid immune systems.13,25 Fetal lymphopoiesis originates from Lin28b+ hematopoietic stem cell progenitors, and postnatally, Lin28b downregulates, resulting in let-7 miRNA biogenesis and an adult lymphoid program. Naive fetal and CB CD4+ T cells proliferate rapidly in response to allogeneic stimulation in vitro.13,26 Despite the robust proliferative responses of CB T cells, a significantly delayed T-cell reconstitution is observed after CBT with a serotherapy-based conditioning regimen.3,6 In contrast, T-replete CBT resulted in an early and CD4+ T-cell biased immune reconstitution compared with a CD8+ T-cell reconstitution after T-replete BMT.1,3,4 Thus, 2 distinct patterns of T-cell reconstitution have been observed in T-replete HCT, depending on the source of hematopoietic cells.
T-cell reconstitution in numerous studies of human lymphopenia induced by chemotherapy is biased toward CD8+ T cells.27 The exact mechanism of CD8+ T-cell biased immune reconstitution after BMT is not known; a possible explanation of this is expansion of memory and effector CD8+ T cells infused with the graft.28 However, the rapid CD4+ T-cell biased expansion after T-replete CBT is surprising, given the naivety of CB T cells. Here, we provide compelling evidence for the distinct transcription profiles of naive CD4+ T cells from CB and during early reconstitution after CBT compared with those from the PB. The CB T-cell profiles were similar to naive CD4+ T cells from the fetal lymph nodes. In contrast, the reconstituting naive CD4+ T cells after T-replete BMT had a transcription profile similar to the PB CD4+ T cells. Thus, recapitulation of fetal ontogeny could explain the unique pattern of immune reconstitution after T-replete CBT.
Fetal ontogeny of T cells appears to be regulated by the physiologically lymphopenic environment of the fetus. Neonatal mice have fewer lymphoid cells than adult mice.23 In mice and humans, a higher cycling rate is observed in neonatal than in adult T cells, in spite of retention of a naive phenotype.29,30 We therefore questioned whether naive CB CD4+ T cells are rich in transcriptional programs that mediate proliferation in the lymphopenic environment. We speculated that such a transcriptional program would be induced in peripheral naive CD4+ T cells carried with T-replete BMT. Thus, we identified a distinct transcriptional program of lymphopenia-induced proliferation and confirmed that this program was also upregulated in naive CB CD4+ T cells expanding in the posttransplant lymphopenic environment. A crucial transcription factor complex of TCR signaling, AP-1, which represents a convergence point for several TCR-initiated signaling pathways,24 was found to be upregulated in all the lymphopenic states. AP-1 was highly upregulated in reconstituting naive CD4+ T cells after CBT. This upregulation was more marked than that observed after BMT. It is well-established that TCR activation induces MAPK signaling,24 and accordingly, we found significantly upregulated MAPK signaling in all the lymphopenic states. It is also noteworthy that on comparing the GEPs of reconstituting naive CD4+ T cells from both posttransplant lymphopenic environments, TCR signaling was significantly upregulated after CBT than after BMT. Further, increased proliferation of CB CD4+ T cells in response to self-MHC:TCR signals and proportional inhibition of CB CD4+ T cells with a small molecule inhibitor of AP-1 complex suggests a role of TCR signaling in driving the T-cell reconstitution after T-replete CBT.
The strength of TCR activation determines the propensity of T cells to undergo lymphopenia-induced proliferation.15,31,32 Therefore, in the lymphopenic environment, the T cells with high-affinity TCR for self-peptide MHC ligands undergo faster proliferation than T cells with low affinity. In mouse, lymphopenia-induced homeostatic proliferation and proliferation against foreign antigens such as gut bacteria are the 2 mechanisms that mediate homeostatic proliferation.33 The extent to which lymphopenia-induced homeostatic proliferation occurs is determined by the degree of lymphopenia.34 Hence, the 10 times lower number of T cells carried with the cord blood graft than with the bone marrow graft may have resulted in greater lymphopenia-induced homeostatic proliferation than proliferation against foreign antigens. The latter is also an important cause of proliferation, as first reported by classic experiments in the sheep, where the turnover of the recirculating T-cell pool was shown to be quite low just before birth but massive just after birth, through contact with gut bacteria.35 Thus, this study raises a question about the contribution of degree of lymphopenia vs foreign antigens in the gut in rapid immune reconstitution after T-replete CBT.
The key question, however, is the functional importance of upregulated TCR signaling during recapitulation of fetal T-cell ontogeny. The sensitivity of TCR dictates its ability to respond to self and nonself antigens.36 It is therefore possible that enhanced antigen recognition resulting from heightened TCR signaling may mediate a robust antiviral and antileukemic activity. An augmented antileukemia activity after CBT is reported in patients with minimal residual disease.37 This suggests that an immune system derived from cord blood can recognize leukemia antigens better than the immune system derived from bone marrow or peripheral blood graft. Therefore, leukemia-specific vaccine after T-replete CBT may further enhance the ability of cord blood T cells to eradicate leukemia.
In summary, our results show recapitulation of fetal ontogeny after T-replete CBT. This is the first study to bring out the relevance of a “layered immune system” in hematopoietic cell transplantation. These findings may have important functional sequelae. The upregulated TCR signaling pathway in CB CD4+ T cells may enhance their ability to mediate robust antiviral and antileukemia effects.7-10,37 Further, the remarkable proliferative capacity of cord blood T cells may make them ideal effector cells for immunotherapy strategies such as redirection with chimeric antigen receptors,38 or post-HCT vaccination strategies.39 Although the focus of this study was CB CD4+ T cells, other fetal cell subsets in the CB grafts have not been studied and may have functions distinct to their adult counterparts.
The data reported in this article have been deposited in the Gene Expression Omnibus database (accession number GSE104773).
The full-text version of this article contains a data supplement.
Acknowledgments
The authors thank Jonathan Sprent for critical reading of the manuscript. The authors also thank Nipurna Jina for processing the microarray samples.
This work was supported by Bloodwise (Leukaemia and Lymphoma Research), the Olivia Hodson Cancer Fund, Great Ormond Street Hospital Children’s Charity, and National Institute for Health Research Biomedical Research Centre at Great Ormond Street Hospital.
Authorship
Contribution: P.H., M.H., W.Q., R.C., K.C.G., A.S., P.J.A., and P.V. designed research; P.H. performed experiments; P.H. analyzed the data and performed statistical analysis; and P.H., P.J.A., and P.V. wrote the manuscript.
Conflict-of-interest disclosure: The authors declare no competing financial interests.
Correspondence: Prashant Hiwarkar, Department of Haematology and Bone Marrow transplantation, Royal Manchester Children’s Hospital, Upper Brook St, Manchester M13 9WL, United Kingdom; e-mail: phiwarkar@nhs.net.

