Key Points
Proteasome inhibition activates multiple kinases in myeloma cells resulting in the phosphorylation of p53, HSP27, c-JUN, and HSF1.
TG02 inhibits proteasome inhibitor (PI)–induced HSF1 pS326, representing a novel mechanism for a TG02 and PI combination.
Introduction
Multiple myeloma (MM) is a plasma cell malignancy with an estimated 30 280 new cases and the cause of 12 590 deaths in the United States in 2017.1 Mechanisms of MM therapies such as the proteasome inhibitors (PIs) bortezomib and carfilzomib have been widely studied and broadly target normal or malignant plasma cell biology.2 However, nearly all patients will develop PI resistance. Myeloma cells treated with PIs activate the heat shock response (HSR) to avoid apoptosis, and the HSR has been linked to PI resistance.3,4
The HSR consists of heat shock protein (HSP) upregulation, and heat shock factor 1 (HSF1) is the master transcription factor that regulates the bortezomib-induced HSR.5,6 HSF1 drug screens have failed to lead to an inhibitor approved by the US Food and Drug Administration, largely because of off-target effects or lack of efficacy at therapeutically relevant concentrations.5 We have recently shown that HSF1-mediated bortezomib-induced HSP upregulation is associated with HSF1 serine 326 (S326) phosphorylation.6 Therefore, we sought to identify and inhibit the kinase(s) responsible for PI-induced S326 phosphorylation (PI-pS326) and observe PI-pS326 and apoptotic effects. We found that the multikinase inhibitor TG02 could inhibit PI-induced HSF1 phosphorylation at S326. Two phase 1 studies of TG02 in hematological malignancies were recently completed and showed activity in combination with carfilzomib in relapsed/refractory MM.7-9 This work uncovers a novel mechanism explaining the efficacy of a TG02 and PI combination in MM.
Methods
Cell lines
MM.1s, KMS18, and U266 cell line characteristics and procurement details have been previously described.6 H929 cell line was obtained from American Type Culture Collection (Manassas, VA).
Patient samples
CD138+ cells (>75%) were purified from myeloma patient bone marrow aspirates as previously described.6 Extra bone marrow was collected from patients who consented on an institutional review board–approved protocol for research purposes. Samples were deidentified before delivery to the laboratory.
PI treatment
Bortezomib was obtained from LC Labs, and treatment was performed as previously described.6 Carfilzomib was provided by Onyx Pharmaceuticals (San Francisco, CA), prepared in dimethyl sulfoxide, and diluted in complete RPMI 1640 medium. Treatment details are same as bortezomib treatment.
Subcellular fractionation
Cells were treated with 0 or 8 nM bortezomib for 9 hours and lysed as previously described.6
Western blot analysis
Western blot analysis was performed as previously described.6
R&D Biosystems ARY003B phosphoprotein array
MM.1s cells (5 × 10⁶) were treated with 0 or 8 nM bortezomib for 9 hours. Array was performed per manufacturer’s instructions.
TG02 treatment
TG02 was generously provided by Tragara Pharmaceuticals, prepared in dimethyl sulfoxide, and diluted in complete RPMI 1640 medium.10
siRNA treatment
Short interfering (siRNA) treatment was performed using either a nontargeting control or targeted siRNA as previously described.6
Cell death analysis
Cell death analysis was performed by using annexin V/PI and flow cytometry as previously described.6
Results and discussion
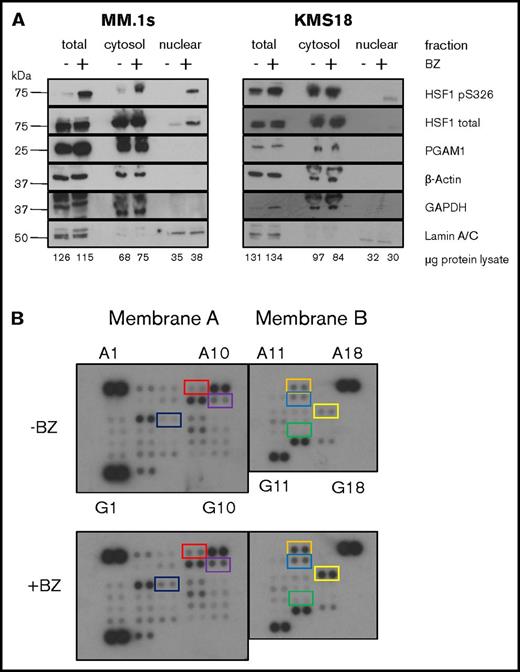
We previously determined that neither AKT, calcium/calmodulin-dependent protein kinase II, JAK, JNK, nor MAPK/extracellular signal-regulated kinase is the responsible kinase (Shah et al6 ; S.P.S. and L.H.B., unpublished data, 10 July 2015). To help identify the kinase, we performed subcellular fractionation in order to determine whether the kinase is cytoplasmic or nuclear (Figure 1A). We treated 2 myeloma cell lines, MM.1s and KMS18, with bortezomib for 9 hours, collected protein lysate, and performed either total lysis or subcellular fractionation. We then performed sodium dodecyl sulfate–polyacrylamide gel electrophoresis using equal cell numbers for each fraction and western blot analysis for pS326 and total HSF1. We also probed for cytoplasmic and nuclear localization controls. In MM.1s cells, we observe minimal cytoplasmic and no detectable nuclear baseline pS326. Bortezomib leads to a strong increase in both cytoplasmic and nuclear pS326 at 9 hours. KMS18 cells show increased baseline cytoplasmic pS326 compared with MM.1s cells, but similarly, no detectable baseline nuclear pS326. Cytoplasmic pS326 remains high in bortezomib-treated KMS18 cells, and bortezomib also leads to increased nuclear pS326 as with MM.1s cells. Similar results were found with carfilzomib treatment (data not shown). From these data, we infer that the kinase responsible for PI-pS326 is cytoplasmic.
Cytosolic kinases are activated by PIs and phosphorylate HSF1. (A) HSF1 S326 is phosphorylated in the cytoplasm. MM.1s and KMS18 cells were treated with 8 nM bortezomib for 9 hours followed by either total lysis or subcellular fractionation and equal cell number western blot analysis. Data are representative of 4 independent experiments. (B) Human kinome phosphoprotein microarray identifies bortezomib (BZ)–induced targets. MM.1s cells were treated with 8 nM bortezomib for 9 hours. Protein lysis and all subsequent steps were performed using the R&D Systems Human Phospho-Kinase Antibody Array as per manufacturer's instructions. Coordinate pairs and box colors are matched with their respective targets as follows: red, A7/8 = JNK1/2/3; orange, A13/14 = p53 (S392); purple, B9/10 = Akt1/2/3; blue, B13/14 = p53 (S46); black, C5/6 = HSP27; yellow, C15/16 = c-Jun; green, E13/14 = p27. Data are representative of 2 independent experiments.
Cytosolic kinases are activated by PIs and phosphorylate HSF1. (A) HSF1 S326 is phosphorylated in the cytoplasm. MM.1s and KMS18 cells were treated with 8 nM bortezomib for 9 hours followed by either total lysis or subcellular fractionation and equal cell number western blot analysis. Data are representative of 4 independent experiments. (B) Human kinome phosphoprotein microarray identifies bortezomib (BZ)–induced targets. MM.1s cells were treated with 8 nM bortezomib for 9 hours. Protein lysis and all subsequent steps were performed using the R&D Systems Human Phospho-Kinase Antibody Array as per manufacturer's instructions. Coordinate pairs and box colors are matched with their respective targets as follows: red, A7/8 = JNK1/2/3; orange, A13/14 = p53 (S392); purple, B9/10 = Akt1/2/3; blue, B13/14 = p53 (S46); black, C5/6 = HSP27; yellow, C15/16 = c-Jun; green, E13/14 = p27. Data are representative of 2 independent experiments.
Next, to identify potential kinases, we used a phosphokinase antibody array to identify kinases activated by bortezomib (Figure 1B). We treated MM.1s cells with bortezomib and quantified phosphokinase induction (supplemental Table 1). Bortezomib led to a >1.5-fold increase in p53 (S392), HSP27, and c-Jun phosphorylation. Bortezomib also led to a 1.2- to 1.5-fold increase in JNK1/2/3, Akt1/2/3, p53 (S46), and p27 phosphorylation. The kinases responsible for these phosphorylation events include cyclin-dependent kinases (CDKs), among other families (supplemental Table 1).11
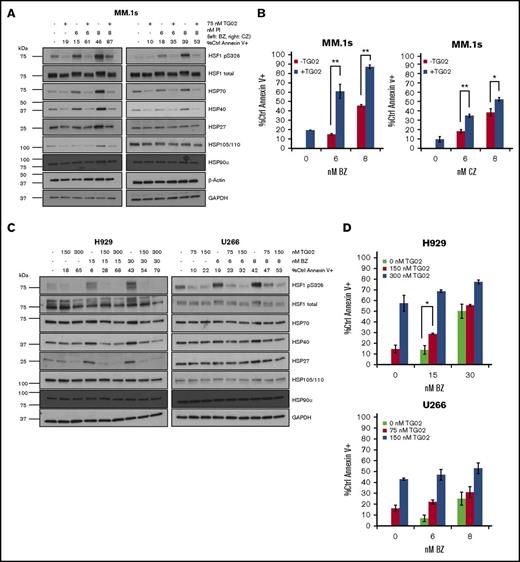
Given the number of potential HSF1 kinases identified by the microarray, we elected to probe the response using a multikinase inhibitor that has activity in combination with PIs. Therefore, we treated cells with TG02, whose single nanomolar range targets are CDKs.12 TG02 also inhibits other kinases at higher concentrations.12 First, we tested 3 MM cell lines of varying PI sensitivity and degrees of PI-induced HSF1-mediated HSR. In MM.1s cells, a TG02 and bortezomib or carfilzomib combination leads to inhibition of both HSF1 phosphorylation and HSF1-mediated PI-induced HSP upregulation (Figure 2A). TG02 strongly inhibits constitutive and PI-induced HSP70 and HSP40 upregulation, and bortezomib-induced HSP27 and HSP105/110 upregulation. Consistent with previous findings, the combination of TG02 and bortezomib results in a strong additive effect on apoptosis, and we confirm our previous findings that the combination of TG02 and carfilzomib results in an additive effect in MM.1s cells (Figure 2B).10,13 We observe that TG02 strongly inhibits PI-pS326, PI-induced HSP27 upregulation, and PI-induced HSP40 upregulation in H929 cells (Figure 2C, left). TG02 also inhibits PI-pS326 in U266 cells but does not lead to HSP inhibition (Figure 2C, right). An additive effect on apoptosis is observed in H929 cells with TG02 and low-dose bortezomib treatment (Figure 2D, upper). However, no additive effect on apoptosis is observed in U266 cells, which is consistent with the lack of HSR induction in this cell line (Figure 2D, lower).
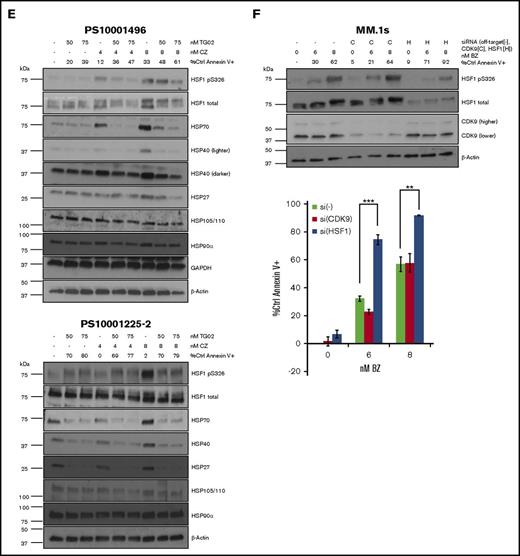
TG02 inhibits PI-induced HSF1 S326 phosphorylation and PI-induced HSR in myeloma cells. (A) MM.1s cells were cotreated with TG02 and either bortezomib (left) or carfilzomib (right). Protein lysates were collected at 9 hours for western blot analysis, and cells were analyzed at 24 hours for apoptosis. Apoptosis was measured by annexin V and PI staining and flow cytometry. Western blot data are representative of 4 independent experiments. (B) TG02 and PI combination leads to an additive effect on apoptosis in MM.1s cells. Experimental setup was as described in panel A. Apoptosis was measured as described previously. P values are calculated by paired Student t test. *P < .05; **P < .01. (C) TG02 inhibits bortezomib-induced HSF1 S326 phosphorylation and bortezomib-induced HSR in H929 cells and HSF1 S326 phosphorylation in U266 cells. H929 or U266 cells were cotreated with TG02 and bortezomib. Western blot data are representative of 4 independent experiments. (D) TG02 and PI combination leads to an additive effect on apoptosis in H929 cells but not U266 cells. Experimental setup was as described in panel C. Apoptosis was measured as described previously. P -values are calculated by paired Student t test. *P < .05; **P < .01. (E) TG02 inhibits carfilzomib-induced HSF1 S326 phosphorylation and bortezomib-induced HSR in patient samples. CD138+ (>90%: PS10001496; >75%: PS10001225-2) cells from freshly isolated patient samples were cotreated with TG02 and carfilzomib. Experimental design as previously. (F) CDK9 is not responsible for bortezomib-induced S326 phosphorylation, and its silencing does not sensitize cells to bortezomib-induced apoptosis. MM.1s cells were treated with a nonsilencing control (-), CDK9 (C), or HSF1 (H) siRNA for 24 hours followed by bortezomib treatment of either an additional 9 hours for western blot analysis (top) or 24 hours for flow cytometry analysis (bottom). Data are representative of 3 independent experiments. Apoptosis was measured as described previously. P values are calculated by paired Student t test. *P < .05; **P < .01.
TG02 inhibits PI-induced HSF1 S326 phosphorylation and PI-induced HSR in myeloma cells. (A) MM.1s cells were cotreated with TG02 and either bortezomib (left) or carfilzomib (right). Protein lysates were collected at 9 hours for western blot analysis, and cells were analyzed at 24 hours for apoptosis. Apoptosis was measured by annexin V and PI staining and flow cytometry. Western blot data are representative of 4 independent experiments. (B) TG02 and PI combination leads to an additive effect on apoptosis in MM.1s cells. Experimental setup was as described in panel A. Apoptosis was measured as described previously. P values are calculated by paired Student t test. *P < .05; **P < .01. (C) TG02 inhibits bortezomib-induced HSF1 S326 phosphorylation and bortezomib-induced HSR in H929 cells and HSF1 S326 phosphorylation in U266 cells. H929 or U266 cells were cotreated with TG02 and bortezomib. Western blot data are representative of 4 independent experiments. (D) TG02 and PI combination leads to an additive effect on apoptosis in H929 cells but not U266 cells. Experimental setup was as described in panel C. Apoptosis was measured as described previously. P -values are calculated by paired Student t test. *P < .05; **P < .01. (E) TG02 inhibits carfilzomib-induced HSF1 S326 phosphorylation and bortezomib-induced HSR in patient samples. CD138+ (>90%: PS10001496; >75%: PS10001225-2) cells from freshly isolated patient samples were cotreated with TG02 and carfilzomib. Experimental design as previously. (F) CDK9 is not responsible for bortezomib-induced S326 phosphorylation, and its silencing does not sensitize cells to bortezomib-induced apoptosis. MM.1s cells were treated with a nonsilencing control (-), CDK9 (C), or HSF1 (H) siRNA for 24 hours followed by bortezomib treatment of either an additional 9 hours for western blot analysis (top) or 24 hours for flow cytometry analysis (bottom). Data are representative of 3 independent experiments. Apoptosis was measured as described previously. P values are calculated by paired Student t test. *P < .05; **P < .01.
We treated 2 freshly isolated CD138+ patient samples with the combination of TG02 and carfilzomib (Figure 2E). One sample (PS10001496) showed sensitivity to both carfilzomib and TG02, leading to an additive effect on apoptosis. Consistent with the cell line data, TG02 inhibited both PI-pS326 and HSR induction (Figure 2E, top panel). The other sample (PS10001225-2) showed sensitivity to TG02 but was resistant to carfilzomib, and no additive effect on apoptosis was observed (Figure 2E, bottom panel). Single agent TG02 sensitivity can occur independent of HSF1, and possible cytotoxic mechanisms have been previously published.14 This sample had higher constitutive HSP levels, which were inhibited by TG02. Although the cells were resistant to carfilzomib-induced apoptosis, PI-pS326 and HSP induction were observed. This suggests an alternate mechanism of carfilzomib resistance that is likely downstream of the HSR, rendering these cells resistant to its inhibition. For example, HSP expression has been shown to increase autophagy, and increased autophagy has been shown to lead to carfilzomib resistance.15,16
CDK9 is the most sensitive TG02 target.12 Therefore, we performed CDK9 siRNA knockdown in MM.1s cells but did not observe any change in induced pS326 levels or any additive effect with bortezomib (Figures 2F). This is consistent with our previous findings with carfilzomib.10 Taken together, our data show that TG02 inhibits pS326 in MM cell lines and patient samples.
In summary, we show that the PI-pS326 kinase is cytoplasmic and inhibited by TG02. We show a novel mechanism by which TG02 combines with PIs to increase MM apoptosis: downregulation of the PI-induced HSR by inhibition of HSF1 activation. We were unable to identify the HSF1 kinase but showed that it is inhibitable by a kinase inhibitor that has shown clinical activity in combination with PIs. These findings support the further development of TG02 in combination with PIs for the treatment of MM.
The full-text version of this article contains a data supplement.
Acknowledgments
The authors thank Shannon Matulis for technical support.
This work was supported in part by a grant from the National Cancer Institute, National Institutes of Health (R01 CA192844) (L.H.B.).
Authorship
Contribution: S.P.S. designed the study, executed the experiments, interpreted data, and wrote the manuscript; A.K.N. designed the study, interpreted data, and executed the experiments; S.L. designed the study and critically reviewed the data; and L.H.B. oversaw the project, designed the study, interpreted data, and wrote the manuscript.
Conflict-of-interest disclosure: A.K.N. is a consultant/advisory board member for Spectrum Pharmaceuticals, Novartis, and Amgen. S.L. is a consultant/advisory board member and receives research support from Millennium, the Takeda Oncology Company, Celgene, Bristol-Myers Squibb, Janssen Pharmaceutical Companies, and the Pharmaceutical Companies of Johnson & Johnson and is a consultant/advisory board member for Novartis and Onyx Pharmaceuticals. The remaining authors declare no competing financial interests.
Correspondence: Lawrence H. Boise, Department of Hematology and Medical Oncology, Winship Cancer Institute of Emory University, Emory University School of Medicine, 1365 Clifton Rd NE, Room C4012, Atlanta, GA 30322; e-mail: lboise@emory.edu.


