Key Points
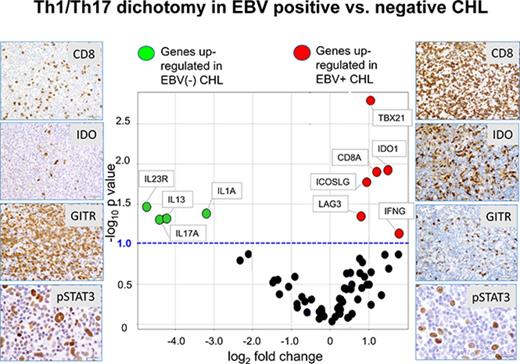
CHL broadly expresses the PD-1/PD-L1 pathway, but EBV+ CHL displays a Th1 profile, whereas EBV− tumors have a pathogenic Th17 profile.
These findings support further studies to define the role of the IL-23/IL-17 axis in CHL response/resistance to anti-PD-1 therapy.
Abstract
Classical Hodgkin lymphoma (CHL) is a neoplasm characterized by robust inflammatory infiltrates and heightened expression of the immunosuppressive PD-1/PD-L1 pathway. Although anti-PD-1 therapy can be effective in >60% of patients with refractory CHL, improved treatment options are needed for CHLs which are resistant to anti-PD-1 or relapse after this form of immunotherapy. A deeper understanding of immunologic factors in the CHL microenvironment might support the design of more effective treatment combinations based on anti-PD-1. In addition, because the Epstein-Barr virus (EBV) residing in some CHL tumors is strongly immunogenic, we hypothesized that characteristics of the tumor immune microenvironment in EBV+ CHL would be distinct from EBV− CHL, with specific implications for designing combination treatment regimens. Employing immunohistochemistry for immune cell subsets and checkpoint molecules, as well as gene expression profiling, we characterized 32 CHLs from the Johns Hopkins archives, including 12 EBV+ and 20 EBV− tumors. Our results revealed a dichotomous cellular and cytokine immune milieu in EBV+ vs EBV− CHL. EBV+ tumors displayed a T helper 1 (Th1) profile typical of effective antitumor immunity, with increased infiltration of CD8+ T cells and coordinate expression of the canonical Th1 transcription factor Tbet (TBX21), interferon-γ (IFNG), and the IFN-γ–inducible immunosuppressive enzyme indoleamine 2,3-dioxygenase. In contrast, EBV− tumors manifested a pathogenic Th17 profile and ongoing engagement of the interleukin-23 (IL-23)/IL-17 axis, with heightened phosphorylated signal transducer and activator of transcription 3 expression in infiltrating lymphocytes. These findings suggest that drugs blocking the IL-23/IL-17 axis, which are already in the clinic for treating certain autoimmune disorders, may enhance the therapeutic impact of anti-PD-1 therapy in EBV− CHL.
Introduction
The inflammatory component of classical Hodgkin lymphoma (CHL) dominates tumor masses. As a consequence, for much of the twentieth century, there was no certainty that the inflammatory masses harbored tumor cells, and clinicians referred to Hodgkin “disease” rather than lymphoma. Ultimately, it became clear that clonal tumor cells of B-cell lineage (Hodgkin/Reed-Sternberg cells [HRS]) were present, and that a variable proportion of cases were associated with Epstein-Barr virus (EBV) in tumor cells.1,2 However, the pathogenesis of the inflammatory infiltrate remained elusive as did the role of the virus.
Primary EBV infection is usually asymptomatic but may be associated with infectious mononucleosis.3 After infection, a vigorous immune response typically controls but does not eradicate viral infection, and the virus persists for the life of the host. In rare individuals, EBV-associated malignancies develop, and in some cases, immune dysfunction contributes to the process. For instance, both genetic lesions affecting immune response and certain immunosuppressants are associated with increased risk of EBV lymphoproliferative disease.4-6 These EBV-associated hematolymphoid tumors often respond to immune interventions such as adoptive cellular therapy with EBV-specific T cells or withdrawal of immunosuppressive pharmacologic agents.7
Immune dysfunction as a predisposing factor is poorly defined in EBV+ tumors not associated with overt systemic immunosuppression, including CHL, nasopharyngeal carcinoma, and gastric carcinoma.8 EBV+ HRS cells in CHL express EBV-associated proteins that are also expressed in the course of primary EBV infection, including Epstein-Barr virus nuclear antigen-1, latency membrane protein 1, and latency membrane protein 2.9-11 Immunohistochemistry (IHC) shows high-level expression of major histocompatibility complex class I molecules by the tumor cells of EBV-associated CHL vs either low-level or absent expression of major histocompatibility complex class I molecules on tumor cells of EBV-negative tumors.11 Because the inflammatory infiltrate in both EBV-associated and EBV-negative CHL is rich in CD4+ and CD8+ T cells,12 and commonly recognized epitopes in some of the proteins expressed in EBV infection are not mutated when expressed in EBV-associated tumors, it would appear that EBV-associated tumor cells should be readily cleared by the host. However, T-cell function in these tumors appears inhibited, consistent with the demonstration that CHL is exquisitely sensitive to drugs that inhibit the immune checkpoint receptor anti-PD-1.13-16 In addition, the remarkable response rate of CHL to anti-PD-1 has led to an appreciation that copy number alterations in PD-L1 and PD-L2 are a defining feature of CHL without regard to EBV association.13,15,17
In this study, we sought to further characterize the expression of immune checkpoint molecules and the inflammatory milieu in EBV+ and EBV− CHL, in order to provide a more complete understanding of CHL biology and to develop more effective treatment strategies for this neoplasm. We find that the Th profiles are strikingly different, with EBV+ CHL demonstrating a T helper 1 (Th1) profile, whereas EBV− CHL has a Th17 profile. The therapeutic implications of these findings are discussed.
Methods
Patients and tumor specimens
This study was conducted under approval from the Johns Hopkins Hospital Institutional Review Board in accordance with The Declaration of Helsinki. The Johns Hopkins Hospital pathology database was searched to identify patients diagnosed with CHL at our institution. Clinical history was reviewed, and specimens from patients with human immunodeficiency virus infection were excluded. All appropriate specimens with sufficient tissue for additional immunohistochemical and molecular analyses were included in this study.
IHC
Immunohistochemical stains were performed on 4- to 5-μm-thick, formalin-fixed, paraffin-embedded (FFPE) tissue sections, to characterize the tumor immune microenvironment. CD3, CD4, CD8, CD20, CD68, and FoxP3 IHCs were performed according to standard automated methods. PD-L1, PD-1, and LAG-3 IHCs were performed manually, as previously described.18-20 TIM-3, GITR, and indoleamine 2,3-dioxygenase (IDO) stains were performed using monoclonal antibody (mAb) clones F38-2E2 (Biolegend 345001), 6G10 (provided by Bristol-Myers Squibb), and V1NC3IDO (Affymetrix 14-9750-82), respectively. Antigen retrieval for TIM-3 and GITR was performed in a decloaking chamber (Biocare Medical) at 120°C for 10 minutes, in a pH 6.0 citrate buffer (Dako S1699). The primary antibodies were applied at concentrations of 1.5 μg/mL and 0.1 μg/mL, respectively, and allowed to incubate at 4°C overnight. The secondary antibodies included an anti-mouse IgG1-biotin (BD Pharmingen 553441) at 1 μg/mL for the TIM-3 protocol, and a biotinylated rabbit anti-mouse immunoglobulin (Dako K1500) at ready-to-use concentration for the GITR protocol. A TSA plus biotin kit (Perkin Elmer NEL749B001KT, 1:50 dilution) was used to amplify the signal. Amplification was performed for 7 minutes for the TIM-3 protocol and 5 minutes for the GITR protocol. A 15-minute treatment with streptavidin–horseradish peroxidase (HRP; Dako P0397) at a dilution of 1:300 followed the amplification steps, followed by visualization with 3,3′‐diaminobenzidine (DAB; Sigma D4293). A polymer-based IHC method was used for the detection of IDO. The primary antibody was used at 2 μg/mL and incubated at 4°C overnight, followed by the application of anti-mouse-HRP Polymer (VectorLabs MP-7402) for 30 minutes, and subsequent visualization with DAB. Immunolabeling for phosphorylated signal transducer and activator of transcription 3 (pSTAT3) was performed as follows. Briefly, after dewaxing in xylene and rehydration through a graded ethanol series, slides were immersed in 1% Tween 20 for 1 minute; then, heat‐induced antigen retrieval was performed in a steamer using a commercial Target Retrieval Solution (Dako S170084-2) for 45 minutes. Slides were rinsed in phosphate-buffered saline with Tween 20, and endogenous peroxidase and phosphatase were blocked (Dako S2003). Sections were then incubated with primary anti-pSTAT3 rabbit mAb (1:25 dilution; Cell Signaling 9145) for 16 hours at 4°C. The primary Ab was detected by 30-minute incubation with HRP-labeled secondary Ab (Leica Microsystems PV6119), followed by detection with DAB (Sigma‐Aldrich D4293), counterstaining with Harris hematoxylin, rehydration, and coverslip mounting. For diagnostic purposes, a CD30 IHC stain was performed (Ventana, Tucson, AZ 790-2926), and EBV-encoded RNA (EBER) in HRS tumor cells was detected with an in situ hybridization (ISH) probe against EBER (Ventana 760-1209 DNP Probe).
All IHC stains were independently quantified 3 times, with the reader blinded to previous estimates and to the EBV status of the specimen. The slides were scored by A.S.D., with R.A.A. confirming at least 30% of the cases for each antibody, including a review of discrepant cases. The percentages of CD68, FoxP3, PD-1, LAG-3, TIM-3, GITR, and IDO-positive cells in relation to overall cellularity were determined.21 The percentages were recorded as 0%, 1%, 5%, and then in increments of 10%; the final score was reported as an average of 3 independent scores. Areas of adjacent tissue not involved by tumor as well as areas of sclerosis or necrosis were excluded. To determine the CD20:CD3 and CD4:CD8 ratios, all areas involved by tumor, including any admixed lymphoid follicles, were included. pSTAT3 expression was quantified as the percent of either HRS tumor cells or infiltrating lymphocytes with positive nuclear staining. Statistical comparisons between the EBV+ and EBV− groups were conducted with a 2-sided Wilcoxon rank sum test using the wilcox_test function in the R “coin” package, with distribution set to “exact,” except for pSTAT3 staining, which was evaluated with a 1-sided test aimed at confirming the Th17 cytokine profile observed in EBV− tumors with quantitative reverse transcription polymerase chain reaction (qRT-PCR) testing.
qRT-PCR
Areas of tumor were identified with hematoxylin and eosin staining on neighboring tissue sections in FFPE specimens derived from 21 patients with CHL, including EBV+ (n = 8) and EBV− (n = 13) cases. Tissue was macrodissected by scalpel from 5-μm sections, as described.22 RNA was isolated with the High Pure RNA Paraffin Kit (Roche, Indianapolis, IN), as described.22,23 Seventy-five nanograms of total RNA was reverse transcribed in a 10-μL reaction volume using qScript cDNA SuperMix (Quanta Biosciences, Gaithersburg, MD) per protocol. From each RT reaction, 7.5 μL was preamplified in a total volume of 30 μL using a 14-cycle PCR reaction per PreAmp protocol (Applied Biosystems, Foster City, CA). Fourteen microliters of each preamplification reaction was expanded into a 440-μL total volume reaction mix and added to TaqMan Array Micro Fluidic Cards per protocol (Applied Biosystems) containing triplicate wells for each of 60 candidate immune genes of interest and 4 endogenous control genes, as previously detailed.19 Subsequently, FFPE tumor specimens were analyzed for the expression of 6 candidate genes involved in Th17 and IL-23 pathways, including CD5L, CSF2, EBI3, IL27p28, PRDM1, and RORC. PCR was conducted for 40 cycles. Results were analyzed using the 2−ΔΔCt method24 with the Welch t test and visualized with TIBCO Spotfire Software (Somerville, MA). Undetermined Ct values were assigned a value of 40 for purpose of analysis. Statistical comparisons between the EBV+ and EBV− groups were conducted with a 2-sided test, except for subsequent analysis of the 6 Th17-involved genes, which was conducted with a 1-sided test based on the prior findings that EBV− tumors displayed a Th17 gene expression profile.
Cytokine-induced PD-L1 expression on human immune cells
Peripheral blood mononuclear cells (PBMCs) from normal donors were used to generate immune cell subpopulations, as follows. Monocytes were enriched by negative selection with the Pan Monocyte Isolation Kit (Miltenyi Biotec, San Diego, CA) and were confirmed to be >85% pure by flow cytometry for CD14+ cells. Dendritic cells (DCs) were generated from enriched monocytes by a 3-day culture in 100 U/mL IL-4 and granulocyte-macrophage colony-stimulating factor 200 U/mL. T cells were enriched from PBMCs by negative selection with the Pan T Cell Isolation Kit (Miltenyi) and were confirmed to be >90% pure by flow cytometry for CD3+ cells. T cells were activated by culturing with a combination of plate-bound anti-CD3 (clone OKT3; ATCC, Manassas, VA) and soluble anti-CD28 (clone 28.2; BD Bioscience, San Jose, CA), each at 0.2 μg/mL, for 2 days. B cells were enriched from PBMCs by negative selection (Miltenyi kit); in some experiments, B cells were activated by culturing PBMCs with 200 U/mL IL-4 for 7 days prior to negative selection. EBV-transformed immortal B-cell lines were maintained in suspension culture in RPMI 1640 medium containing 10% fetal calf serum and antibiotics.
To assess the effects of various cytokines on PD-L1 protein expression on the surface of immune cells, cells were cultured in the presence of IL-1a (10 ng/mL), IL-17A (50 ng/mL), IL-23 (50 ng/mL), or IL-27 (50 ng/mL), with or without IFN-γ (50 or 100 U/mL), for 2 days. Recombinant cytokines were purchased from R&D Systems (Minneapolis, MN). Flow cytometry was used to detect cell-surface expression of PD-L1 (mAb MIH1; eBioscience, San Diego, CA) and CD86, with or without cytokine exposure. Gating was performed on CD14+ cells for monocytes, CD11c+ cells for DCs, CD3+ cells for T cells, and CD19+ cells for B cells. Data were acquired on the BD FACSCalibur and analyzed with FlowJo software (v10.2; Treestar, Ashland, OR).
Results
Patient and specimen characteristics
By searching the Johns Hopkins Hospital pathology archives from 2008 to 2014, ∼400 cases of CHL were identified. Approximately 95 cases were diagnosed on excisional biopsy. After review of the diagnostic material and elimination of specimens from HIV-positive patients, 20 EBV− and 12 EBV+ CHLs having sufficient FFPE material for further study were identified (Table 1).
Patients and tumor specimens
| Patient and specimen ID* . | Patient age (y)† . | Sex . | Clinical stage‡ . | Histologic subtype . |
|---|---|---|---|---|
| CHL, EBV− | ||||
| CHL-1§ | 34 | M | IVB | NS |
| CHL-2§ | 9 | M | IIIB | NS |
| CHL-3§ | 22 | F | IIB | NS |
| CHL-4 | 19 | M | IIIBX | NS |
| CHL-5§ | 47 | F | IVA | NS |
| CHL-6 | 60 | F | IVA | NS |
| CHL-7§ | 60 | F | IIIB | NS |
| CHL-8§ | 13 | F | IVB | NS |
| CHL-9 | 16 | M | IIB | NS |
| CHL-10§ | 15 | M | IIIA | NS |
| CHL-11 | 41 | M | IIB | NS |
| CHL-12§ | 19 | M | IIIB | NS |
| CHL-13§ | 14 | M | IIIAS | NS |
| CHL-14 | 36 | F | IIA | NS |
| CHL-15§ | 16 | F | IA | NS |
| CHL-16§ | 12 | M | IIA | NS |
| CHL-17 | 12 | M | IVA | NS |
| CHL-18 | 50 | M | IIA | NS |
| CHL-19§ | 24 | M | IIIA | NS |
| CHL-20§ | 10 | F | IIIB | NS |
| CHL, EBV+ | ||||
| CHL-21§ | 33 | F | IVB | NS |
| CHL-22§ | 66 | F | IA | NS |
| CHL-23§ | 22 | M | IA | NS |
| CHL-24§ | 10 | M | IIB | NS |
| CHL-25§ | 26 | F | IA | MC |
| CHL-26§ | 25 | M | IVB | MC |
| CHL-27 | 55 | M | IVB | Interfollicular |
| CHL-28 | 19 | M | IIA | Interfollicular |
| CHL-29§ | 21 | F | IIA | NS |
| CHL-30 | 39 | M | IA | MC, recurrent‖ |
| CHL-31 | 52 | M | IIIB | NS, recurrent¶ |
| CHL-32§ | 38 | M | IIA | NS, recurrent# |
F, female; M, male; MC, mixed cellularity; NS, nodular sclerosis.
Tumor biopsies were obtained prior to therapy, with the exception of CHL-30, -31, and -32, which were derived from recurrent tumors. All specimens were evaluated with IHC and EBER ISH.
Age at time of biopsy.
According to the modified Ann Arbor staging system.46
Gene expression assessed with qRT-PCR, in 21 specimens from which sufficient material was available.
Recurrent tumor, biopsy obtained 5.5 y after completing multidrug chemotherapy plus radiation therapy.
Recurrent tumor, biopsy obtained 1.7 y after completing combination chemotherapy, rituximab, and tumor vaccine.
Recurrent tumor, biopsy obtained 15 years after completing primary radiation therapy.
Immune cell subsets and expression of immune regulatory pathways in EBV+ vs EBV− CHL
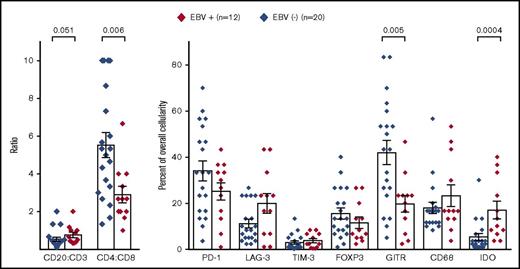
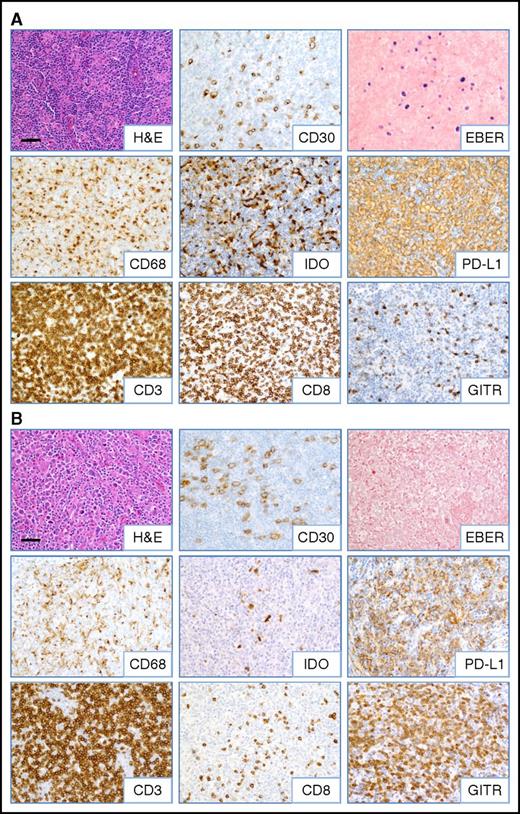
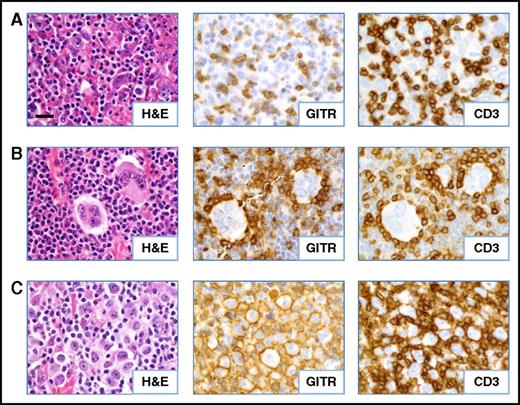
Initially, to characterize the tumor immune microenvironment in EBV+ compared with EBV− CHL, IHC for immune cell subsets and select immune-modulatory molecules was performed (Figures 1 and 2). In general, CHL specimens contained robust immune cell infiltrates. However, EBV+ CHL was associated with a higher proportion of CD20+ B cells compared with CD3+ T cells (P = .051), and among the CD3+ cells, CD8+ cytolytic T cells predominated in EBV+ tumors (P = .006). The IFN-γ–inducible enzyme IDO produced in macrophages, which mediates immunosuppression locally in the tumor microenvironment (TME), was more highly expressed in EBV+ specimens (P = .0004). These findings suggested that EBV+ tumors contained a Th1 cytokine milieu, which was further explored with gene expression profiling as described below. PD-L1 was abundantly expressed by HRS tumor cells as well as infiltrating immune cells in both EBV+ and EBV− CHL and could not be reliably quantified (Figures 2A-B). Furthermore, we did not observe significant differences in the expression of CD68 (macrophages), FoxP3 (regulatory T cells), or the immune checkpoint receptors PD-1, LAG-3, and TIM-3 between the 2 groups of CHL specimens. However, the T-cell costimulatory receptor glucocorticoid–induced TNFR-related protein (GITR) was significantly overexpressed in EBV− CHL (P = .005) and was found in distinct and diverse patterns, which included immune cell and HRS cell expression (Figure 3). A potential functional role for GITR expressed on HRS cells is unknown.
Immune cell subsets and expression of immunoregulatory molecules in EBV+compared with EBV−CHL specimens. Markers were detected by IHC and quantified as detailed in “Methods.” Diamond symbols indicate average values for triplicate scores for an individual tumor specimen (see “Methods”). Bars indicate mean values and standard error of the mean. P values from the Wilcoxon rank sum test were >.1 unless indicated.
Immune cell subsets and expression of immunoregulatory molecules in EBV+compared with EBV−CHL specimens. Markers were detected by IHC and quantified as detailed in “Methods.” Diamond symbols indicate average values for triplicate scores for an individual tumor specimen (see “Methods”). Bars indicate mean values and standard error of the mean. P values from the Wilcoxon rank sum test were >.1 unless indicated.
Inflammatory composition of EBV+and EBV−CHL. Representative images from (A) EBV+ and (B) EBV− CHL (specimens CHL-23 and CHL-12, respectively; see Table 1) are shown. HRS tumor cells are identified by anti-CD30 IHC and EBER ISH. A predominance of CD8+ T cells and IDO+ histiocytes was observed in EBV+ cases, whereas increased GITR+ lymphocytes were seen in EBV− cases. Robust CD3+ T-cell infiltrates and PD-L1 expression on HRS cells and infiltrating immune cells were observed regardless of EBV status. Slides were imaged on an Olympus BX46 microscope with an Olympus DP72 camera at ×200 magnification with an aperture of 0.5, and Olympus cellSens Standard 1.5 image acquisition software was used. Bar, 50 μm. H&E, hematoxylin and eosin.
Inflammatory composition of EBV+and EBV−CHL. Representative images from (A) EBV+ and (B) EBV− CHL (specimens CHL-23 and CHL-12, respectively; see Table 1) are shown. HRS tumor cells are identified by anti-CD30 IHC and EBER ISH. A predominance of CD8+ T cells and IDO+ histiocytes was observed in EBV+ cases, whereas increased GITR+ lymphocytes were seen in EBV− cases. Robust CD3+ T-cell infiltrates and PD-L1 expression on HRS cells and infiltrating immune cells were observed regardless of EBV status. Slides were imaged on an Olympus BX46 microscope with an Olympus DP72 camera at ×200 magnification with an aperture of 0.5, and Olympus cellSens Standard 1.5 image acquisition software was used. Bar, 50 μm. H&E, hematoxylin and eosin.
Patterns of GITR expression observed in CHL. Serial FFPE tumor sections were stained as indicated. (A) Diffuse GITR expression on infiltrating T lymphocytes (case CHL-2). (B) Rosettes of GITR+ T cells surrounding HRS tumor cells (case CHL-19). (C) GITR expression on the plasma membrane of a subset of the HRS cells (case CHL-7). All cases shown are EBV− specimens. Slides were imaged at ×500 magnification with an aperture of 0.9. Bar, 20 μm.
Patterns of GITR expression observed in CHL. Serial FFPE tumor sections were stained as indicated. (A) Diffuse GITR expression on infiltrating T lymphocytes (case CHL-2). (B) Rosettes of GITR+ T cells surrounding HRS tumor cells (case CHL-19). (C) GITR expression on the plasma membrane of a subset of the HRS cells (case CHL-7). All cases shown are EBV− specimens. Slides were imaged at ×500 magnification with an aperture of 0.9. Bar, 20 μm.
Distinct gene expression profiles associated with EBV+ vs EBV− CHL
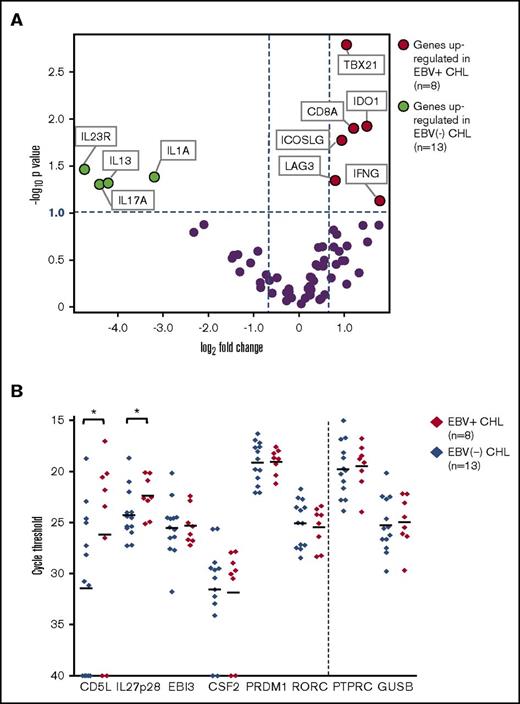
EBV+ CHLs were compared with EBV− CHLs for the expression of genes involved in innate and adaptive immunity and in checkpoint pathways, employing a multiplex array of 60 candidate genes as previously described.19Among them, 10 genes were found to be differentially expressed (fold change magnitude ≥1.7 and P value ≤.10) when normalized to either PTPRC (CD45, pan leukocyte marker) or GUSB (β-glucuronidase) (Figure 4A; supplemental Table 1). In particular, genes considered to be hallmarks of Th1 immune responses were found to be overexpressed in the EBV+ TME, including IFNG (interferon-γ), CD8A (CD8 α chain), TBX21 (T-box transcription factor Tbet regulating IFNG expression), and LAG3 (coinhibitory receptor on activated T cells). There was also a trend toward overexpression of PRF1, encoding the cytolytic effector molecule perforin 1, in EBV+ tumors (fold change magnitude 3.4 or 3.0, P = .13 or .11, when normalized to PTPRC or GUSB, respectively). These findings suggested an association between EBV+ CHL and an inflamed TME characterized by activated IFN-γ–secreting CD8+ T cells and were consistent with IHC results showing an increased proportion of CD8+ vs CD4+ T cells in EBV+ CHL (Figure 1). Also, consistent with IHC results, EBV+ tumors overexpressed the IDO1 gene.
Analysis of expression of selected immune genes in EBV+vs EBV−CHL. (A) Expression of 60 candidate immune-related genes, assessed with multiplex qRT-PCR. Horizontal dotted line, P value = .10, determined with a 2-sided Welch t test. Vertical dotted lines, 1.7-fold difference in expression magnitude, comparing EBV+ vs EBV− Hodgkin lymphomas (n = 8 and n = 13, respectively). Data are normalized to PTPRC (CD45, pan leukocyte marker). Similar results were obtained with GUSB normalization (see supplemental Table 1). (B) Expression of select genes involved in the Th17 pathway, detected with qRT-PCR in EBV+ and EBV− CHL specimens. The y-axis represents cycle threshold (Ct); lower values indicate greater gene expression. Gene expression values with Ct = 40 were considered to be undetectable. Each symbol identifies the average of triplicate PCR reactions for a distinct tumor specimen. Horizontal bars, mean values. *Genes with P value ≤.10 and fold change ≥2 when Ct results were normalized to expression of either PTPRC or GUSB (see supplemental Table 2). P values determined with a 1-sided Welch t test. Results visualized with GraphPad software (La Jolla, CA). CD5L and IL27p28 were significantly overexpressed in EBV+ CHL.
Analysis of expression of selected immune genes in EBV+vs EBV−CHL. (A) Expression of 60 candidate immune-related genes, assessed with multiplex qRT-PCR. Horizontal dotted line, P value = .10, determined with a 2-sided Welch t test. Vertical dotted lines, 1.7-fold difference in expression magnitude, comparing EBV+ vs EBV− Hodgkin lymphomas (n = 8 and n = 13, respectively). Data are normalized to PTPRC (CD45, pan leukocyte marker). Similar results were obtained with GUSB normalization (see supplemental Table 1). (B) Expression of select genes involved in the Th17 pathway, detected with qRT-PCR in EBV+ and EBV− CHL specimens. The y-axis represents cycle threshold (Ct); lower values indicate greater gene expression. Gene expression values with Ct = 40 were considered to be undetectable. Each symbol identifies the average of triplicate PCR reactions for a distinct tumor specimen. Horizontal bars, mean values. *Genes with P value ≤.10 and fold change ≥2 when Ct results were normalized to expression of either PTPRC or GUSB (see supplemental Table 2). P values determined with a 1-sided Welch t test. Results visualized with GraphPad software (La Jolla, CA). CD5L and IL27p28 were significantly overexpressed in EBV+ CHL.
In contrast to EBV+ tumors, a gene profile associated with Th17-mediated immunity was overexpressed in EBV− CHL. Specifically, the genes IL17A (interleukin-17A), IL1A (interleukin-1 α), and IL23R (interleukin-23 receptor) were significantly upregulated. Because the molecules they encode may be associated with procarcinogenic Th17 inflammation as well as autoimmunity,25,26 we investigated additional genes associated with Th17/IL-23 axis, which were not included in our original assessment (Figure 4B; supplemental Table 2). Among them, CD5L, a metabolic regulator that restrains pathogenic Th17 cells, and IL27p28, encoding a subunit of IL-27 that promotes Th1 and inhibits Th17 responses,27 were found to be upregulated in EBV+ tumors. This result was consistent with the observed upregulation of Th1 markers and down-modulation of Th17 markers in EBV+ compared with EBV− CHLs. Thus, the immune TMEs of EBV+ vs EBV− CHLs were characterized by dichotomous gene expression profiles, illustrating proinflammatory Th1 vs pathogenic Th17 profiles, respectively.
EBV− tumors also had increased expression of the gene encoding IL-13, which is not a Th17 cytokine but rather a prototypical Th2 cytokine, which stimulates antibody-mediated but inhibits CD8-mediated immunity.28 IL-13 has also been reported to be expressed by HRS cells and to provide autocrine growth stimulation29 ; its role in modulating the character of the TME in general is unclear, because no other Th2-associated genes were upregulated in either EBV+ or EBV− CHL in our study. Markers characteristic of T follicular helper cells, which have been proposed to underlie the pathophysiology of some lymphomas, including IL-21, ICOS, and PD-1,30 were not differentially expressed in EBV+ compared with EBV− CHLs.
Effects of Th17-modulating cytokines on PD-L1 protein expression
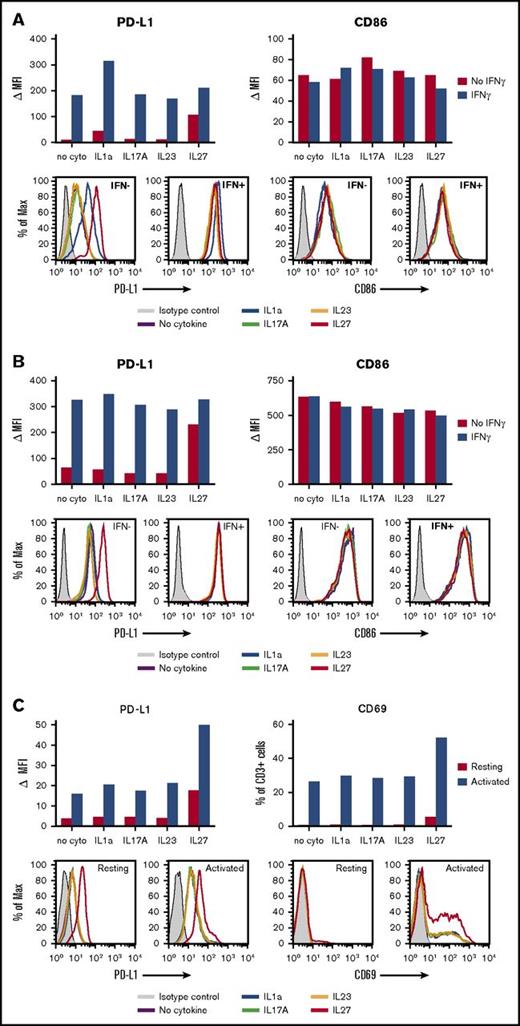
The CHL specimens in this study displayed robust levels of the immunosuppressive ligand PD-L1 on HRS tumor cells and/or infiltrating immune cells, as detected at the protein level with IHC (Figure 2). Consistent with this observation, gene expression analysis failed to detect significant differences in CD274 (PD-L1) expression between EBV+ and EBV− tumors. Furthermore, although IFN-γ, known to be a major driver of PD-L1 expression by tumor and normal cells, was detected by qRT-PCR in 20 of 21 specimens tested, there was increased expression in EBV+ CHL (Figure 4A; supplemental Table 1). To explore whether other cytokines detected in EBV+ or EBV− CHL at the mRNA level could modulate PD-L1 expression on tumor or immune cells, we exposed enriched human B cells (fresh, IL-4-activated, or EBV-transformed), T cells, monocytes, and DCs to recombinant IL-1a, IL-17A, IL-23, or IL-27 in vitro, in the absence or presence of IFN-γ. Cell-surface PD-L1 expression was then quantified with flow cytometry. As shown in Figure 5, IL-27 increased PD-L1 expression on monocytes, DCs, and resting or activated T lymphocytes, compared with cells cultured without cytokines; IFN-γ induced PD-L1 on monocytes and DCs as expected (Figures 5A-B), but we found no further augmentation when IL-27 was combined with IFN-γ. The induction of PD-L1 expression on human monocyte-derived DCs by IL-27 has been previously reported.31 In contrast, IL-1a specifically increased PD-L1 expression only on monocytes (Figure 5A); when combined with IFN-γ, IL-1a further augmented PD-L1 expression on monocytes. IL-17A and IL-23 did not appear to influence PD-L1 expression on monocytes, DCs, or T cells in these experiments. None of the cytokines tested appeared to influence PD-L1 expression on resting, IL4-activated, or EBV-transformed B cells, which generally expressed low levels of PD-L1, nor did they affect the viability or proliferation of these cells over the 2-day incubation period (data not shown). Taken together, these results suggest that beyond the known effects of IFN-γ in promoting PD-L1 expression on tumor cells, monocytes, and DCs, additional cytokines characteristic of EBV+ or EBV− CHLs, IL-27 and IL-1a, respectively, can also enhance PD-L1 expression on distinct immune cell subsets and hence may influence immunosuppression in the TME.
Effects of IL-1a, IL-17A, IL-23, and IL-27 on PD-L1 expression by human immune cells. Enriched cell populations were cultured in the presence of cytokines for 2 days; then, PD-L1 cell-surface protein expression was detected by flow cytometry (see “Methods”). (A) Monocytes were exposed to cytokines in the absence or presence of IFN-γ. IL-1a- and IL-27–enhanced PD-L1 expression in the absence of IFN-γ. IL-1a, but not IL-27, further increased PD-L1 expression in the presence of IFN-γ. In contrast, no cytokine significantly affected expression of CD86 (B7.2) on monocytes. Results are representative of 4 of 4 normal donors. (B) DCs were exposed to cytokines in the absence or presence of IFN-γ. IL-27 increased PD-L1 expression in the absence of IFN-γ, but did not further augment expression in the presence of IFN-γ. In contrast, no effects were seen on CD86 expression in the same experiment. Results are representative of 2 of 2 donors. (C) CD3+ T cells that were resting or activated with anti-CD3/CD28 were exposed to cytokines. IL-27 increased PD-L1 expression on both resting and activated T cells. Expression of CD69, an early T-cell activation marker, was also increased by exposure to IL-27. Results are representative of 2 of 2 donors. MAX, % of maximum cell count; MFI, mean fluorescence of intensity; ∆MFI, MFI of isotype control was subtracted from that of specific staining.
Effects of IL-1a, IL-17A, IL-23, and IL-27 on PD-L1 expression by human immune cells. Enriched cell populations were cultured in the presence of cytokines for 2 days; then, PD-L1 cell-surface protein expression was detected by flow cytometry (see “Methods”). (A) Monocytes were exposed to cytokines in the absence or presence of IFN-γ. IL-1a- and IL-27–enhanced PD-L1 expression in the absence of IFN-γ. IL-1a, but not IL-27, further increased PD-L1 expression in the presence of IFN-γ. In contrast, no cytokine significantly affected expression of CD86 (B7.2) on monocytes. Results are representative of 4 of 4 normal donors. (B) DCs were exposed to cytokines in the absence or presence of IFN-γ. IL-27 increased PD-L1 expression in the absence of IFN-γ, but did not further augment expression in the presence of IFN-γ. In contrast, no effects were seen on CD86 expression in the same experiment. Results are representative of 2 of 2 donors. (C) CD3+ T cells that were resting or activated with anti-CD3/CD28 were exposed to cytokines. IL-27 increased PD-L1 expression on both resting and activated T cells. Expression of CD69, an early T-cell activation marker, was also increased by exposure to IL-27. Results are representative of 2 of 2 donors. MAX, % of maximum cell count; MFI, mean fluorescence of intensity; ∆MFI, MFI of isotype control was subtracted from that of specific staining.
STAT3 activation in tumor infiltrating lymphocytes distinguishes EBV− from EBV+ CHL
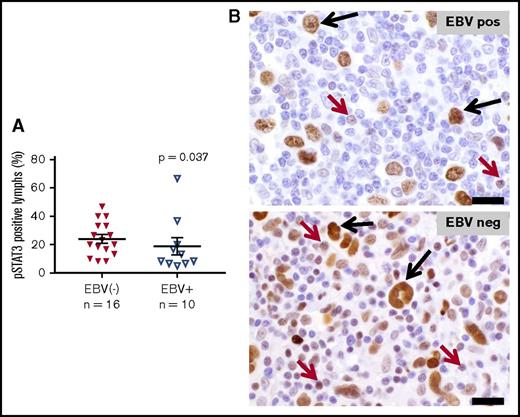
Activation of the STAT3 transcription factor has been shown to be required for generating Th17 responses in murine models of inflammation and cancer.32,33 Constitutive STAT3 activation has also been reported in HRS cells, in situ and in culture.13,34 To investigate whether the upregulated Th17 cytokine profile observed in EBV− CHL correlated with STAT3 activation in the lymphocytes infiltrating these tumors, IHC for pSTAT3 was performed. As shown in Figure 6, nuclear expression of pSTAT3 was observed in HRS tumor cells at similar levels in both EBV− and EBV+ CHL. In contrast, pSTAT3 was significantly overexpressed specifically in tumor-associated lymphocytes in EBV− CHL, consistent with the selective Th17 cytokine profile characterizing these tumors.
Expression of phosphorylated STAT3 in EBV+vs EBV−CHL. Nuclear pSTAT3 expression was detected with IHC. HRS tumor cells in both EBV+ and EBV− specimens expressed pSTAT3 robustly at equivalent levels (P value not significant). (A) However, infiltrating lymphocytes in EBV− specimens overexpressed pSTAT3, consistent with gene expression profiling results (P = .037, by a 1-sided Wilcoxon rank sum test). Horizontal black lines indicate the mean and the mean ± standard error of the mean. (B) Representative photomicrographs from EBV+ and EBV− CHL specimens stained with anti-pSTAT3. Black arrows, HRS tumor cells; red arrows, lymphocytes. Slides were imaged at ×500 magnification with an aperture of 0.9. Bar, 20 μm.
Expression of phosphorylated STAT3 in EBV+vs EBV−CHL. Nuclear pSTAT3 expression was detected with IHC. HRS tumor cells in both EBV+ and EBV− specimens expressed pSTAT3 robustly at equivalent levels (P value not significant). (A) However, infiltrating lymphocytes in EBV− specimens overexpressed pSTAT3, consistent with gene expression profiling results (P = .037, by a 1-sided Wilcoxon rank sum test). Horizontal black lines indicate the mean and the mean ± standard error of the mean. (B) Representative photomicrographs from EBV+ and EBV− CHL specimens stained with anti-pSTAT3. Black arrows, HRS tumor cells; red arrows, lymphocytes. Slides were imaged at ×500 magnification with an aperture of 0.9. Bar, 20 μm.
Discussion
Because the PD-1/PD-L1 immunosuppressive pathway acts primarily in peripheral tissues, intratumoral expression of PD-L1 has been investigated as a potential marker predicting the responsiveness of individual tumors or tumor types to drugs blocking this pathway.35 Hodgkin lymphomas are known to express PD-L1 constitutively on HRS tumor cells regardless of EBV status. This phenomenon is driven by chromosome 9 alterations, which induce JAK/STAT signaling and STAT3 phosphorylation, or by EBV-encoded gene products in the case of EBV+ CHL.15,36 PD-L1 is also abundantly expressed on immune cells infiltrating CHL, including macrophages, DCs, and lymphocytes, presumably through cytokine-induced mechanisms.36 These findings provided a strong rationale to explore anti-PD-1 therapy in refractory CHL, leading to the demonstration of objective response rates exceeding 60% and culminating in US Food and Drug Administration approval.13,14 However, some CHLs are resistant to anti-PD-1 monotherapy, or they relapse after an initial response, raising the question of whether more effective anti-PD-1-containing treatment combinations could be rationally devised based on immunologic and gene expression analyses of the CHL TME.22,37 For example, although the LAG3 gene was overexpressed in EBV+ CHL, every tumor in our study expressed LAG-3 protein on ≥1% of cells by IHC (Figure 1), supporting current clinical testing of the combination of anti-PD-1 and anti-LAG-3 in CHL (NCT02061761). In addition, because the EBV residing in some CHLs is strongly immunogenic, we hypothesized that differences in the immune TME of EBV+ vs EBV− CHL would have specific implications for designing combination treatment regimens. Our finding that IDO is coexpressed along with PD-L1 in EBV+ CHL supports the notion that combining PD-1 pathway blockade with IDO inhibitors may be a particularly valuable strategy in EBV+ tumors.
In the current study, we have demonstrated a dichotomous cellular and cytokine immune milieu in EBV+ vs EBV− CHL. EBV+ tumors displayed a Th1 profile, with increased infiltration of CD8+ T cells and coordinate expression of the transcription factor Tbet (TBX21), which controls IFN-γ expression; of IFN-γ itself; and of the IFN-γ–inducible immunosuppressive enzyme IDO. The Th1 signature in EBV-associated CHL confirms a previous report demonstrating enrichment in genes characteristic of Th1 and antiviral responses.12 In contrast, EBV− tumors manifested a Th17 profile and engagement of the IL-23/IL-17 axis. Th17-mediated inflammation can be productive in eliminating pathogens, or can be pathogenic in autoimmunity and carcinogenesis.38-40 In the current study, EBV− CHL specimens overexpressed the IL-23 receptor, a required component for IL-23–driven STAT3 activation in T cells and a hallmark of the pathogenic Th17 phenotype.27,41 They also overexpressed genes encoding the proinflammatory cytokines IL-17A (the canonical Th17 cytokine) and IL-1a. The TNF receptor family member GITR, which costimulates T effector cells as well as Tregs, was significantly overexpressed on lymphocytes infiltrating EBV− CHL, by IHC analysis; interestingly, GITR ligand has been implicated in promoting Th17-associated autoimmune arthritis.42 In contrast, EBV+ CHL overexpressed CD5L and IL27p28, principal factors mitigating against IL17-associated pathogenic inflammation.43 Although larger studies are warranted, these findings support the notion that the cytokine milieu of EBV+ CHL, in addition to promoting Th1 responses, actively inhibits Th17 skewing.
Importantly, we found that nuclear expression of pSTAT3 was significantly increased in lymphocytes infiltrating EBV− CHL, confirming sustained intratumoral activation of this key Th17-associated transcription factor. These findings raise the possibility that IL-17–driven inflammation, which can be carcinogenic, might also play a role in tumor maintenance. Indeed, Th17 responses have been shown to promote cancer growth in some murine models and are associated with worse prognosis in human colon cancer.44,45 If so, then blocking IL-17A or IL-23/IL-23R might confer therapeutic benefit in EBV− CHL. mAbs blocking IL-17A (secukinumab, ixekizumab) or IL-23 (ustekinumab) are currently in clinical use for patients with moderate to severe psoriasis, and additional drugs blocking the IL-23/IL-17 pathway are in testing for a variety of autoimmune disorders, including rheumatoid arthritis and Crohn disease.27,39
Of note, none of the 32 CHL patients whose tumors were characterized in the current study received anti-PD-1 therapy. Therefore, the preliminary results presented here warrant further investigation to address potential correlations of tumor response or resistance with EBV status, and with expression of a pathogenic Th17 profile, in CHL patients receiving anti-PD-1 monotherapy. If confirmatory, such studies would support incorporating anti-IL-23/IL-17 drugs into clinical trials of combination therapy with drugs blocking the prominently expressed PD-1/PD-L1 pathway in CHL, as a means of enhancing therapeutic efficacy in EBV− tumors.
The full-text version of this article contains a data supplement.
Acknowledgments
The authors thank Hao Wang (Johns Hopkins University) for advice on statistical analyses, Shaoguang Wu and Xinqun Wu (Johns Hopkins University) for advice on methods for pSTAT IHC, Muniza Uddin (Johns Hopkins University) for validation and optimization of pSTAT3 IHC, Jessica Esandrio (Johns Hopkins University) for tumor specimen handling, and Darren Locke and Xi-Tao Wang (Bristol-Myers Squibb) for helpful discussions regarding GITR IHC.
This study was supported by Bristol-Myers Squibb (S.L.T., D.M.P., and R.F.A.), the Johns Hopkins Bloomberg–Kimmel Institute for Cancer Immunotherapy (R.A.A., J.M.T., D.M.P., and S.L.T.), and the National Institutes of Health, National Cancer Institute (R01 CA142779) (J.M.T., D.M.P., and S.L.T.).
Authorship
Contribution: All authors drafted and approved the manuscript; A.S.D., M.L.A., R.A.A., J.M.T., A.K.M., S.C., T.L.M., N.A.P., H.X., and A.O. developed experimental methods and collected and analyzed the data; A.E.B. analyzed IHC and gene expression data; and S.L.T., D.M.P., and R.F.A. designed and oversaw all aspects of this study.
Conflict-of-interest disclosure: R.A.A. receives research support from Bristol-Myers Squibb and Five Prime Therapeutics and serves on an advisory board for Merck. J.M.T. receives research funding from Bristol-Myers Squibb and serves on advisory boards for Bristol-Myers Squibb, Merck, and AstraZeneca. A.K.M. receives research funding from Bristol-Myers Squibb. D.M.P. receives research grants from Bristol-Myers Squibb; consults for Five Prime Therapeutics, GlaxoSmithKline, Jounce Therapeutics, MedImmune, Pfizer, Potenza Therapeutics, and Sanofi; holds stock options in Jounce and Potenza; and is entitled to receive patent royalties through his institution from Bristol-Myers Squibb and Potenza. S.L.T. receives research funding from Bristol-Myers Squibb. R.F.A. serves on an advisory board for Bristol-Myers Squibb. The remaining authors declare no competing financial interests.
Correspondence: Richard F. Ambinder, Johns Hopkins University School of Medicine, 1650 Orleans St, CRB1 Room 389, Baltimore, MD 21287; e-mail: rambind1@jhmi.edu; and Suzanne L. Topalian, Johns Hopkins University School of Medicine, 1550 Orleans St, CRB2 Room 508, Baltimore, MD 21287; e-mail: stopali1@jhmi.edu.
References
Author notes
A.S.D. and M.L.A. contributed equally to this study.

