Key Points
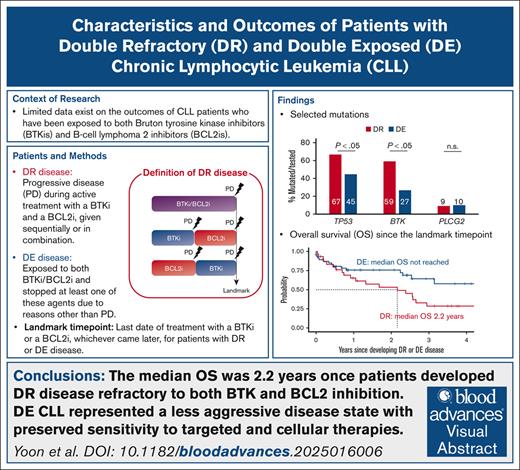
The median OS of patients with DR CLL whose disease progressed during BTK and BCL2 inhibition was 2.2 years.
DE CLL represented a less aggressive disease state, with preserved sensitivity to targeted and cellular therapies.
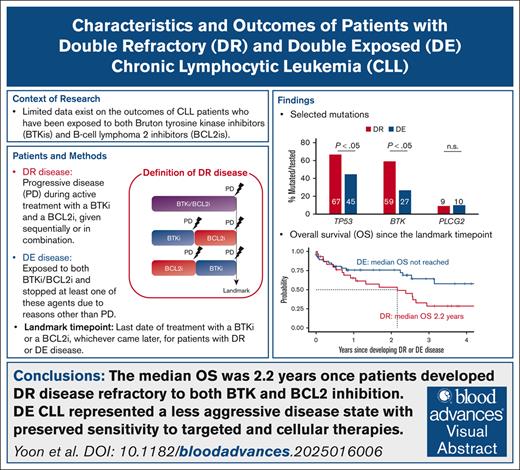
Visual Abstract
We analyzed the characteristics and outcomes of 95 patients with chronic lymphocytic leukemia (CLL) after Bruton tyrosine kinase inhibitor (BTKi) and B-cell lymphoma 2 inhibitor (BCL2i) failure. To clearly distinguish sensitivity and resistance to the targeted treatment classes, we defined double refractory (DR) CLL when progressive disease occurred during active treatment with a BTKi and a BCL2i, given sequentially or in combination, and double exposed (DE) disease when treatment with either or both of these agents was discontinued due to reasons other than progression. Thirty patients (31.6%) had DR CLL, and 65 (63.2%) had DE CLL. The DR group more frequently had unmutated immunoglobulin gene heavy chain variable (97%), TP53 aberration (73%), and BTK mutations (59%) than the DE group (75%, 46%, and 27%, respectively). The median number of total lines of therapy was 6 for DR and 3 for DE. Nearly all DR patients (97%) required subsequent therapy after developing DR CLL. The most commonly used treatment was noncovalent BTKis (34%), followed by concurrent covalent BTKi and BCL2i (28%) and CD19 chimeric antigen receptor-modified T cells (24%). Treatment for DE CLL was less frequently observed (26%). The median overall survival (OS) was 2.2 years once DR developed, despite the frequent initial responses to noncovalent BTKis or cellular therapy in the cohort. Patients with DE CLL demonstrated favorable survival (median OS not reached) and durable response to subsequent therapy.
Introduction
Targeting Bruton tyrosine kinase (BTK) or B-cell lymphoma 2 (BCL2) with small molecules has transformed the care of patients with chronic lymphocytic leukemia (CLL) over the past decade. However, the feasibility of long-term (>10 years) disease control remains unclear with established targeted therapy regimens. Ten-year follow-up of patients with CLL treated with the BTK inhibitor (BTKi) ibrutinib revealed low rates of undetectable minimal residual disease (uMRD; <5% after 5 years of continuous treatment with ibrutinib) and continued occurrence of disease progression throughout follow-up.1,2 Fixed-duration combination therapy with the BCL2 inhibitor (BCL2i) venetoclax and an anti-CD20 monoclonal antibody can achieve high rates of uMRD, particularly in treatment-naïve CLL.3,4 Combining BTKi and BCL2i with4-7 or without CD20 monoclonal antibody8-11 can also achieve deep responses. Nevertheless, most patients, including those who achieve uMRD with BCL2i-containing regimens, experience subsequent regrowth of CLL, leading to disease progression.5,12 The reported median progression-free survival (PFS) is approximately 9 years for BTKi monotherapy1 and 6 years for venetoclax and obinutuzumab for older adults with CLL.12 These data suggest that patients with a life expectancy ≥10 years would require ≥2 lines of targeted therapy in their lifetime. PFS is substantially shorter for patients with high-risk CLL,12-14 who most likely require multiple lines of targeted therapy.
Limited data exist on the outcome and optimal management of CLL after BTKi and BCL2i failure. Several challenges limit the investigation of long-term outcomes after targeted therapy failure. First, prospective clinical trials rarely capture the types and outcomes of subsequent therapies once study drugs are discontinued. Second, treatment failure encompasses heterogeneous clinical scenarios that require a comprehensive and longitudinal review of treatment history to differentiate refractory disease from treatment-sensitive disease. Third, CLL registries and real-world databases currently have limited numbers of patients and follow-up after BTKi/BCL2i failure, which is attributable to the fact that regulatory approval of targeted therapies in CLL occurred in the past 10 years. Specifically, the US Food and Drug Administration approved the first-generation BTKi ibrutinib for CLL in 2014 and the BCL2i venetoclax in 2016. Given that targeted therapy has largely replaced traditional chemoimmunotherapy (CIT) in recent years, the number of patients experiencing BTKi/BCL2i failure will only increase.
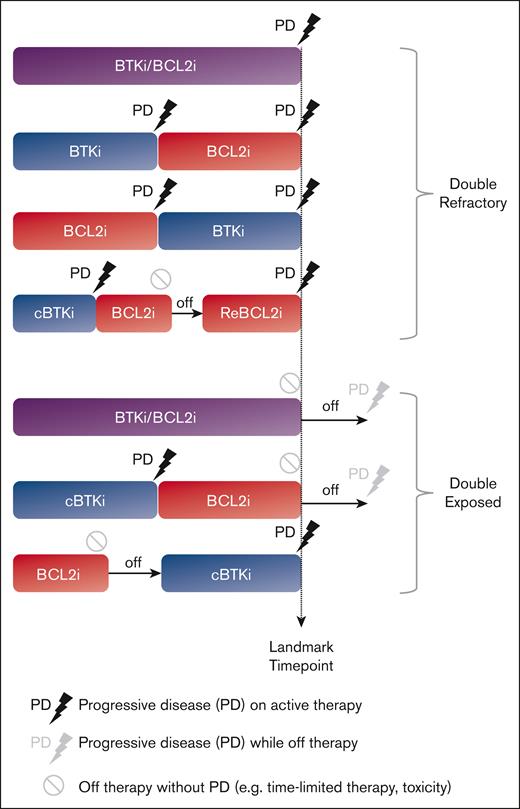
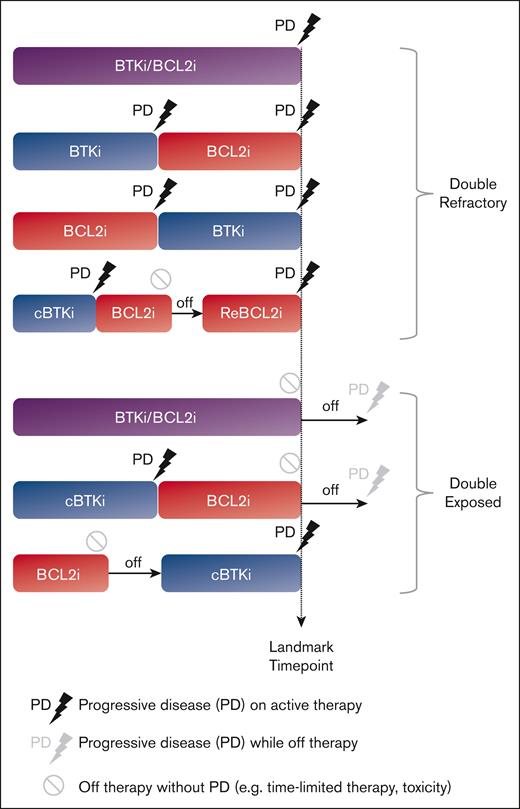
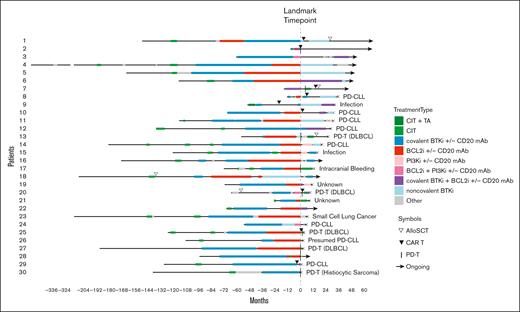
To clearly define the clinical and molecular characteristics of patients with BTKi/BCL2i failure, we conducted a retrospective analysis of data derived from a clinical setting in which targeted agents were accessible since 2011 through clinical trials, and US Food and Drug Administration–approved agents were rapidly incorporated into practice. We defined double refractory (DR) CLL when progressive disease (PD) occurred during active treatment with BTKi and BCL2i, given sequentially or in combination (Figure 1), consistent with prior definitions.15 We defined double exposed (DE) CLL as discontinuation of BTKi and/or BCL2i for reasons other than PD; such scenarios included treatment intolerance, patient preference, and completion of time-limited therapy.
Methods
Patient selection
This retrospective review of the institutional CLL database was conducted under the institutional review board–approved protocol, in accordance with the Declaration of Helsinki. Clinical data and biospecimens were collected for consenting patients. We assigned eligible patients to DR and DE CLL cohorts based on prior treatment history and refractoriness to active treatment with BTKis and/or BCL2is as described by Lewis et al.15 Specifically, we used a stringent definition of refractory CLL, which referred to PD during active therapy. Patients with PD events during the off-treatment period were assigned to the DE group, because these diseases demonstrated sensitivity to re-treatment with targeted therapy in other studies.16,17 Patients who progressed on one targeted treatment class (single refractory) were also assigned to the DE group, provided they had been exposed to the second targeted treatment class. We defined the landmark time point when DR disease required subsequent therapy due to PD or when DE disease required treatment cessation for reasons other than PD. Both PD with CLL (PD-CLL) and PD with histologic transformation (PD-T) identified after the landmark time point were captured as PD events. Patients who developed PD-T before BTKi and BCL2i exposure were excluded from the analysis even if they were subsequently exposed to both targeted treatment classes.
Testing of prognostic and molecular markers
We followed established guidelines for testing of immunoglobulin gene heavy chain variable region gene (IGHV) mutation status,18 fluorescence in situ hybridization (FISH),19 and cytogenetics using blood and/or bone marrow samples.20 An 88-gene targeted next-generation sequencing (NGS) panel from a Clinical Laboratory Improvement Amendments–certified laboratory was applied to available peripheral blood and/or bone marrow samples using methods previously described.21 The lower limit of detection for the NGS panel was 5 unique molecules per nucleotide, equivalent to 1% variant allele frequency (VAF) for loci with >500× coverage and 0.3% VAF for those with >2000× coverage. The panel included known CLL driver genes such as TP53, ATM, NOTCH1, SF3B1, FBXW7, MYD88, and XPO1, as well as BTK and PLCG2. BCL2 sequencing was not included in the panel. BTK and PLCG2 sequencing was incorporated into the panel in November 2019.
Statistical analysis
The Kaplan-Meier method was used to estimate time to first treatment since CLL diagnosis (TT1T), time to next CLL treatment or death (TTNT-D) from the landmark time point, and overall survival (OS) from CLL diagnosis or the landmark time point. Deaths were excluded from events from the TT1T analyses. TTNT-D was defined by deaths or the initiation of the next CLL treatment, whichever occurred first. The subdistribution hazard model was used to estimate hazards between the DR and the DE groups. Analyses were performed using R version 4.4.1.
Results
Patient characteristics
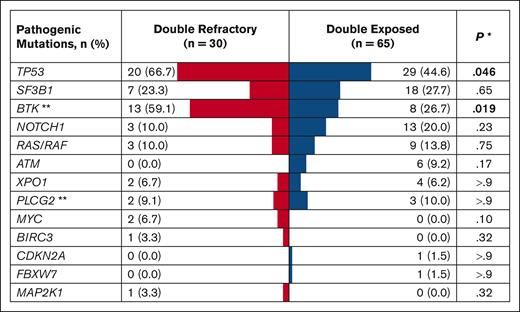
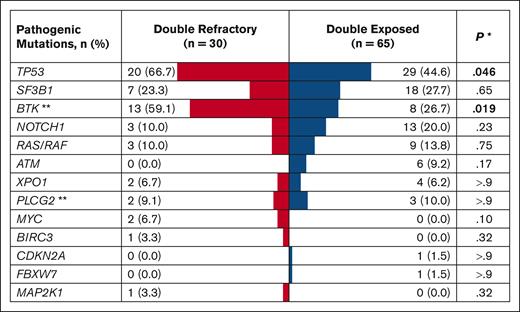
Of 1024 patients with CLL in the database, 483 received at least 1 line of CLL therapy. A review of medical records of all treated patients identified 30 with DR and 65 with DE disease (Table 1). The median age at CLL diagnosis was 57 years for the DR group and 58 years for the DE group. Both groups had a male predominance (73.3% in the DR group; 64.6% in the DE group) and a high proportion of patients with unmutated IGHV (96.7% of evaluable patients in DR and 84.5% in DE). The most common hierarchical FISH category was deletion 17p (40.0% in DR; 27.7% in DE), followed by normal FISH (26.7% in DR; 21.5% in DE) in both groups. TP53 aberration with TP53 mutation and/or deletion 17p was more commonly found in the DR group (73.3%) than the DE group (46.2%; P = .013). The frequency of TP53 (66.7% in DR; 44.6% in DE) and BTK (59.1% in DR; 26.7% in DE) mutations was significantly higher in the DR group than in the DE group (Figure 2). Similarly, complex (≥3 abnormalities) and highly complex karyotypes (≥5 abnormalities) were more frequently found in the DR group (76.9% and 57.7%) than in the DE group (56.4% and 38.2%, respectively), although these differences did not meet statistical significance. Although BCL2 was not included in the NGS panel, one patient in the DR group had a BCL2 mutation on a separate targeted sequencing performed at a Clinical Laboratory Improvement Amendments–certified laboratory.
Mutational landscape of DR and DE disease. The table shows mutations found in ≥5% of the study population or those with known pathogenic roles in CLL and histologic transformation (eg, CDKN2A, MAP2K1). Mutations detected at any time point during the disease course were included in this analysis. ∗Pearson χ2 test or Fisher exact test. ∗∗BTK and PLCG2 sequencing was performed in 22 DR and 30 DE patients.
Mutational landscape of DR and DE disease. The table shows mutations found in ≥5% of the study population or those with known pathogenic roles in CLL and histologic transformation (eg, CDKN2A, MAP2K1). Mutations detected at any time point during the disease course were included in this analysis. ∗Pearson χ2 test or Fisher exact test. ∗∗BTK and PLCG2 sequencing was performed in 22 DR and 30 DE patients.
In a multivariable logistic regression analysis, unmutated IGHV (odds ratio, 10.1; 97.5% confidence interval [CI], 1.5-210.0) and an increasing number of prior lines of therapy (LOTs; odds ratio, 1.6; 97.5% CI, 1.1-2.4) were significantly associated with DR disease (both P < .05). The risk of DR disease increased by 63% with each advancing LOT. TP53 aberration had a marginal association with DR disease without reaching statistical significance (P = .08). Complex (≥3) or highly complex karyotypes (≥5) were not associated with the risk of DR disease.
Treatment characteristics leading up to DR and DE disease
The median number of total LOTs was 6 for DR and 3 for DE (Table 2). The median prior LOTs before the landmark time point was 4 (range, 1-8) for the DR group and 3 (range, 0-7) for the DE group. Although most patients received targeted therapies for the treatment of relapsed or refractory CLL, approximately a third of patients in each group (9 patients [30%] in DR and 24 patients [36.9%] in DE) received targeted therapy as their initial therapy without prior exposure to chemoimmunotherapy (CIT). The most commonly used treatment class besides covalent BTKis (cBTKis) and BCL2is was CIT for both groups (83.3% in DR; 64.6% in DE), followed by noncovalent BTKis (ncBTKis; 43.3%) for the DR group and phosphoinositide 3-kinase inhibitors (PI3Kis, 27.7%) for the DE group. The two most frequently used CIT regimens were bendamustine and rituximab (DR, n = 13 [43.3%]; DE, n = 17 [26.2%]) and fludarabine, cyclophosphamide, and rituximab (DR, n = 7 [23.3%]; DE, n = 28 [43.1%]).
The vast majority (93.3%) of DR patients were refractory to at least one cBTKi. Two DR patients (6.7%) progressed on the ncBTKi pirtobrutinib without having cBTKi-refractory disease; both patients had been exposed to cBTKis and stopped treatment due to toxicity before starting pirtobrutinib. In the DE group, 28 patients (43.1%) were refractory to at least one targeted therapy class. These included patients who were single refractory to a cBTKi (n = 17 [26.2%]), a BCL2i (n = 8 [12.3%]), and an ncBTKi (n = 1 [1.5%]) as well as 2 patients (3.1%) who were refractory to both cBTKis and ncBTKis. The remaining 37 patients (56.9%) did not have any documented refractoriness to treatment with cBTKis, ncBTKis, or BCL2is.
Most DE patients (67.7%) discontinued targeted agents due to toxicity (33 stopped a BTKi; 11 stopped a BCL2i; supplemental Table 1). Although BTKis were more frequently discontinued due to toxicity (69.2%) than PD (36.9%), BCL2is were more frequently discontinued due to completion of planned therapy (36.9%) or PD (15.4%) than toxicity (9.2%). Ibrutinib was the most commonly used BTKi in the DE group (84.6%), followed by acalabrutinib (15.4%). Of 31 patients who discontinued ibrutinib due to toxicity, cardiovascular toxicity was the most common reason for treatment discontinuation (n = 10; including 6 patients with atrial fibrillation and 1 patient with ventricular arrhythmia).
Treatment outcome and survival of DR and DE diseases
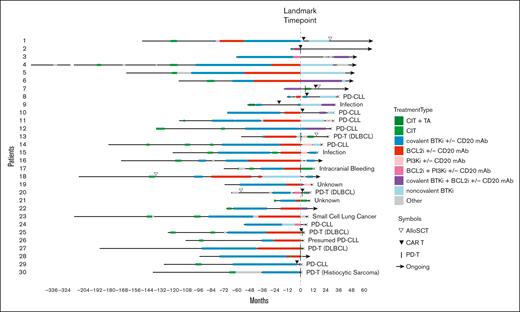
The median number of LOTs after the landmark time point was 2 for DR and 0 for DE disease. All except 1 of the 30 patients in the DR group (96.7%) received subsequent therapy for DR disease (Figure 3). The most commonly used subsequent treatment for DR disease was a ncBTKi (n = 10 [34.5%]; median TTNT-D, 16 months; 95% CI, 0.9-34.3), followed by concurrent cBTKi/BCL2i (n = 8 [27.6%]; median TTNT-D, 6.9 months; 95% CI, 3.3 to not evaluable [NE]), CD19 chimeric antigen receptor (CAR)–modified T cells (CAR Ts; n = 7 [24.1%]; median TTNT-D, 4.9 months; 95% CI, 1.0-15.8), and a PI3Ki (n = 6 [20.7%]; median TTNT-D, 5.6 months; 95% CI, 0.5 to NE; Supplemental Figure 1). Other treatments included allogeneic stem cell transplant (allo SCT; n = 3 [10.3%]), BTK degrader (n = 2 [6.9%]), and bispecific antibody (n = 1 [3.4%]). Notably, 2 of 3 patients with DR disease who received allo SCT remained in remission without requiring additional therapy at 2.7 and 1.7 years after transplant. A much smaller proportion of patients in the DE group received subsequent therapy after the landmark time point (n = 17 [26.2%]), indicating a relatively indolent disease course when targeted agents were stopped for reasons other than PD. The most commonly used subsequent treatment in the DE group was allo SCT (n = 5 [29.4%]), followed by cBTKi and CIT (n = 3 [17.6%] each). Durable treatment-free remission was observed in 2 of 5 patients who received allo SCT for DE disease; the remaining 3 patients had shorter treatment-free remission ranging from 1 to 3 years. Median TTNT-D was not analyzed for treatment subgroups with 5 or less patients.
Treatment course of DR CLL. TAs refer to cBTKis, ncBTKis, BCL2is, and/or PI3Kis. Other treatments included bispecific antibody, BTK degrader, anti-CD19 mAb, anti-CD20 mAb, anti-CD52 mAb, and CIT. Patient 30 was on a BCL2i for 26 days before developing DR disease. DLBCL, diffuse large B-cell lymphoma; mAb, monoclonal antibody; PI3Ki, phosphoinositide 3-kinase inhibitor; TA, targeted agent.
Treatment course of DR CLL. TAs refer to cBTKis, ncBTKis, BCL2is, and/or PI3Kis. Other treatments included bispecific antibody, BTK degrader, anti-CD19 mAb, anti-CD20 mAb, anti-CD52 mAb, and CIT. Patient 30 was on a BCL2i for 26 days before developing DR disease. DLBCL, diffuse large B-cell lymphoma; mAb, monoclonal antibody; PI3Ki, phosphoinositide 3-kinase inhibitor; TA, targeted agent.
The median follow-up after the landmark time point was 3.6 years for the DR group and 1.5 years for the DE group. At the time of data analyses, 19 of 30 patients in the DR group and 16 of 65 patients in the DE group had died (Table 3). The leading cause of death for the DR group was disease progression including PD-CLL (n = 8 [42.1%]) and PD-T (n = 5 [26.3%]). In contrast, infection was the most common cause of death in the DE group (n = 4 [25.0%]), followed by PD-T (n = 3 [18.8%]). Diffuse large B-cell lymphoma–like transformation was the most common type of histologic transformation among patients with PD-T (12/13 patients [92.3%] with PD-T across DR and DE groups).
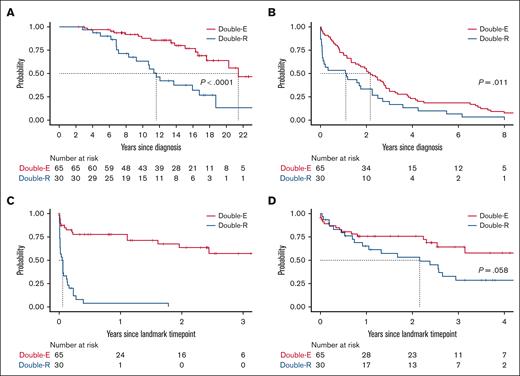
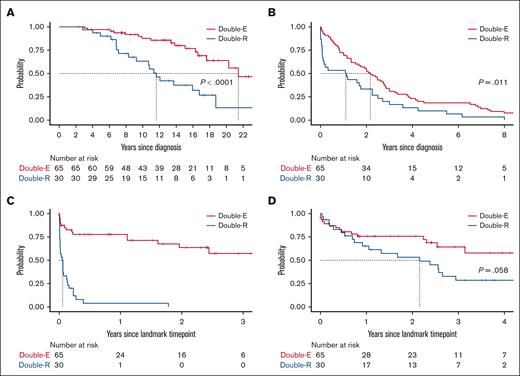
Patients with DR disease had significantly shorter OS from CLL diagnosis (median, 11.6 years for DR and 21.4 years for DE) and TT1T than those with DE disease (median, 1.1 years for DR and 2.2 years for DE; Figure 4). The median time from the first CLL-directed therapy to the landmark time point was 7.3 years for DR and 9.1 years for DE, which was not statistically significantly different. The median duration of active CLL therapy before the landmark was longer by 1.5 years for the DR group (5.4 years for DR; 3.9 years for DE). Once DR disease developed, TTNT-D was extremely short (median, 0.6 months). The median OS after the diagnosis of DR disease was 26 months or 2.2 years, which was numerically shorter than that of the DE group (median, not reached; P = .058). There was no difference in OS or TTNT-D between patients who received treatment with CIT before developing DR disease (n = 21) or those who were CIT-naïve (n = 9; P > .05 for both tests). The estimated 2-year OS after the landmark time point was 53.2% for the DR group and 75.6% for the DE group. Notably, OS curves began to separate 6 months after the landmark time point, suggesting limited durability of response to subsequent therapy in the DR group.
Survival and outcome. (A) OS since CLL diagnosis. (B) TT1T since CLL diagnosis. (C) TTNT-D since the landmark time point of developing DR or DE disease. (D) OS from the landmark time point.
Survival and outcome. (A) OS since CLL diagnosis. (B) TT1T since CLL diagnosis. (C) TTNT-D since the landmark time point of developing DR or DE disease. (D) OS from the landmark time point.
Next, we investigated the outcomes of patients who developed PD-T, which was the second most common cause of death in both the DR (n = 9 [30.0%]) and DE groups (n = 4 [6.2%]). The rate of PD-T in each group could not be directly compared due to differences in the duration of follow-up. The subdistribution hazard ratio of the incidence of PD-T was significantly lower for DE than DR. Among 13 patients who developed PD-T, the most commonly used initial therapy for the transformed disease included a BCL2i with or without CIT (n = 4 [46.2%]), CAR T (n = 2 [15.4%]), and bispecific antibody (n = 2 [15.4%]). The median OS after PD-T diagnosis was 12.7 months for DR (95% CI, 0.5 to NE) and 4.9 months for DE (95% CI, 2.6 to NE).
Patterns of clonal evolution for BTK and TP53 mutations
All 95 patients in the DR and DE cohorts had samples available for targeted NGS for at least one time point (Figure 2). The two most frequently found mutations in the overall population were TP53 (75.4%) and BTK (32.3%). Both BTK and TP53 mutations were found more frequently in the DR group (TP53 mutation in 66.7%; BTK mutation in 59.1%) than in the DE group (44.6% and 26.7%, respectively). In the DR group, the median VAF was 13% for TP53 mutation and 25% for BTK mutation at the landmark time point. We observed the emergence of non-C481 BTK mutations (T474I and L528W) in 7 of 13 DR patients during treatment with a ncBTKi, consistent with previous reports (Supplemental Figure 2).22-24 VAFs of C481 and non-C481 BTK mutations decreased, sometimes to undetectable levels, in response to BCL2i therapy in 2 DE patients (Supplemental Figure 3); both patients achieved a marked reduction of absolute lymphocyte count during BCL2i therapy, including 1 patient with detectable disease near the uMRD cutoff (0.01% by flow cytometry). VAFs of TP53 mutations did not show a consistent pattern during individual targeted therapy (Supplemental Figure 5).
Discussion
With 95 patients with CLL, we report, to our knowledge, the largest retrospective cohort to date of patients after BTKi/BCL2i therapy. High-risk disease characteristics were more frequently found in DR than DE CLL. These included enrichment for unmutated IGHV (97%), TP53 aberration (73%), and BTK mutations (60%) in the DR group, suggesting more aggressive disease biology of this group than DE disease. With a median follow-up of 17 years since CLL diagnosis and 3.6 years since the landmark time point, the DR group had a median OS of 2.2 years once DR disease developed, despite the frequent use of ncBTKis (43%) and cellular therapy (27%) in this cohort. Our findings underscore the importance of clearly identifying DR disease and distinguishing it from DE disease to facilitate the development or escalation of novel therapy desperately needed by this patient group of unmet need.
Due to the retrospective nature of our study, we used TTNT-D as a surrogate end point to assess treatment efficacy. This was feasible because all patients in the DR group developed PD during active treatment with BTKis and BCL2is rather than after cessation of time-limited therapy, and TTNT-D closely represented the duration of disease control while accounting for any deaths. Unlike PFS, TTNT-D does not capture disease progression as an event. Considering these differences in TTNT-D and PFS and the fact that relapsed CLL can be monitored without therapy until symptomatic disease develops, we initially anticipated that TTNT-D would be markedly longer than the reported PFS. However, the TTNT-D observed from this study was comparable to or shorter than the PFS reported from prospective studies. For instance, the median TTNT-D of DR patients subsequently treated with a ncBTKi was 16 months, which was shorter than the 24 months reported from the phase 3 BRUIN CLL-321 study25 and identical to the median PFS of 16 months reported from the phase 1/2 BRUIN study including both DR and DE patients.26 Similarly, the median TTNT-D of concurrent cBTKi/BCL2i was 7 months in the DR group, which was shorter than that reported by Hyak et al (1-year PFS of 56% in 13 DR or DE patients treated with ibrutinib plus venetoclax).27 The median TTNT-D of CAR T in our data set was also shorter (4.9 months) than the median PFS of 12 months reported from the TRANSCEND CLL-004 study testing lisocabtagene maraleucel (liso-cel) in patients with relapsed CLL, enriched for those with DR status (all BTKi refractory; 96% venetoclax refractory).28 This difference can be attributed to the exclusion of selected patients from the efficacy analysis in the presence of histologic transformation before CAR T infusion or logistical challenges related to the CAR T manufacturing process (eg, unable to receive CAR T and out-of-specification product). In our study, PD-T was frequently found in the DR group (26.3%), including 4 of 7 patients who received CAR T after the development of DR disease. Limitations of our study include the small number of patients in each treatment subgroup (10 DR patients treated with ncBTKi and 7 DR patients treated with CAR T) and the relatively short follow-up after the landmark time point (median, 3.6 years). A larger number of patients and longer follow-ups are needed to better understand the efficacy of subsequent therapy in DR CLL.
The 2.2-year median OS of patients with DR disease in our data set was markedly longer than previous observations. In 2021, Lew et al reported a median OS of 3.6 months for 17 patients with DR disease.29 This difference in OS is explained by highly unfavorable characteristics of the previous study (median age, 76 years; 88% with TP53 aberration; 100% with complex karyotype), compared to those in the DR group of this study (median age, 57 years; 73% with TP53 aberration; 77% with complex karyotype), and the recent development of ncBTKis and CAR T likely contributed to the improved outcomes. At the same time, our findings highlight the ongoing limitations of current CLL management and the urgent need for novel therapeutic strategies beyond kinase inhibitors and CAR Ts for the treatment of DR CLL, particularly for younger patients. Pirtobrutinib and liso-cel are available as third-line CLL therapy in the United States and can be used for the treatment of DR disease; however, it remains unclear how these treatments should be sequenced and when alternative treatment options should be considered. Although allo SCT is infrequently used in CLL, evidence supports its graft-versus-leukemia effect and improved safety associated with reduced intensity conditioning in CLL (nonrelapse mortality, 10%-13%).30-32 Bispecific antibodies and degraders linked to validated targets in CLL (eg, BTK degraders) are being actively investigated in clinical trials.33,34
Unlike DR disease, DE CLL was characterized by an indolent course, often could be monitored without immediate treatment, and retained sensitivity to targeted therapy. Of 23 patients who had >2 years of follow-up after developing DE disease, 7 patients required subsequent therapy and achieved a durable response to subsequent therapy.
Taken together, DR and DE CLL are disease groups with distinct molecular characteristics and clinical phenotypes. The median OS after the development of DR disease was 2.2 years, setting a benchmark for future clinical investigations focusing on this patient population and highlighting the continued need for drug development in CLL. Clinical trials should distinguish between these two populations by clearly defining DR and DE disease and analyzing outcomes separately.
Acknowledgments
The authors thank patients and their families who participated in the Dana-Farber Cancer Institute's chronic lymphocytic leukemia biobanking study, research coordinators, advanced practice providers, and site staff for their support.
M.S.D. is supported by a National Institutes of Health (NIH) award (1R01CA266298). J.R.B. is supported by an NIH grant (R01CA25892). I.E.A. is supported by the Leukemia and Lymphoma Scholar in Clinical Research Award.
Authorship
Contribution: J.T.Y. and I.E.A. conceived and designed the study; M.M., D.S.C., P.A., A.C.B., J.L.C., D.C.F., E.D.J., C.A.J., A.I.K., A.S.L., R.W.M., O.O.O., E.M.P., D.A.Q., C.E.R., A.S., J.D.S., J.A., M.S.D., J.R.B., and I.E.A. acquired data; S.M.F. obtained biospecimens; Y.Z. and S.T. performed statistical analyses; J.T.Y., Y.Z., S.T., and I.E.A. analyzed and interpreted data; J.T.Y. and I.E.A. drafted the manuscript; and all authors edited and approved the manuscript.
Conflict-of-interest disclosure: P.A. serves in a consulting or advisory role for Merck, Bristol Myers Squibb (BMS)/Celgene, Pfizer, Affimed, Genentech, Roche, ATB Therapeutics, Adative, Infinity, ADC Therapeutics, MorphoSys, Daiichi Sankyo, Miltenyi, Tessa, Genmab, C4, Enterome, Apizyme, AstraZeneca, Xencor, Foresight, Stelexis, and Regeneron; received honoraria from Merck; and received institutional research funding from Merck, BMS/Celgene, Affimed, Genentech/Roche, Kite, Adaptive, Tensha, Otsuka, SigmaTau, IGM, and AstraZeneca. A.C.B. serves in a consulting or advisory role for Genmab. J.L.C. serves in a consulting or advisory role for ADT, Seagen, Genmab/AbbVie, and Genentech; and received research funding from Merck, Genentech/Roche, Bayer, AbbVie, and Regeneron. E.D.J. serves in a consulting or advisory role for AstraZeneca, Merck, Pharmacyclics, F. Hoffmann-LaRoche, Novartis, Takeda, and Ascerta. C.A.J. received research funding from Pfizer; and serves in a consulting or advisory role for Kite, a Gilead company, MorphoSys, Miltenyi, Daiichi Sankyo, Instil Bio, Novartis, ADC Therapeutics, Caribou Biosciences, ImmPACT Bio, Ipsen, Synthekine, AbbVie, Abintus Bio, and BMS/Celgene. A.S.L. serves in a consulting or advisory role for Genmab and Pierre Fabre; and serves on the speakers bureau for Research To Practice. R.W.M. serves in a consulting or advisory role for Genmab, BMS, Genentech/Roche, Kite, and AbbVie; and received research funding from Genmab, BMS, Genentech/Roche, and Merck. D.A.Q. serves in a consulting or advisory role for ADC Therapeutics, Genmab, and BMS. C.E.R. serves in a consulting or advisory role for AstraZeneca; received honoraria from AstraZeneca; and institutional research funding from BeiGene, Genentech, and Lilly. J.D.S. serves in a consulting or advisory role for AstraZeneca, BMS, Genentech/Roche, and Loxo Oncology at Lilly; and received research funding from Adaptive Biotechnologies, BeiGene, BostonGene, Genentech/Roche, GlaxoSmithKline, Moderna, Takeda, and TG Therapeutics. J.A. received speaker’s fees from Regeneron. M.S.D. serves in a consulting or advisory role for Genentech, Janssen, AbbVie, AstraZeneca, Adaptive Biotechnologies, Ascentage Pharma, BeiGene, Lilly, BMS, Galapagos NV, Genmab, Merck, MEI Pharma, Takeda, and Nuvalent, Inc; received research funding from Ascentage Pharma (institutional) and Novartis (institutional); and royalties from UpToDate. J.R.B. serves in a consulting or advisory role for AbbVie, Acerta/AstraZeneca, Alloplex Biotherapeutics, BeiGene, BMS, EcoR1, Galapagos NV, Genentech/Roche, Grifols Worldwide Operations, InnoCare Pharma Inc, Kite Pharma, Loxo Oncology at Lilly, Magnet Biomedicine, Merck, and Pharmacyclics; received research funding from BeiGene, Gilead, iOnctura, Loxo Oncology at Lilly, MEI Pharma, and TG Therapeutics; and serves on the data safety monitoring board for Grifols Therapeutics. I.E.A. received institutional research funding from Genentech and Lilly; and serves in a consulting or advisory role for AstraZeneca, BeiGene, and Lilly. The remaining authors declare no competing financial interests.
Correspondence: Inhye E. Ahn, Lymphoma Division, Department of Medical Oncology, Dana-Farber Cancer Institute, 450 Brookline Ave, Boston, MA 02215; email: inhye_ahn@dfci.harvard.edu.
References
Author notes
Individual participant data in this article will be shared after deidentification upon request. These data will become available 12 months after article publication to investigators whose proposed use of the data has been approved by researchers and who sign a data access agreement. Original data are available on request from the corresponding author, Inhye E. Ahn (inhye_ahn@dfci.harvard.edu).
The full-text version of this article contains a data supplement.

