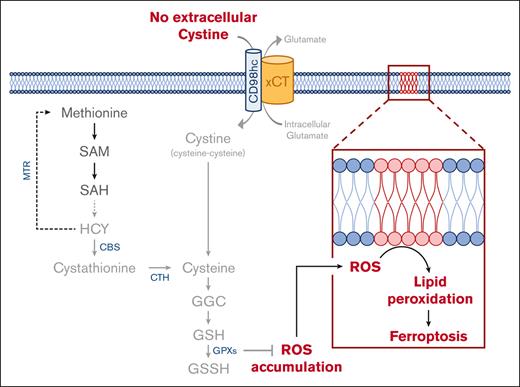
AML cells depend on extracellular cysteine to prevent ferroptosis, which cannot be compensated by methionine.
Targeting redox balance by combined inhibiting of cysteine import and antioxidant machinery is a therapeutic vulnerability in AML.
Visual Abstract
Cysteine is a nonessential amino acid required for protein synthesis, the generation of the antioxidant glutathione, and for synthesizing the nonproteinogenic amino acid taurine. Here, we highlight the broad sensitivity of leukemic stem and progenitor cells to cysteine depletion. By CRISPR/CRISPR-associated protein 9–mediated knockout of cystathionine-γ-lyase, the cystathionine-to-cysteine converting enzyme, and by metabolite supplementation studies upstream of cysteine, we functionally prove that cysteine is not synthesized from methionine in acute myeloid leukemia (AML) cells. Therefore, although perhaps nutritionally nonessential, cysteine must be imported for survival of these specific cell types. Depletion of cyst(e)ine increased reactive oxygen species (ROS) levels, and cell death was induced predominantly as a consequence of glutathione deprivation. nicotinamide adenine dinucleotide phosphate hydrogen oxidase inhibition strongly rescued viability after cysteine depletion, highlighting this as an important source of ROS in AML. ROS-induced cell death was mediated via ferroptosis, and inhibition of glutathione peroxidase 4 (GPX4), which functions in reducing lipid peroxides, was also highly toxic. We therefore propose that GPX4 is likely key in mediating the antioxidant activity of glutathione. In line, inhibition of the ROS scavenger thioredoxin reductase with auranofin also impaired cell viability, whereby we find that oxidative phosphorylation–driven AML subtypes, in particular, are highly dependent on thioredoxin-mediated protection against ferroptosis. Although inhibition of the cystine-glutamine antiporter by sulfasalazine was ineffective as a monotherapy, its combination with L-buthionine-sulfoximine (BSO) further improved AML ferroptosis induction. We propose the combination of either sulfasalazine or antioxidant machinery inhibitors along with ROS inducers such as BSO or chemotherapy for further preclinical testing.
Introduction
The 20 main proteinogenic amino acids are traditionally categorized into those that can be synthesized de novo (nonessential amino acids [NEAAs]) and those obtained solely through the diet (essential amino acids [EAAs]). These definitions derive, however, from studies examining the dietary needs of animals at the organismal level and not the dependency of individual cell types.1-6 More recent studies have alluded to NEAA dietary exclusion as not always supporting optimal growth and development in certain species.7,8 This indicates NEAA synthesis and import as not always being sufficient to meet the demands of individual cell types. Some have therefore suggested that nutritional essentiality definitions are a misnomer that should be outphased.9 Certain healthy cell types and tissues do indeed lack the ability to generate or take up particular NEAAs. For example, activation and effector function of T cells for example relies on adequate uptake of NEAAs.10 Glutamine is a NEAA, yet many mammalian cell types fail to grow in vitro when its exogenous supply is removed or if its importer, alanine/serine/cysteine transporter 2 (ASCT2), is inhibited.11,12
Reduced NEAA synthesis or uptake capacity also occurs in various disease states, during infancy, or after burn injuries.13-15 This conditional essentiality has been attributed to absent or altered expression of genes encoding amino acid processing enzymes, insufficient synthesis capacity to meet demand, as well as epigenetic silencing.16 Conditional essentiality of amino acids is also often described for transformed cells.17 Acute myeloid leukemia (AML) cells and other cancer types display downregulated expression of arginosuccinate synthetase 1, making them auxotrophic for the NEAA arginine.18-20 Similarly, acute lymphoblastic leukemia cells have low expression of asparagine synthetase, creating sensitivity to asparagine reductions such as with L-asparaginase treatment.21 Healthy hematopoietic stem and progenitor cells (HSPCs) are highly dependent on the exogenous provision of the branched chain amino acids valine and leucine, both EAAs, and also on the NEAA cysteine.22 In contrast, we have shown that AML cells are highly dependent on the EAA methionine but much less so on the branched chain amino acids.12 These studies also revealed that AML cells are highly dependent on cysteine, further highlighting how its nutritional nonessentiality does not uphold at the cellular level.
Cysteine synthesis occurs via conversion from methionine, or it is taken up in its oxidized dimer form (cystine) via the glutamate-cystine antiporter (xCT). Although, of course important for protein synthesis, as a precursor to glutathione (GSH) it is also highly relevant in managing oxidative stress and posttranslational glutathionylation. Our previous finding that AML cells are highly sensitive to cysteine depletion was already indicative of an inability of AML cells to generate cysteine from methionine. Here, we functionally uncover the molecular mechanisms underlying cysteine dependency in AML. We provide evidence for a clear uncoupling of the methionine cycle from the transsulfuration pathway (TsP) in AML, with leukemic cells being unable to synthesize cysteine, despite the TsP being functional. Cysteine depletion results in an increase in reactive oxygen species (ROS), in some AMLs predominantly via nicotinamide adenine dinucleotide phosphate hydrogen oxidase (NOX) activity. We show that increased ROS levels induce cell death via ferroptosis, a process whereby iron accumulation of lipid hydroperoxides impairs cellular viability.23 Finally, we highlight the necessity of both the thioredoxin and glutathione peroxidase (GPX) antioxidant machinery for AML survival, and show therapeutic applicability of targeting these metabolic pathways by boosting the efficacy of the xCT inhibitor sulfasalazine (SSZ) in combination treatment strategies.
Materials and Methods
Cysteine (cystine) titration experiments
To RPMI-1640 medium lacking L-cystine (Merck; no. R7513), L-methionine, and L-glutamine, methionine (0.1 mM) and glutamine (2 mM) were re-added but not cystine.12 Cell suspensions were prepared of each cell line or primary AML sample at a concentration of 20 000 cells or 50 000 cells per 190 μL of cystine-free RPMI-1640 medium, respectively. Of this suspension, 190 μL was then transferred to sufficient wells of a 96-well plate for triplicate wells of each concentration. For each concentration of cystine, a 20× stock was prepared (see details in the supplemental Materials and Methods section), and 10 μL of this added to the appropriate triplicate wells of each plate. For primary AMLs and the AML cell line TF1, cytokines were added to the cell suspension at the aforementioned concentrations.
Further information is provided in the supplemental Materials and Methods.
Results
Cysteine is a broad dependency of hematopoietic cells
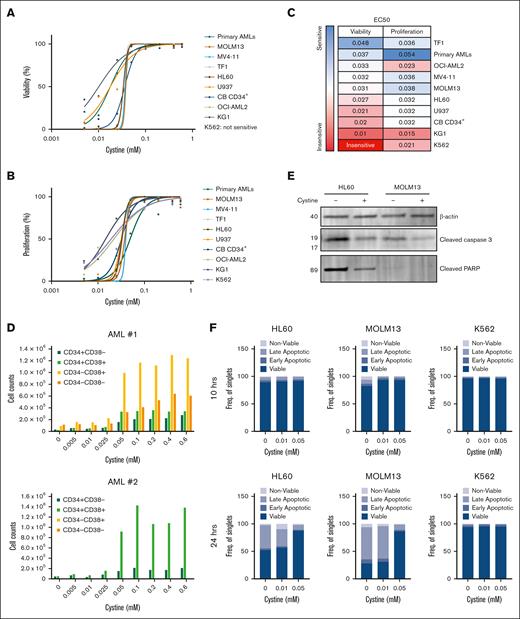
To determine the cysteine dependency of AML cells, we analyzed viability and proliferation across a panel of AML cell line models, primary AMLs (n = 4), and healthy CD34+ cells upon depletion of L-cystine, the oxidized dimer of cysteine that is the common form in culture medium. Viabilities of most cell lines were significantly affected, with TF1 and primary AMLs being the most sensitive; KG-1, U937 cells, and healthy cord blood–derived CD34+ cells being somewhat less sensitive, and K562 cells being the least sensitive (Figure 1A-C; supplemental Figure 1A). Cell proliferation was severely affected as well, with KG-1 and K562 cells being the least sensitive and primary AMLs being the most sensitive (Figure 1B-C; supplemental Figure 1B). The CD34+/CD38− and CD34+/CD38+ compartments were all affected upon cystine depletion, indicating that also the presumed leukemic stem cells (LSCs) were sensitive (Figure 1D). Apoptosis was studied by annexin V and 4′,6-diamidino-2-phenylindole staining, which revealed a gradual and dose-dependent increase in apoptosis from 10 hours to 24 hours upon cystine depletion in HL60 and MOLM13 cells, but not in K562 cells, coinciding with caspase 3 cleavage and poly ADP ribose polymerase induction (Figure 1E-F; supplemental Figure 2).
Cystine dependency in AML. (A) AML cell lines, primary AML blasts (n = 4), and healthy cord blood (CB)-derived CD34+ stem/progenitor cells were grown in liquid culture conditions, and the effects on cell viability upon dose-dependent depletion of cystine were determined by flow cytometry with annexin V and propidium iodide (PI). (B) As in panel A, but effects of cell proliferation as determined by viable cell counts is shown. (C) The 50% effective concentration (EC50) values (mM) of experiments shown in panels A and B showing the effective concentration of cysteine at which a 50% reduction in viability or proliferation was achieved. Primary AMLs were measured on day 5, and all other samples on day 3 (n = 2-5 independent experiments performed in triplicate). Cell lines with the highest sensitivity to cystine depletion are marked in blue, and cell lines with the lowest sensitivity are marked in red. (D) Cell counts of CD34+/CD38−, CD34+/CD38+, CD34−/CD38+, and CD34−/CD38− compartments upon cystine depletion. (E) Western blot for the levels of apoptosis markers cleaved poly ADP ribose polymerase and cleaved caspase 3 in HL60 and MOLM13 cells grown in the presence or absence of cystine for 20 hours; β-actin used as loading control. (F) Percent of viable (annexin V negative/PI negative), early apoptotic (annexin V positive/PI negative), late apoptotic (annexin V positive/PI positive), and nonviable (annexin V negative/PI positive) HL60, MOLM13, and K562 cells after 10 hours or 24 hours of growth in the absence of cystine.
Cystine dependency in AML. (A) AML cell lines, primary AML blasts (n = 4), and healthy cord blood (CB)-derived CD34+ stem/progenitor cells were grown in liquid culture conditions, and the effects on cell viability upon dose-dependent depletion of cystine were determined by flow cytometry with annexin V and propidium iodide (PI). (B) As in panel A, but effects of cell proliferation as determined by viable cell counts is shown. (C) The 50% effective concentration (EC50) values (mM) of experiments shown in panels A and B showing the effective concentration of cysteine at which a 50% reduction in viability or proliferation was achieved. Primary AMLs were measured on day 5, and all other samples on day 3 (n = 2-5 independent experiments performed in triplicate). Cell lines with the highest sensitivity to cystine depletion are marked in blue, and cell lines with the lowest sensitivity are marked in red. (D) Cell counts of CD34+/CD38−, CD34+/CD38+, CD34−/CD38+, and CD34−/CD38− compartments upon cystine depletion. (E) Western blot for the levels of apoptosis markers cleaved poly ADP ribose polymerase and cleaved caspase 3 in HL60 and MOLM13 cells grown in the presence or absence of cystine for 20 hours; β-actin used as loading control. (F) Percent of viable (annexin V negative/PI negative), early apoptotic (annexin V positive/PI negative), late apoptotic (annexin V positive/PI positive), and nonviable (annexin V negative/PI positive) HL60, MOLM13, and K562 cells after 10 hours or 24 hours of growth in the absence of cystine.
Methionine is not used to synthesize cysteine in hematopoietic cells
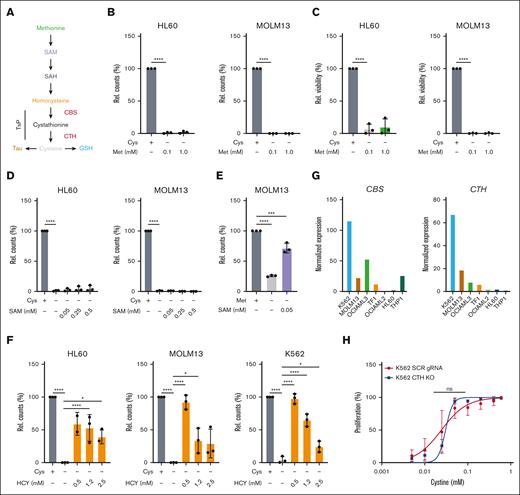
Methionine was still present in our cystine-depleted medium and was clearly not able to prevent loss of viability and proliferation in the absence of cysteine, strongly suggesting that leukemic cells are auxotrophic for cysteine and that the TsP could not be used to synthesize cysteine from methionine (Figure 2A). This notion was also supported by data we previously published that showed that 13C-methionine tracing consistently failed to result in label incorporation in cysteine or GSH.12 However, those studies were not performed under cystine-depleting conditions, which might be required to drive the necessity to synthesize it from methionine. To further examine the level to which methionine is metabolized and to test the functionality of the TsP, we supplemented cultures with metabolites upstream of cysteine in its absence (Figure 2A). Addition of excess methionine up to 1 mM (compared with the 0.1 mM typically present in RPMI-1640 medium) did not restore proliferation (Figure 2B) or viability (Figure 2C). The supplementation of either S-adenosylmethionine (SAM) (Figure 2D) or S-adenosylhomocysteine (data not shown) was also ineffective. Efficacy of the uptake of SAM was shown by the ability of SAM to rescue methionine depletion (Figure 2E, and reported in our previous study12). We previously observed that cystathionine rescues cell growth in the absence of cystine, although the degree of rescue was cell line dependent.12 Indeed, although higher levels of L-homocysteine (HCY) were toxic, 0.5 mM HCY supplementations provided comparable and almost complete rescues to cystine depletion in K562 and MOLM13 cells (Figure 2F). The rescue was less in HL60 cells (Figure 2F), and we wondered whether differential expression of the TsP enzymes cystathionine-γ lyase (CTH) and cystathionine-B synthase (CBS) might underly these differences. K562 cells, of which the viability was the least sensitive to cystine depletion, indeed had the highest expression of CBS and CTH compared with other AML lines, whereas expression in HL60 was much lower (Figure 2G). In line, we previously showed that methionine depletion is also rescued less efficiently in HL60 cells by supplementation of HCY, suggesting that low expression of CBS and CTH becomes rate limiting for full TsP activity in HL60 cells.12 To further functionally prove the auxotrophy for cysteine, we uncoupled the methionine cycle and TsP by knocking out CTH in K562 cells, the enzyme that converts cystathionine to cysteine. Our hypothesis was that if the knockout cells were not more sensitive to cystine depletion than wild-type cells, the cells do not use methionine to make cysteine. These knockout cells were not lethal and their sensitivity to cystine depletion was not significantly increased compared with scrambled guide control cells, further mitigating any role for methionine in generating cysteine (Figure 2H). Together, these data show that despite cysteine being nutritionally nonessential, on the cellular level, leukemic cells do not synthesize it from methionine. Furthermore, these data show that cystine depletion can be fully rescued by HCY supplementation.
AML cells do not synthesize cysteine from methionine and, thus, are auxotrophic for this NEAA. (A) Schematic depiction of the metabolic steps in the conversion of methionine (Met) to homocysteine, which proceeds through the TsP to generate cysteine. Cysteine can then be metabolized to generate GSH and taurine (Tau). (B) Relative cell counts at day 2 of HL60 and MOLM13 cells grown with cystine or without cystine (Cys) but in the presence of RPMI-1640 methionine concentrations (0.1 mM) or excess concentrations (1 mM) of methionine. (C) As in panel B but viability is shown. (D) Relative cell counts at day 2 of HL60 and MOLM13 cells grown with or without cystine, or without cystine but in the presence SAM. (E) Relative cell counts at day 1 of MOLM13 cells growth with or without methionine, or without methionine but in the presence SAM. (F) Relative cell counts at day 2 of HL60, MOLM13 and K562 cells grown with or without cystine, or without cystine but in the presence HCY. (G) Normalized expression from the CCLE data set for CBS and CTH in a panel of AML cell lines. (H) EC50 curves for K562 scrambled guide RNA (SCR gRNA) and CTH knockout (KO) cells grown for 3 days in a concentration range of cystine. All experiments: error bars represent mean ± standard error of the mean. Statistical analysis by ordinary 1-way analysis of variance (ANOVA); ∗P < .05, ∗∗P < .01, ∗∗∗P < .001, and ∗∗∗∗P < .0001. Rel., relative.
AML cells do not synthesize cysteine from methionine and, thus, are auxotrophic for this NEAA. (A) Schematic depiction of the metabolic steps in the conversion of methionine (Met) to homocysteine, which proceeds through the TsP to generate cysteine. Cysteine can then be metabolized to generate GSH and taurine (Tau). (B) Relative cell counts at day 2 of HL60 and MOLM13 cells grown with cystine or without cystine (Cys) but in the presence of RPMI-1640 methionine concentrations (0.1 mM) or excess concentrations (1 mM) of methionine. (C) As in panel B but viability is shown. (D) Relative cell counts at day 2 of HL60 and MOLM13 cells grown with or without cystine, or without cystine but in the presence SAM. (E) Relative cell counts at day 1 of MOLM13 cells growth with or without methionine, or without methionine but in the presence SAM. (F) Relative cell counts at day 2 of HL60, MOLM13 and K562 cells grown with or without cystine, or without cystine but in the presence HCY. (G) Normalized expression from the CCLE data set for CBS and CTH in a panel of AML cell lines. (H) EC50 curves for K562 scrambled guide RNA (SCR gRNA) and CTH knockout (KO) cells grown for 3 days in a concentration range of cystine. All experiments: error bars represent mean ± standard error of the mean. Statistical analysis by ordinary 1-way analysis of variance (ANOVA); ∗P < .05, ∗∗P < .01, ∗∗∗P < .001, and ∗∗∗∗P < .0001. Rel., relative.
Cysteine depletion–induced cell death is ROS dependent
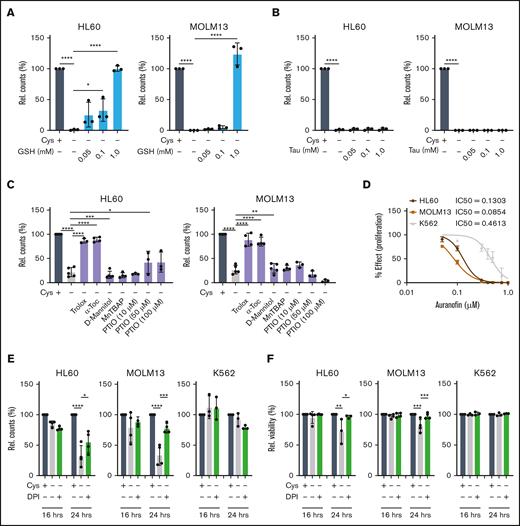
Alongside cysteine’s role in protein synthesis and disulfide bridge formation, its metabolic routing leads to taurine and GSH generation. Given that GSH is a major cellular antioxidant, cysteine metabolism is highly relevant to ROS management. Upon taurine and GSH supplementation, in the absence of cystine, only GSH provided a complete rescue (Figure 3A-B). Therefore, the acute induction of cell death after cystine depletion corresponds to a reduction in GSH levels, likely resulting in oxidative damage. To further prove this, we tested a panel of antioxidant compounds in the absence of cystine for 24 hours to scavenge a wide range of ROS species such as peroxyl radicals. Of these 6 compounds, the scavengers Trolox and α-tocopherol provided almost complete rescues (Figure 3C; supplemental Figure 3A). To counteract the damaging effects of ROS, cells can use the thioredoxin system by catalyzing the reduction of thioredoxin via the enzyme thioredoxin reductase, which works by the reduction of oxidized cysteine residues. We therefore made use of the US Food and Drug Administration (FDA)–approved rheumatological drug auranofin, which inhibits thioredoxin reductase, to test its efficacy in AML. AML cell lines were highly sensitive to auranofin, with the exception of K562 cells that were again the least sensitive (Figure 3D; supplemental Figure 3B).
Next, we investigated what the source of cellular ROS would be. NOXs are intramembrane complexes which along with the electron transport chain (ETC) are a major cellular source of ROS. To determine the contribution of NOX-derived ROS to the cell death induced by cystine depletion, we inhibited it with the compound diphenyleneiodonium chloride (DPI). This provided strong rescues, particularly to viability, suggesting that NOXs contribute more to the ROS production in AML than the ETC, at least in some subtypes (Figure 3E-F). As observed before, K562 cells were much less sensitive to cystine depletion, and DPI was ineffective, suggesting that these cells might not suffer from ROS produced by NOXs (Figure 3E-F). Indeed, in contrast to other leukemic cell lines, we find that expression of NOXs is much lower in K562 cells than in others (supplemental Figure 3C). ROS measurements were then performed by flow cytometry at 16 and 24 hours after cystine depletion. Total cellular ROS levels, as measured with the probe dichlorofluorescin diacetate (DCFDA) were unaltered in K562 cells, but were increased in HL60 and MOLM13 cells in a DPI-dependent manner, strongly suggesting that the majority of ROS is produced by NOXs in these cells (Figure 3G-H). These data were further supported by MitoSOX staining, which did not show an increase in mitochondrial superoxide accumulation upon cystine depletion (supplemental Figure 3D).
AML cell death after cysteine depletion results from ferroptosis induction
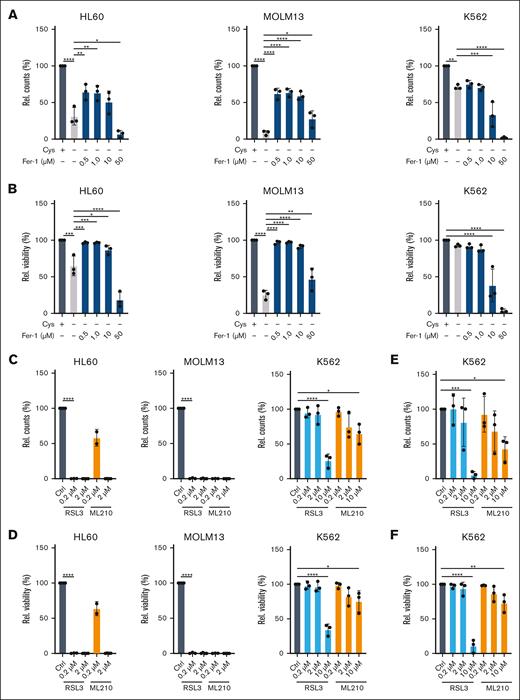
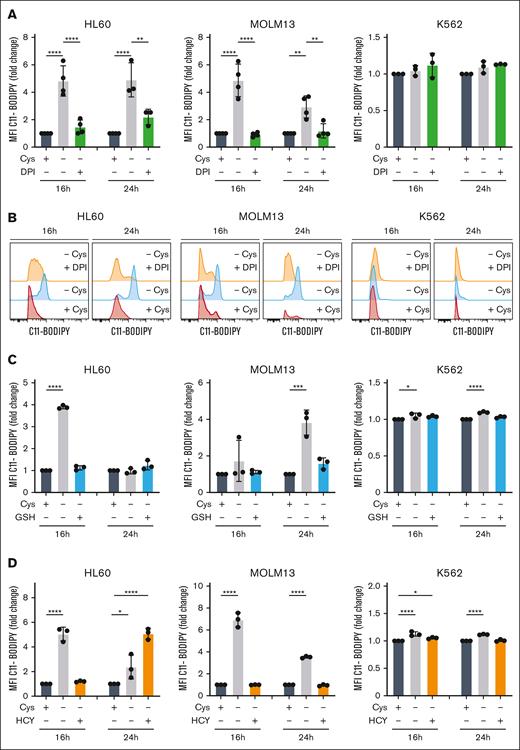
A known consequence of reduced GSH scavenging of ROS is the induction of the iron-dependent ferroptosis cell death pathway.23 To test this, we supplemented cells with ferrostatin (Fer-1), which can inhibit ferroptosis by acting as a radical trapping antioxidant. This provided strong rescues to the viability and proliferation of HL60 and MOLM13 cells but not K562 cells, which were consistently less sensitive to cysteine depletion (Figure 4A-B). We also noted that high concentrations of ferrostatin became toxic to all cell types used (Figure 4A-B). The antioxidant enzyme GPX4 functions to reduce lipid peroxides, and its inhibition has been shown to induce ferroptotic cell death.24 We exposed leukemic cells to the GPX4 inhibitors RSL3 and ML210 for 24 hours and observed strong toxicity in HL60 and MOLM13 cells, whereas K562 cells were much less sensitive to ferroptosis induction (Figure 4C-D), even after 48 hours of treatment (Figure 4E-F). Ferroptosis induction upon cysteine depletion coincided with lipid peroxidation in HL60 and MOLM13 cells but not K562 cells, which was reduced upon treatment with DPI (Figure 5A-B). Lipid peroxidation was efficiently rescued by GSH supplementation (Figure 5C). HCY supplementation also rescued lipid peroxidation at 16 hours, although at 24 hours in HL60 cells an increase in C11-BODIPY staining was noted (Figure 5D). This is possibly in line with our observation that prolonged exposure, or exposure to high concentrations of HCY can be toxic to cells (Figure 2F), which might be mediated via an induction of oxidative stress and ferroptosis as a consequence of GPX4 downregulation.25 Together, these data indicate that cystine depletion results in ROS accumulation driving ferroptosis, in a cell-type specific manner.
Cystine depletion causes cell death via ferroptosis. (A) Relative cell counts at day 1 of HL60, MOLM13, and K562 cells after growth with or without cystine, or without cystine but in the presence of the ferroptosis inhibitor ferrostatin (Fer-1; 0.5-50 μM). (B) Experiment as in panel A, but the effects on viability are shown. (C) Relative cell counts at day 1 of HL60, MOLM13, and K562 cells upon exposure to the GPX4 inhibitors RSL3 or ML210. Experiment performed in the presence of cystine. (D) Experiment as in panel C, but the effects on viability are shown. (E-F) Experiments as in panels C and D on K562 cells, but the readout was at day 2. Experiments performed in the presence of cystine. Statistical analysis by ordinary 1-way ANOVA; ∗P < .05, ∗∗P < .01, ∗∗∗P < .001, ∗∗∗∗P < .0001. Ctrl, control; Rel., relative.
Cystine depletion causes cell death via ferroptosis. (A) Relative cell counts at day 1 of HL60, MOLM13, and K562 cells after growth with or without cystine, or without cystine but in the presence of the ferroptosis inhibitor ferrostatin (Fer-1; 0.5-50 μM). (B) Experiment as in panel A, but the effects on viability are shown. (C) Relative cell counts at day 1 of HL60, MOLM13, and K562 cells upon exposure to the GPX4 inhibitors RSL3 or ML210. Experiment performed in the presence of cystine. (D) Experiment as in panel C, but the effects on viability are shown. (E-F) Experiments as in panels C and D on K562 cells, but the readout was at day 2. Experiments performed in the presence of cystine. Statistical analysis by ordinary 1-way ANOVA; ∗P < .05, ∗∗P < .01, ∗∗∗P < .001, ∗∗∗∗P < .0001. Ctrl, control; Rel., relative.
Cystine depletion results in lipid peroxidation. (A) Lipid peroxidation was quantified by C11-BODIPY staining upon 16 or 24 hours of cystine depletion or after 16 or 24 hours of cystine depletion but in the presence of 0.5 μM DPI; both normalized to the control condition in which cystine was present. The mean fluorescence intensity (MFI) fold change of oxidized C11-BODIPY is shown. (B) Representative histogram plots of data shown in panel A. (C) Lipid peroxidation was quantified by C11-BODIPY staining upon 16 or 24 hours of cystine depletion but in the presence of 1.0 mM GSH; both normalized to the control condition in which cystine was present. The MFI fold change of oxidized C11-BODIPY is shown. (D) Lipid peroxidation was quantified by C11-BODIPY staining upon 16 or 24 hours of cystine depletion but in the presence of 0.5 mM HCY; both normalized to the control condition in which cystine was present. The MFI fold change of oxidized C11-BODIPY is shown.
Cystine depletion results in lipid peroxidation. (A) Lipid peroxidation was quantified by C11-BODIPY staining upon 16 or 24 hours of cystine depletion or after 16 or 24 hours of cystine depletion but in the presence of 0.5 μM DPI; both normalized to the control condition in which cystine was present. The mean fluorescence intensity (MFI) fold change of oxidized C11-BODIPY is shown. (B) Representative histogram plots of data shown in panel A. (C) Lipid peroxidation was quantified by C11-BODIPY staining upon 16 or 24 hours of cystine depletion but in the presence of 1.0 mM GSH; both normalized to the control condition in which cystine was present. The MFI fold change of oxidized C11-BODIPY is shown. (D) Lipid peroxidation was quantified by C11-BODIPY staining upon 16 or 24 hours of cystine depletion but in the presence of 0.5 mM HCY; both normalized to the control condition in which cystine was present. The MFI fold change of oxidized C11-BODIPY is shown.
γ-Glutamylcysteine synthetase inhibition synergizes with cystine import inhibition to kill AML cells via ferroptosis
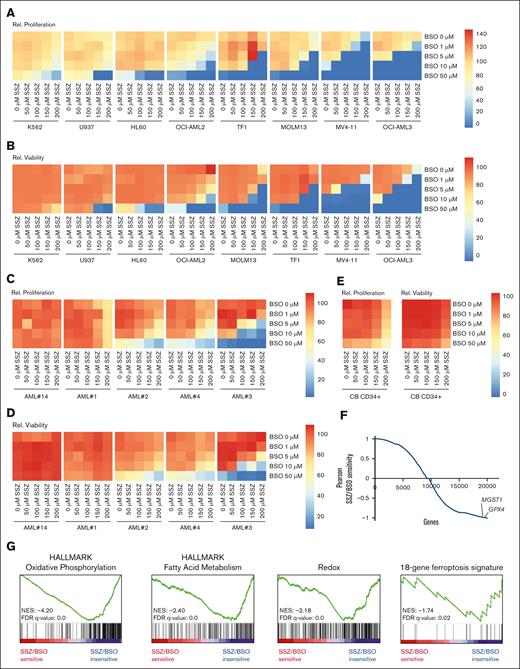
Next, we tested whether inhibition of the cystine/glutamate antiporter xCT (supplemental Figure 4A) with the FDA-approved drug SSZ or (S)-4-carboxyphenylgylcine (CpG) could pharmacologically phenocopy the effects of cystine deprivation. Treatment of a panel of AML cells lines with either compound provided limited efficacy, with MV4-11, MOLM13 (both FLT3-ITDmut and MLL rearranged), and TF1 cells being the most sensitive but only at relatively high concentrations (supplemental Figure 4B-E). Next, we validated the efficacy of both compounds in inhibiting xCT. For this, intracellular GSH and glutamate as well as extracellular glutamate and cystine were measured by liquid chromatography with tandem mass spectrometry. Inhibition by both SSZ and CpG resulted in the accumulation of intracellular glutamate and in a substantial reduction in intracellular GSH (supplemental Figure 4F-I). Intracellular taurine levels were unchanged (supplemental Figure 4J-K). In contrast, and as expected, extracellular levels of glutamate were reduced, and cystine levels were increased (supplemental Figure 4L-O). Thus, these data argue that the inhibitors were effective but that, potentially, a secondary stress factor that would drive ROS levels would be needed to enforce dependency on cysteine import for cellular survival. Alternatively, it is also still possible that some cystine is taken up by alternative transporters such as ASCT. This is supported by the notion that high concentrations of cysteine can rescue xCT inhibition in OCI-AML3 cells, as seen by Pardieu et al.26FLT3-ITD mutated AMLs have been suggested to have higher ROS levels,27 potentially underlining the observation that these lines were somewhat more sensitive to SSZ and CpG. To further explore this functionally, we performed cotreatments of SSZ with the γ-glutamylcysteine synthase inhibitor L-buthionine-sulfoximine (BSO) in 8 AML cell lines and in patient-derived primary AML samples. BSO synergized with SSZ to reduce proliferation and further boost cell death in numerous cell lines, which were insensitive to SSZ alone and greatly reduced the required concentration of SSZ required in sensitive lines (Figure 6A-B; supplemental Figure 5A). K562 cells remained the least sensitive (Figure 6A-B). The combination of BSO with SSZ also boosted AML cell death in primary samples, reaching synergism in some cases, although 2 AMLs were insensitive to either treatment (Figure 6C-D; supplemental Figure 5B), outlining that clear heterogeneity in responses does exist. Compared with AML cell lines and patient-derived primary AML samples, healthy control CB CD34+ cells were much less sensitive to BSO/SSZ treatment (Figure 6E). In HL60 and MOLM13 cells, the combination of BSO and SSZ also resulted in the induction of ROS and lipid peroxidation but not in increased mitochondrial superoxide accumulation (supplemental Figure 6A-C).
Inhibition of γ-glutamylcysteine synthetase boosts the cytotoxic effects of xCT inhibition. (A) Heat maps showing the relative cell counts at day 3 of a panel of AML cell lines grown in a concentration range of the xCT inhibitor SSZ in combination with a concentration range of the inhibitor of γ-glutamylcysteine synthetase, BSO. (B) Experiment as in panel A, but effects on viability are shown. (C) Heat maps showing the relative cell counts at day 3 of 5 primary AML samples grown in a range of concentrations of the xCT inhibitor SSZ in combination with a range of concentrations of the inhibitor of γ-glutamylcysteine synthetase, BSO. (D) Experiment as in panel C, but effects on viability are shown. (E) Heat maps showing the relative cell counts and relative viability at day 3 of CB-derived CD34+ cells grown in a range of concentrations of the xCT inhibitor SSZ in combination with a range of concentrations of the inhibitor of γ-glutamylcysteine synthetase, BSO. (F) Correlation curve between RNA sequencing data from AMLs in panels C and D and SSZ/BSO sensitivity. GPX4 and MGST1 expression correlated with insensitivity to SSZ/BSO. (G) Gene set enrichment analysis (GSEA) using the Pearson correlations depicted in panel E. Statistical analysis by ordinary 1-way ANOVA; ∗P < .05, ∗∗P < .01, ∗∗∗P < .001, ∗∗∗∗P <.0001. FDR, false discovery rate; NES, normalized enrichment score; Rel., relative.
Inhibition of γ-glutamylcysteine synthetase boosts the cytotoxic effects of xCT inhibition. (A) Heat maps showing the relative cell counts at day 3 of a panel of AML cell lines grown in a concentration range of the xCT inhibitor SSZ in combination with a concentration range of the inhibitor of γ-glutamylcysteine synthetase, BSO. (B) Experiment as in panel A, but effects on viability are shown. (C) Heat maps showing the relative cell counts at day 3 of 5 primary AML samples grown in a range of concentrations of the xCT inhibitor SSZ in combination with a range of concentrations of the inhibitor of γ-glutamylcysteine synthetase, BSO. (D) Experiment as in panel C, but effects on viability are shown. (E) Heat maps showing the relative cell counts and relative viability at day 3 of CB-derived CD34+ cells grown in a range of concentrations of the xCT inhibitor SSZ in combination with a range of concentrations of the inhibitor of γ-glutamylcysteine synthetase, BSO. (F) Correlation curve between RNA sequencing data from AMLs in panels C and D and SSZ/BSO sensitivity. GPX4 and MGST1 expression correlated with insensitivity to SSZ/BSO. (G) Gene set enrichment analysis (GSEA) using the Pearson correlations depicted in panel E. Statistical analysis by ordinary 1-way ANOVA; ∗P < .05, ∗∗P < .01, ∗∗∗P < .001, ∗∗∗∗P <.0001. FDR, false discovery rate; NES, normalized enrichment score; Rel., relative.
In order to begin to unravel molecular mechanisms underlying cysteine dependency in maintaining proper redox homeostasis, we correlated RNA sequencing data, which were available for the primary AML samples shown in Figure 6C-D, with SSZ/BSO-induced cell death. We identified that cells resistant to treatment expressed high levels of antiferroptosis machinery, including GPX4 and MGST1 (Figure 6F). Gene set enrichment analysis revealed that insensitivity to SSZ/BSO was associated with high expression of genes associated with oxidative phosphorylation (OXPHOS), fatty acid metabolism, and redox biology (Figure 6G). Also, we observed significant enrichment for the 18-gene ferroptosis signature that was recently identified as a poor-prognosis predictor in AML.28
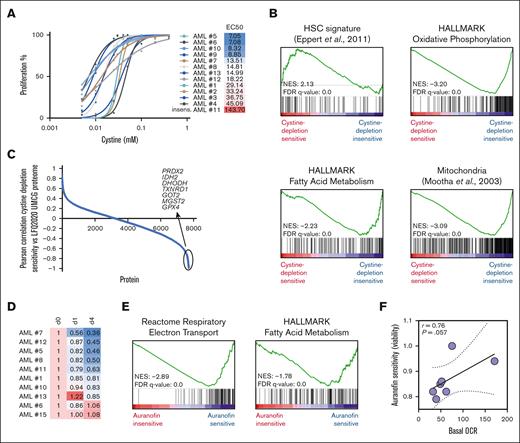
This led us to hypothesize that such mitochondrially active cells that are relatively high in ROS might already have efficient antioxidant mechanisms in place that would tolerate somewhat lower cysteine levels. To further study this functionally, we extended our cohort of primary AML samples tested for cysteine dependency to a total of 13. Heterogeneity in cysteine dependency was noted, and no clear association with mutation status was seen in this cohort (Figure 7A). For 10 of these, a full label-free quantitative proteome data set was available, and, in line with previous observations, we again noted that cysteine depletion–resistant cells were high in OXPHOS, mitochondrial activity, and fatty acid metabolism (Figure 7B). Indeed, we again observed that these AMLs expressed high levels of antiferroptosis proteins such as GPX4, PRDX2, and MGST2 (Figure 7C). These data would suggest that, on the one hand, these cells are already preprogrammed to be able to deal with oxidative stress but, on the other hand, are also highly dependent on such mechanisms to prevent cell death via ferroptosis. Finally, to test this hypothesis we inhibited thioredoxin reductase activity with auranofin in primary AML samples. Indeed, we observed that AML subtypes that were most dependent on thioredoxin reductase activity expressed the highest levels of proteins associated with OXPHOS, mitochondrial activity, and fatty acid metabolism (Figure 7D-E). Functionally, Seahorse assays confirmed that auranofin-sensitive AML subtypes also displayed the highest oxygen consumption rates (Figure 7F). Together these data uncover a specific dependency on antiferroptosis machinery in OXPHOS-driven AML.
AMLs enriched for fatty acid metabolism and OXPHOS processes are less sensitive to cystine depletion but do depend on thioredoxin reductase activity for ROS detoxification. (A) Primary AML blasts (n = 13) were grown in liquid culture conditions, and the effects on cell proliferation upon dose-dependent depletion of cystine were determined, including EC50 values (mM) showing the effective concentration of cysteine at which a 50% reduction in proliferation was achieved. (B-C) For 10 AMLs shown in panel A, a full label-free quantitative proteome data set was available, and Pearson correlation coefficients between EC50 values and protein expression were calculated (C) and used for GSEA (B). (D) Drug screen using auranofin (0.1-0.4 μM) on a panel of primary AML samples. Relative viable cell counts at day 1 and day 4 are shown. (E) Pearson correlation coefficients were calculated between auranofin sensitivity and protein expression, and used for GSEA. (F) For 7 AMLs shown in panel D, basal oxygen consumption rates (OCR) were determined by Seahorse assay, and a correlation curve between OCR and auranofin sensitivity is shown. FDR, false discovery rate; HSC, hematopoietic stem cell; LFQ2020 UMCG, proteome label-free quantification set 2020 University Medical Centre Groningen; NES, normalized enrichment score.
AMLs enriched for fatty acid metabolism and OXPHOS processes are less sensitive to cystine depletion but do depend on thioredoxin reductase activity for ROS detoxification. (A) Primary AML blasts (n = 13) were grown in liquid culture conditions, and the effects on cell proliferation upon dose-dependent depletion of cystine were determined, including EC50 values (mM) showing the effective concentration of cysteine at which a 50% reduction in proliferation was achieved. (B-C) For 10 AMLs shown in panel A, a full label-free quantitative proteome data set was available, and Pearson correlation coefficients between EC50 values and protein expression were calculated (C) and used for GSEA (B). (D) Drug screen using auranofin (0.1-0.4 μM) on a panel of primary AML samples. Relative viable cell counts at day 1 and day 4 are shown. (E) Pearson correlation coefficients were calculated between auranofin sensitivity and protein expression, and used for GSEA. (F) For 7 AMLs shown in panel D, basal oxygen consumption rates (OCR) were determined by Seahorse assay, and a correlation curve between OCR and auranofin sensitivity is shown. FDR, false discovery rate; HSC, hematopoietic stem cell; LFQ2020 UMCG, proteome label-free quantification set 2020 University Medical Centre Groningen; NES, normalized enrichment score.
Discussion
Tumor cells frequently alter their metabolic state to meet their growth demands.29-33 As a consequence, alterations in expression or epigenetic silencing of genes encoding metabolite-synthesizing enzymes can lead to metabolite auxotrophy, which might provide attractive targets for therapeutic intervention. An example of such a targetable vulnerability is the NEAA arginine in AML and other tumor types in which low levels of argininosuccinate synthetase 1 render cells dependent on extracellular arginine uptake.18,19 The same is true for asparagine in acute lymphoblastic leukemia.21 Here, we uncover that AML cells are auxotrophic for cysteine to maintain proper redox homeostasis, and OXPHOS-driven AMLs are highly dependent on antioxidant machinery to prevent ferroptosis-mediated cell death (supplemental Figure 7).
Despite being classified as nonessential, our data, and that of others, clearly points to a dependency of leukemic cells on exogenous cyst(e)ine,12,22,26,34 and similar observations have been made in other cancer types.35-37 Most recently, Pardieu et al showed that the cystine-glutamate antiporter SLC7A11/xCT is a poor-prognosis factor in AML, and that genetic downregulation of SLC7A11 or inhibition of cystine import by xCT inhibitors has antileukemic activity.26SLC7A11 is also part of a poor prognostic AML score that was recently published by Zheng et al.38 Our data clearly support the notion that the previously proposed cysteine nonessentiality relates strictly to nutritional essentiality. Furthermore, we now also show that hematopoietic cells are unable to synthesize cysteine de novo from methionine. Supplementation with high levels of methionine or SAM were unable to compensate for the absence of cysteine. Furthermore, in our previous 13C-methionine tracing studies in AML cells we failed to find label incorporation in cysteine and GSH.12 HCY and GSH, however, could rescue cysteine depletion, indicating that the TsP is able to replenish GSH via the enzymes CBS and CTH. Why HCY, but not more upstream metabolites, maintains the potential to pass through the TsP to generate GSH will require further investigation, but it could be hypothesized that this relates to the need of leukemic cells to preserve SAM levels, and, therefore, homocysteine is preferably recycled to methionine rather than progressing through the TsP. Furthermore, it is possible that when expression of TsP enzymes becomes rate limiting, the capacity to generate cysteine and GSH might become jeopardized, as was shown in some tumor types.39,40 We find that AML cell lines with the lowest levels of CBS and CTH are the most sensitive to cysteine depletion, whereas K562 cells that express relatively high levels are less sensitive. Yet, K562 cells in which CTH was knocked out remained equally insensitive to cysteine depletion (Figure 2H), indicating that these cells did not metabolize methionine via the TsP to cysteine. Moreover, we did not find correlations between TsP enzyme expression and cysteine-depletion sensitivity in primary AML samples and, therefore, alternative mechanisms must also play a role.
Such mechanisms might involve the capacity to upregulate antioxidant machinery to protect cells from the damaging effects of ROS, or involve the level or source of ROS that is produced. Regarding the latter, we indeed observed that in the AML cell lines HL60 and MOLM13 but not K562, cystine depletion led to a substantial increase in ROS, and the impact on cell death could be reversed by inhibition of NOXs. This would argue that most ROS in those AML cell lines would be produced by NOXs, and we indeed identify that the expression of NOX complex members (CYBA, CYBB, and NCF1-4) is significantly lower in K562 cells than in other cell lines included in our study. It must be noted, however, that K562 cells originally derive from a patient with chronic myeloid leukemia in blast crisis and therefore differ in their genetic background as compared with other AML cell lines used in this study, which might also affect differences in responses. It was previously proposed that most of the ROS produced by AMLs would be derived from cytoplasmic NOX activity and not from mitochondrial ETC activity,41,42 which would be in line with our observations in AML cell lines. Regarding the first potential mechanism, we find that high expression of ROS scavengers and antioxidant machinery is correlated with a relative insensitivity to cystine depletion, including high expression of GPX4, peroxiredoxins, thioredoxin reductases, and MGST1/2. This prompted us to further study whether cell death induced by cystine depletion would be caused by ferroptosis, which indeed turned out to be the case. Ferroptosis has now been widely recognized as a driver of cell death in various cancers, including human leukemias.23,27,35,43-45 Pardieu et al previously showed that xCT inhibition in AML cells results in a marked decrease in GSH, with particularly increased lipid peroxidation and ferroptosis induction as a consequence.26 Furthermore, they reported that xCT dependency is not correlated with SLC7A11, SLC3A2, or ASCT expression.26 We find that the upregulation of proteins that control redox homeostasis was particularly prevalent in AML subtypes that were more OXPHOS driven. OXPHOS typically drives ROS levels, and we therefore hypothesized that such AML subtypes need to equip themselves with machinery to protect them against the damaging effects of ROS. At the same time, this might also present as a targetable vulnerability, because inhibition of such pathways might render such AMLs sensitive to ferroptosis-mediated cell death. Indeed, treatment with the FDA-approved drug auranofin that inhibits thioredoxin reductase activity was particularly effective in mitochondrially active OXPHOS-driven AMLs. The metabolic state of AML cells might therefore be explored further as biomarker for specific treatment decisions.
Recently it was reported that healthy hematopoietic stem cells have the lowest concentration of amino acids of all HSPC populations, with levels increasing through maturation.46 This resulted from high amino acid catabolism in order to activate the general control nonderepressible 2-eukaryotic initiation factor 2α axis and inhibit protein synthesis. In the leukemic setting, the opposite has been proposed. ROSlow-defined LSCs reportedly have a higher reliance on amino acid metabolism than either leukemic blasts or healthy HSPC populations.47 This was also seen for cysteine, for which degradation with cysteinase reduced GSH levels and subsequently lowered posttranslational glutathionylation of the mitochondrial complex II protein succinate dehydrogenase rather than ROS maintenance.34 Our findings argue, however, that the cysteine dependency is consistent across AML cells of all maturity levels and not only LSCs. Furthermore, although we have not specifically measured glutathionylation after cysteine depletion, our data do show that ROS misbalance and ferroptosis are the major contributors to cell death. Our rescue experiments with ROS scavengers and the NOX inhibitor DPI more readily rescued AML viability than proliferation, and it is highly likely that phenomena such as lower translation or lower glutathionylation participate in this incomplete rescue of cell growth.
The xCT inhibitor SSZ is an FDA-approved drug used in the treatment of inflammatory and rheumatological disorders. A repurposing of this drug for treating AML was recently proposed by Pardieu et al, who reported that SSZ synergizes with anthracycline-based therapies.26 We find that the combination of SSZ with BSO to drive ROS production significantly boosted the induction of cell death across a panel of AML cell lines and patient-derived primary AML samples. Together, these data uncover targetable metabolic vulnerabilities, whereby ferroptosis induction presents as an interesting potential avenue for AML treatment that should be further explored.
Acknowledgments
A.C. and A.E. gratefully acknowledge receipt of a Marie Curie Fellowship and are participants in the same Initial Training Network.
These studies were financially supported by the European Union (H2020-MSCA-ITN-2015, 675790, HaemMetabolome; J.J.S.). The work was also supported by Dutch Cancer Foundation grant KWF-12910 (J.J.S.).
Authorship
Contribution: A.C., L.L.O., M.G., D.A.P.-M., A.T.J.W., A.E., and D.S. performed research; A.C., L.O., M.G., D.A.P.-M., A.T.J.W., A.E., D.S., G.H., and J.J.S. discussed and analyzed data; A.C., L.O., and J.J.S. conceptualized the study; A.C., L.O., and J.J.S. wrote the manuscript; and all authors edited and approved the manuscript.
Conflict-of-interest disclosure: The authors declare no competing financial interests.
Correspondence: Jan Jacob Schuringa, Department of Experimental Hematology, University Medical Center Groningen, University of Groningen, Hanzeplein 1, 9700RB, DA13 Groningen, The Netherlands; email: j.j.schuringa@umcg.nl.
References
Author notes
∗A.C. and L.L.O. contributed equally to this study.
Data are available on request from the corresponding author, Jan Jacob Schuringa (j.j.schuringa@umcg.nl).
The full-text version of this article contains a data supplement.


![Cysteine maintains GSH levels and the subsequent management of ROS. (A) Relative cell counts at day 2 of HL60 and MOLM13 cells grown with or without cystine, or without cystine but in the presence of GSH. (B) Relative cell counts at day 2 of HL60 and MOLM13 cells grown with or without cystine, or without cystine but in the presence of Tau. (C) Relative cell counts at day 1 of HL60 or MOLM13 cells grown with or without cystine, or without cystine but in the presence of the ROS scavengers: Trolox (100 μM), α-tocopherol (α-toc; 50 μM), D-mannitol (1 mM), Mn(III)tetrakis (4-benzoic acid) porphyrin (MnTBAP, 25 μM), and 2-(4-Carboxyphenyl)-4,4,5,5-tetramethylimidazoline-1-oxyl-3-oxide (carboxy-PTIO; 10-100 μM). (D) IC50 curve for cell counts of HL60, MOLM13, and K562 cells grown in a concentration range of the thioredoxin reductase inhibitor auranofin. (E) Relative cell counts at 16 and 24 hours of HL60, MOLM13, and K562 cells grown with or without cystine, or without cystine but in the presence of the NOX inhibitor DPI. (F) Experiment as in panel E, but relative viability is shown. (G) Total cellular ROS (by dichlorofluorescin diacetate [DCFDA]) after 16 and 24 hours of cystine depletion, or after 24 hours cystine depletion but in the presence of DPI. (H) Representative histogram plots for total cellular ROS (DCFDA) of data shown in panel G. Statistical analysis by ordinary 1-way ANOVA; ∗P < .05, ∗∗P < .01, ∗∗∗P < .001, and ∗∗∗∗P < .0001. Rel., relative.](https://ash.silverchair-cdn.com/ash/content_public/journal/bloodadvances/8/1/10.1182_bloodadvances.2023010786/2/m_blooda_adv-2023-010786-gr3b.jpeg?Expires=1769092901&Signature=u0kx5p7Eu2Di6CMxeFvw-l627dm0TwHYRZ0nt7bIgxRBG7FAWQ-irGAwaHrV90yug-d2ImDADfD1imyD6Hi1OHVm5Ds4LSTlYFWkaBzh2x7~skBzygow7txP3FmeBSIdQwHW-g2rFbmekGRIJulLAerx4z~49xpVEbZfJxr5MUWyEr4Yuzu2sNIrv2Wq8OfTteP7bca9QoX5TS83Xm3xve5TPvnyfaSgBd9tNn7e4EjUg8CsxPIkSJrxY5l~fDr1eCN9UBohFWuz3WXeFlpfURavf~Ma0G~Nh3zzAztvUNMWeN~oEc5ksY47JtRnGZtyI-Q5xUqwBrALQiYIU57pBA__&Key-Pair-Id=APKAIE5G5CRDK6RD3PGA)