Key Points
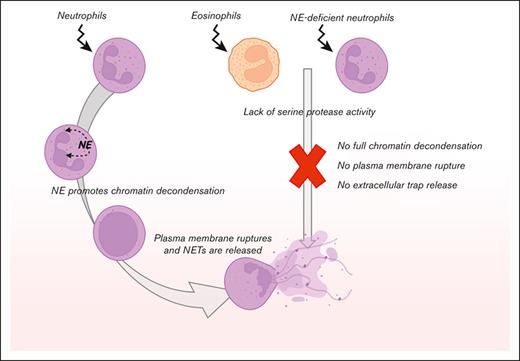
Eosinophils show a failure of plasma membrane breakdown and ET release as observed by live cell imaging.
Neutrophil elastase is essential for NETosis and might be the critical factor lacking in human eosinophils.
Abstract
Activated eosinophils are described to release eosinophil extracellular traps (EETs), which consist of the cell’s DNA covered with granule-derived antimicrobial peptides. Upon stimulation of eosinophils with the known EET-inducers phorbol 12-myristate 13-acetate, monosodium urate crystals, or Candida albicans, we observed that their plasma membrane became compromised, resulting in accessibility of the nuclear DNA for staining with the impermeable DNA dye Sytox Green. However, we did not observe any DNA decondensation or plasma membrane rupture by eosinophils, which sharply contrasts with neutrophil extracellular trap (NET) formation and the subsequent cell death known as NETosis. Neutrophil elastase (NE) activity is thought to be essential for the cleavage of histones and chromatin decondensation during NETosis. We observed that the neutrophils of a patient with a mutation in ELANE, leading to congenital neutropenia and NE deficiency, were unable to undergo NETosis. Taken together, we may suggest that the natural absence of any NE-like proteolytic activity in human eosinophils explains why EET formation is not observed, even when eosinophils become positive for an impermeable DNA dye in response to stimuli that induce NETosis in neutrophils.
Introduction
Since the discovery of neutrophil extracellular traps (NETs) formation and the subsequent cell death (known as NETosis) in 2004,1 a number of other leukocytes have been described to also release extracellular traps (ETs), including eosinophils, basophils, and monocytes.2 These ETs consist of the cell’s released DNA content, covered with antimicrobial peptides. It is thought that these web–like chromatin structures trap microbes and thereby prevent their dissemination, as well as neutralize or even kill them. Eosinophils are well-known for their role in parasite host defense and allergic disorders.3 Decades ago, these cells were described to release free eosinophil granules (FEGs) upon lytic cell death in vivo,4 a process of eosinophilic cell lysis characterized by disintegration of nuclear chromatin, plasma membrane rupture, and subsequent release of FEGs. These lytic eosinophils and FEGs were observed in the sputum of patients with asthma and those with atopic dermatitis.4-6 To date, 2 theories about the process of eosinophil ETs (EETs) release exist: according to the first theory, activated eosinophils undergo a cell death program termed EETosis, which involves decondensation of nuclear chromatin and plasma membrane rupture, resulting in the release of nuclear DNA. This process takes up to 2 hours and is dependent on nicotinamide adenine dinucleotide phosphate (NADPH) oxidase.7 In an alternative theory, eosinophils rapidly (<15 minutes after stimulation) release mitochondrial DNA while remaining viable,8 although the latter theory is widely questioned as only small amounts of mitochondrial DNA are present in eosinophils.9
Here, we assessed the occurrence and dynamics of DNA release by human eosinophils in comparison with control neutrophils and with granulocytes from a patient with a genetically proven ELANE mutation.
Material and methods
Isolation of primary granulocytes and eosinophils
Heparinized venous blood was drawn from healthy controls and a patient with a mutation in ELANE10 after informed consent had been obtained. Subsequently, granulocytes were isolated as described previously.11 The granulocyte fraction was resuspended in 4-(2-Hydroxyethyl)piperazine-1-ethanesulfonic acid (HEPES) medium12 and generally contained >95% neutrophils.
The purification of eosinophils from the granulocyte fraction was performed as described previously.13 In short, granulocytes were resuspended in phosphate-buffered saline with 10% (v/v) trisodium citrate and 0.5% human serum albumin. Granulocytes were incubated with 10 nM fMLF (Sigma-Aldrich, St Louis, MO) for 10 minutes at 37°C, followed by discontinuous (1.082 g/mL and 1.1 g/mL) Percoll gradient centrifugation. Eosinophils were obtained from the interface between the 2 Percoll layers, washed, and resuspended in HEPES medium (containing 132 mM of NaCl, 20 mM of HEPES, 6.0 mM of KCl, 1.0 mM of MgSO4, 1.0 mM of CaCl2, 1.2 mM of potassium phosphate, 5.5 mM of glucose, and 0.5% (w/v) human serum albumin, pH 7.4).12 This purification method does not induce the priming of eosinophils, as described elsewhere.13,14 Cytospins were prepared and stained with May-Grünwald/Giemsa staining to evaluate the purity, morphology, and viability of the isolated cell fractions, and flow cytometry was performed to assess the purity of the cell fractions based on forward and side scatter and Siglec-8 expression. The purity of eosinophils was generally >90%. All experiments involving human blood samples were conducted in accordance with the Declaration of Helsinki. This study was approved by the local ethical committee of the Amsterdam University Medical Center and Sanquin Blood Supply, Amsterdam, The Netherlands.
ETs induction and confocal microscopy
For end point visualization of ETs, eosinophils, or neutrophils (2 × 10⁵) were seeded on 12-mm glass coverslips. Where indicated, cells were preincubated for 15 minutes with 10 μM diphenyleneiodonium chloride (DPI) or 0.1% dimethyl sulfoxide as a vehicle control at 37°C. ET formation was induced with phorbol 12-myristate 13-acetate (PMA; 100 ng/mL, Sigma-Aldrich), monosodium urate (MSU) crystals (200 μg/mL, Invivogen, San Diego, CA), or opsonized Candida albicans (strain SC5314; multiplicity of infection of 10) for 4 hours at 37°C. Subsequently, cells were fixed with 3.7% paraformaldehyde (PFA), blocked in blocking buffer (5% bovine serum albumin [BSA] in phosphate-buffered saline) and stained with primary antibodies directed against myeloperoxidase (mouse monoclonal [2C7], Abcam, Cambridge, United Kingdom) and neutrophil elastase (NE) (rabbit polyclonal, Sanquin, Amsterdam, The Netherlands). The secondary antibodies used were F(ab')2-goat anti-mouse IgG (H+L) Alexa Fluor 633 (Invitrogen, Carlsbad, CA) and F(ab')2-goat anti-rabbit IgG (H+L) Alexa Fluor 488 (Invitrogen). Finally, DNA was stained by Hoechst 33342 (Invitrogen), and coverslips were mounted with Mowiol. Coverslips were imaged on a Leica TCS SP8 confocal microscope and analyzed with Leica Application Suite X (Leica Microsystems, Wetzlar, Germany).
For live cell imaging, eosinophils or neutrophils were seeded on an μ-Slide 8 well ibiTreat chamber slide (ibidi GmbH, Gräfelfing, Germany) and stained with the impermeable DNA dye Sytox Green Nucleic Acid Stain (5 μM, Thermo Fisher Scientific, Waltham, MA) and the permeable DNA dye DRAQ5 (2 μM, BioLegend, San Diego, CA). Where indicated, neutrophils or eosinophils were prelabeled with CellMask™ Orange plasma membrane stain (Invitrogen), according to the manufacturer’s instructions. Upon ET induction with 100 ng/mL PMA, 10 minutes were used to set up either the Leica TCS SP8 or the ZEISS LSM 980 Airyscan 2 confocal microscope imaging settings. The microscopes were equipped with a temperature-controlled chamber set at 37°C. When using the Leica TCS SP8, images were obtained with a frame rate of 1 picture per 3 minutes for a total duration of 4 hours (or longer if indicated). When using the ZEISS LSM 980 Airyscan 2, z-stacks of the cells ware made (96 slices total of 19.95 um = 0.207 μm per slice) with a 15-minute interval for a total duration of 4 hours.
DNA release measurement
Eosinophils or neutrophils (1 × 10⁵) were seeded in a 96-well white microplate (Corning Inc, Corning, NY) and stained with Sytox Green (1 μM). Where indicated, cells were preincubated for 15 minutes with 10 μM DPI or 0.1% dimethyl sulfoxide as a vehicle control at 37°C. ET formation was induced as described above. Fluorescence (excitation 485 nm; emission 535 nm) was monitored at 1-minute intervals for 4 hours by an Infinite F200 PRO plate reader (Tecan, Männedorf, Switzerland) at 37°C. The data were expressed as either relative fluorescence units (RFU) or the area under the curve was calculated.
Protease release and activity
Proteolytic activity of proteases that are released upon degranulation by neutrophils or eosinophils was measured with DQ-Green BSA (Molecular Probes, Eugene, OR), which becomes fluorescent on cleavage by proteases. In the presence of DQ-BSA (10 μg/mL), neutrophils or eosinophils (2.5 × 10⁶/mL) were preincubated with cytochalasin B (CytoB; 5 μg/mL; Sigma-Aldrich) for 5 minutes at 37°C. Subsequently, fMLF (1 μM) or PMA (100 ng/mL) was added, and fluorescence (excitation 485 nm; emission 535 nm) was monitored at 30-second interval for 30 minutes by an Infinite F200 PRO plate reader. A Triton X-100 lysate was used as 100% value. Data are expressed as the maximal slope in RFU per minute.
NADPH oxidase activity
The production of reactive oxygen species (ROS) by neutrophils or eosinophils (0.25 × 10⁶/mL) upon stimulation with opsonized Escherchia coli (0.25 × 10⁹/mL), zymosan (1 mg/mL), serum-treated zymosan (1 mg/mL), PMA (100 ng/mL), or platelet-activating factor/fMLF (1 μM/1 μM) was assessed by measurement of the release of hydrogen peroxide with an Amplex Red assay (Molecular Probes), as described previously.15 The data are expressed as the maximal slope in RFU per minute.
Statistics
Experimental data were plotted and analyzed by GraphPad Prism V9.0.0 (GraphPad Software, San Diego, CA). Results are shown as mean + standard deviation. The unpaired t test was used to test statistical significance (∗∗P < .01; ∗∗∗P < .001).
Results
Failure of plasma membrane breakdown and ET release by eosinophils
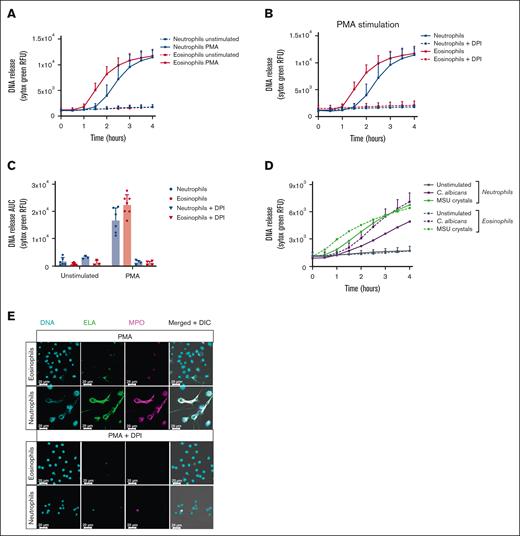
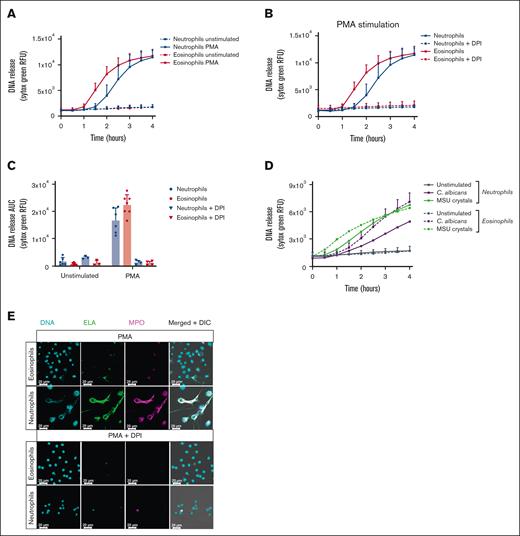
To assess the occurrence and dynamics of DNA release by human eosinophils, we measured extracellular DNA release as a marker for EETosis using the cell-impermeable DNA dye Sytox Green in a fluorescence plate reader, as described before.7 To induce EETosis, we stimulated eosinophils with the classic and well-studied protein kinase C activator, PMA, which is commonly used to induce NET formation in neutrophils and is considered to be a general ETosis inducer.7 Sytox Green fluorescence was measured in real time and indicated eosinophil DNA staining started about 60 minutes after stimulation, which was faster than neutrophils (Figure 1A). In accordance with previous reports, PMA-stimulated DNA staining was dependent on NADPH oxidase activity, as preincubation with DPI inhibited the fluorescent Sytox Green signal both in neutrophils and eosinophils (Figure 1B-C). When DNA staining was studied by addition of gout-causing MSU crystals or the yeast C. albicans, other described EETosis inducers,16,17 we observed that both MSU crystals and C. albicans were able to induce a Sytox Green signal in eosinophils (Figure 1D).
Absence of ET formation by eosinophils. Eosinophils and neutrophils were preincubated with 10 μM DPI or 0.1% DMSO as vehicle control where indicated. To induce ET formation, eosinophils and neutrophils were stimulated with (A-C,E) PMA (100 ng/mL), (D) MSU crystals (200 μg/mL), or opsonized C. albicans for 4 hours at 37°C. (A-B,D) DNA release of eosinophils and neutrophils was measured in real time by Sytox Green Nucleic Acid Stain and (C) the area under the curve was calculated (mean + standard deviation , n = 6-7 for PMA vehicle condition, n = 6-7 for MSU crystals condition, n = 4-5 for C. albicans condition, n = 3-4 for DPI conditions). (E) ETs were visualized by staining for NE (green, 488), DNA (Hoechst, blue, 405), and myeloperoxidase (MPO, magenta, 633). Images were acquired using a Leica SP8 confocal microscope, original magnification ×400. Scale bar = 20 μm. Results are representative of 3 independent experiments. DMSO, dimethyl sulfoxide.
Absence of ET formation by eosinophils. Eosinophils and neutrophils were preincubated with 10 μM DPI or 0.1% DMSO as vehicle control where indicated. To induce ET formation, eosinophils and neutrophils were stimulated with (A-C,E) PMA (100 ng/mL), (D) MSU crystals (200 μg/mL), or opsonized C. albicans for 4 hours at 37°C. (A-B,D) DNA release of eosinophils and neutrophils was measured in real time by Sytox Green Nucleic Acid Stain and (C) the area under the curve was calculated (mean + standard deviation , n = 6-7 for PMA vehicle condition, n = 6-7 for MSU crystals condition, n = 4-5 for C. albicans condition, n = 3-4 for DPI conditions). (E) ETs were visualized by staining for NE (green, 488), DNA (Hoechst, blue, 405), and myeloperoxidase (MPO, magenta, 633). Images were acquired using a Leica SP8 confocal microscope, original magnification ×400. Scale bar = 20 μm. Results are representative of 3 independent experiments. DMSO, dimethyl sulfoxide.
When using other reported EETosis-inducing stimuli, that is, granulocyte-macrophage colony-stimulating factor/interleukin-5 or granulocyte-macrophage colony-stimulating factor/platelet-activating factor,7 we did not observe an increase in DNA staining compared with the unstimulated conditions as assessed by Sytox Green fluorescence (data not shown).
To investigate whether eosinophil DNA release as detected by Sytox Green fluorescence was due to EETosis and not cell death by necrosis or otherwise, we performed immunostaining by confocal microscopy after 4 hours of stimulation with PMA. In contrast to what the increase in Sytox Green fluorescence signal indicated, we did not observe any extracellular web-like DNA structures typical for ETs, as reported for neutrophils.1,18 Morphologically, the nuclei of eosinophils remained largely condensed, or, when the nuclei showed decondensation, their DNA remained inside the cells. These features were in stark contrast to those in neutrophils, where most cells were observed to have undergone NETosis after 4 hours of PMA stimulation (Figure 1E). In concordance with our Sytox Green fluorescence measurements, PMA-induced NETosis was inhibited by DPI.
These data indicate that even though the plasma membrane of eosinophils is compromised upon stimulation with PMA (as the cell-impermeable Sytox Green DNA dye was able to enter the cells), these cells do not expel their DNA into the extracellular space, as would be expected during the process of EETosis.
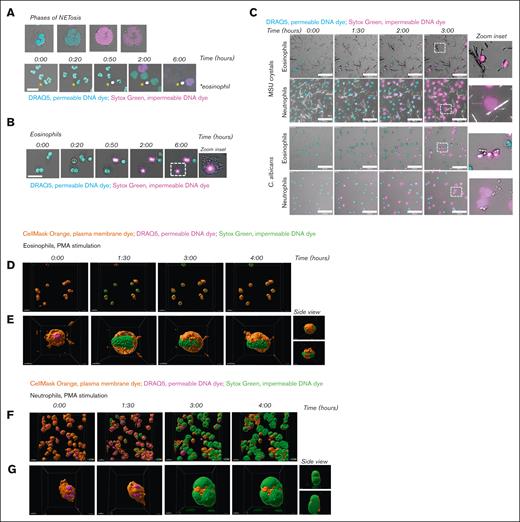
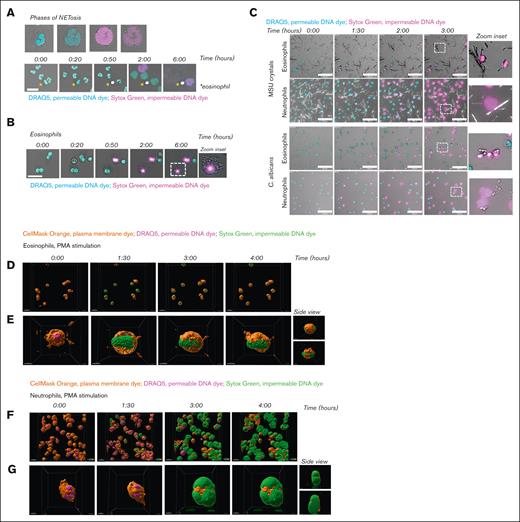
To investigate the response of eosinophils upon PMA stimulation in more detail, we applied live cell imaging using 2 DNA dyes, that is, the permeable DNA dye DRAQ5 and the impermeable DNA dye Sytox Green. This enabled us to evaluate the previously described phases of EETosis: (1) upon stimulation, eosinophils lose their typical bilobed nuclei structure and obtain a single nuclear structure, and the formation of Charcot-Leyden crystals can be observed,19 (2) nuclei disintegrate intracellularly, and (3) the plasma membrane ruptures, resulting in the release of EETs. The phases of NETosis are similar to those of EETosis, with the exception of Charcot-Leyden crystal formation. Consistent with our previous observations,18 we observed upon PMA stimulation of human neutrophils these 3 consecutive phases of chromatin decondensation, mixture of nuclear material with the cytoplasm, and plasma membrane breakdown, leading to the release of DNA into the extracellular space (Figure 2A; supplemental Video 1). Although the nuclei of eosinophils lost their typical bilobed structure and became more rounded after about 60 minutes of PMA stimulation (phase 1), we did not observe any change in this rounded nuclear structure until at least 5 hours later. However, upon nuclear rearrangement during phase 1, Charcot-Leyden crystal formation was observed, whereupon the nuclei of eosinophils became positive for Sytox Green fluorescence, indicating that the plasma membrane became permeable at that time and the nuclear DNA accessible for staining. Phases 2 (intracellular disintegration of the nucleus) and 3 (plasma membrane rupture) were not observed (Figure 2B; supplemental Video 1). These observations, which were obtained with live cell imaging, agree with our previous results: the ROS-dependent increase in Sytox Green fluorescence intensity as measured by plate reader occurs without the release of the typical web-like DNA structures as assessed by confocal microscopy upon PMA stimulation of eosinophils. Furthermore, although we observed NETosis upon exposure of neutrophils with MSU crystals or C. albicans, eosinophils showed a lack of DNA decondensation and plasma membrane rupture (Figure 2C; supplemental Videos 2-3). Eosinophils thus fail to expel their DNA in response to MSU crystals or C. albicans, similar to PMA stimulation.
Failure of plasma membrane breakdown and extracellular DNA release by eosinophils. To induce ET formation, eosinophils and neutrophils were stimulated with (A-B, D-G) PMA (100 ng/mL), (C) MSU crystals (200 μg/mL), or opsonized C. albicans for 4 hours (unless otherwise indicated) at 37°C. (A-C) Images were acquired using a Leica SP8 confocal microscope. (A) NETosis dynamics upon PMA stimulation were assessed by live cell imaging using the permeable DNA dye DRAQ5 (cyan) and the impermeable DNA dye Sytox Green (magenta). Asterisks indicate an eosinophil. Time is displayed in hours, scale bar = 20 μm. Refer to supplemental Video 1. Results are representative of 3 independent experiments. (B) Dynamics of eosinophils upon PMA stimulation. Scale bar = 20 μm. Refer to supplemental Video 1. Results are representative of 2 independent experiments. (C) Dynamics of eosinophils and neutrophils upon exposure to MSU crystals (upper panel) or C. albicans (lower panel). Scale bar = 100 μm. Refer to supplemental Videos 2-3. Results are representative of 2 independent experiments. (D-G) Images were acquired using the ZEISS LSM 980 Airyscan 2 confocal microscope, original magnification ×400. (D-E) Dynamics of eosinophils upon PMA stimulation were assessed by live cell imaging using the plasma membrane dye CellMask Orange (orange), permeable DNA dye DRAQ5 (magenta), and the impermeable DNA dye Sytox Green (green). Time is displayed in hours, scale bar = 20 μm. Refer to supplemental Video 4. (E) Stills of supplemental Video 5, with a 360º zoom around an eosinophil illustrating that the plasma membrane of the eosinophils does not breakdown and DNA remains inside of the cell. Scale bar = 5 μm. (F-G) NETosis dynamics upon PMA stimulation. Scale bar = 20 μm. Refer to supplemental Video 6. (D) Stills of supplemental Video 7, with a 360º zoom around a neutrophil illustrating that the plasma membrane of the neutrophil breaks down, resulting in extracellular release of DNA and thus NETosis. Scale bar = 5 μm.
Failure of plasma membrane breakdown and extracellular DNA release by eosinophils. To induce ET formation, eosinophils and neutrophils were stimulated with (A-B, D-G) PMA (100 ng/mL), (C) MSU crystals (200 μg/mL), or opsonized C. albicans for 4 hours (unless otherwise indicated) at 37°C. (A-C) Images were acquired using a Leica SP8 confocal microscope. (A) NETosis dynamics upon PMA stimulation were assessed by live cell imaging using the permeable DNA dye DRAQ5 (cyan) and the impermeable DNA dye Sytox Green (magenta). Asterisks indicate an eosinophil. Time is displayed in hours, scale bar = 20 μm. Refer to supplemental Video 1. Results are representative of 3 independent experiments. (B) Dynamics of eosinophils upon PMA stimulation. Scale bar = 20 μm. Refer to supplemental Video 1. Results are representative of 2 independent experiments. (C) Dynamics of eosinophils and neutrophils upon exposure to MSU crystals (upper panel) or C. albicans (lower panel). Scale bar = 100 μm. Refer to supplemental Videos 2-3. Results are representative of 2 independent experiments. (D-G) Images were acquired using the ZEISS LSM 980 Airyscan 2 confocal microscope, original magnification ×400. (D-E) Dynamics of eosinophils upon PMA stimulation were assessed by live cell imaging using the plasma membrane dye CellMask Orange (orange), permeable DNA dye DRAQ5 (magenta), and the impermeable DNA dye Sytox Green (green). Time is displayed in hours, scale bar = 20 μm. Refer to supplemental Video 4. (E) Stills of supplemental Video 5, with a 360º zoom around an eosinophil illustrating that the plasma membrane of the eosinophils does not breakdown and DNA remains inside of the cell. Scale bar = 5 μm. (F-G) NETosis dynamics upon PMA stimulation. Scale bar = 20 μm. Refer to supplemental Video 6. (D) Stills of supplemental Video 7, with a 360º zoom around a neutrophil illustrating that the plasma membrane of the neutrophil breaks down, resulting in extracellular release of DNA and thus NETosis. Scale bar = 5 μm.
Next, we studied the absence of plasma membrane breakdown by eosinophils in more detail by live cell imaging using the Airyscan 2 detector (ZEISS), suitable for high-resolution confocal laser scanning microscopy.20 We stained the plasma membrane of eosinophils and neutrophils and made z-stacks of the cells, enabling us to visualize the cells in 3D. Of note, it can be observed that the plasma membrane in both eosinophils and neutrophils is not evenly distributed, resulting in a patchy membrane staining (Figure 2D-G and corresponding supplemental Videos). This is considered to be a technical aspect of the experiment, as this phenomenon is observed at the beginning and throughout the experiment in both the PMA-stimulated and unstimulated (data not shown) conditions.
In accordance with our previous results, we observed that upon PMA stimulation of eosinophils, their plasma membrane becomes permeable, resulting in a Sytox Green fluorescent signal (green). However, their plasma membrane (orange) does not show any breakdown, and therefore eosinophil DNA remains inside the cell (Figure 2D-E; supplemental Videos 4-5). In contrast, upon stimulation of neutrophils with PMA, chromatin decondensation, mixing of nuclear material with the cytoplasm, and breakdown of the plasma membrane are observed. Furthermore, the capacity of neutrophils to release their extracellular DNA in a significant area around the cell is well visualized (Figure 2F-G; supplemental Videos 6-7). The inclusion of the plasma membrane dye in this experimental setup supports the notion that eosinophils do not release DNA extracellularly.
Impaired NET formation by neutrophils derived from a patient with a mutation in ELANE
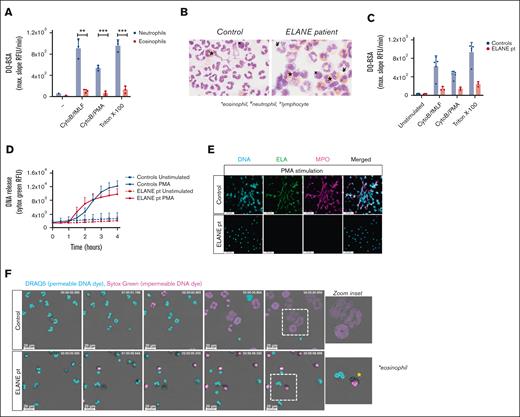
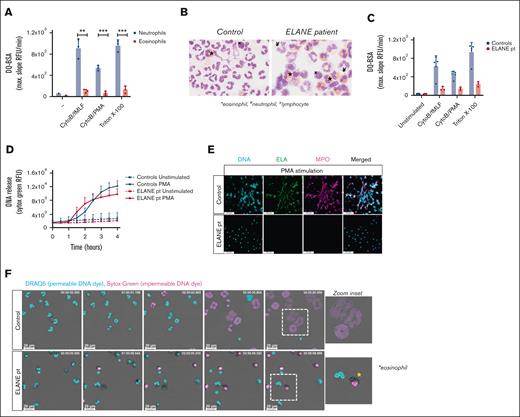
One of the crucial components for NETosis is the serine protease NE, which, upon translocation to the nucleus, cleaves histones, resulting in chromatin decondensation.21 Patients with Papillon-Lefévre syndrome have mutations in the gene CTSC encoding cathepsin C, which is responsible for the activation of neutrophil serine proteases elastase and cathepsin G.22 The neutrophils of these patients with Papillon-Lefévre syndrome have been demonstrated to be defective in NET formation,23-25 and chemical inhibition of NE, but not cathepsin G, impairs NET formation,21,26 indicating the necessity of NE for NETosis. Serine proteases are found in the granules of neutrophils, but they are absent or not functionally expressed by eosinophils when tested by a fluorogenic substrate for classical serine proteases (Figure 3A).27,28 Therefore, the lack of NE activity might be the main reason why we did not observe disintegration of the nuclei of eosinophils and subsequent plasma membrane rupture.
Impaired NET formation by neutrophils derived from a patient with a mutation in ELANE. (A) Protease release and proteolytic activity of neutrophils and eosinophils upon stimulation with CytoB/fMLF (5 μg/mL; 1 μM) and CytoB/PMA (5 μg/mL; 100 ng/mL) were determined by DQ-green BSA. A Triton X-100 lysate was used as 100% (mean + standard deviation, n = 3). (B) Representative cytospins of isolated granulocyte fractions from controls and patient (original magnification ×400; May-Grünwald/Giemsa stain). These cell suspensions were used in panel F. ∗eosinophil, ¥neutrophil, xlymphocyte. (C) Protease release and proteolytic activity by control (n = 5) and ELANE patient (n = 3) granulocytes (mean + standard deviation). (D-F) To induce ET formation, cells were stimulated with PMA (100 ng/mL) for 4 hours, and (D) DNA release was measured in real-time by Sytox Green Nucleic Acid Stain (mean + standard deviation, n = 4 for controls, n = 3 for ELANE patient) and (E) ETs were visualized by staining for neutrophil elastase (NE, green, 488), DNA (Hoechst, blue, 405), and myeloperoxidase (MPO, magenta, 633). Images were acquired using a Leica SP8 confocal microscope, original magnification ×400. Scale bar = 50 μm. Results are representative of 3 independent experiments. (F) NETosis dynamics upon PMA stimulation were assessed by live cell imaging using the permeable DNA dye DRAQ5 (cyan) and the impermeable DNA dye Sytox Green (magenta). Asterisk indicates an eosinophil. Time is displayed in hours, scale bar = 20 μm. Refer to supplemental Video 8. Results are representative of 2 independent experiments. (A) Statistics were performed by unpaired t test; ∗∗P < .01; ∗∗∗P < .001.
Impaired NET formation by neutrophils derived from a patient with a mutation in ELANE. (A) Protease release and proteolytic activity of neutrophils and eosinophils upon stimulation with CytoB/fMLF (5 μg/mL; 1 μM) and CytoB/PMA (5 μg/mL; 100 ng/mL) were determined by DQ-green BSA. A Triton X-100 lysate was used as 100% (mean + standard deviation, n = 3). (B) Representative cytospins of isolated granulocyte fractions from controls and patient (original magnification ×400; May-Grünwald/Giemsa stain). These cell suspensions were used in panel F. ∗eosinophil, ¥neutrophil, xlymphocyte. (C) Protease release and proteolytic activity by control (n = 5) and ELANE patient (n = 3) granulocytes (mean + standard deviation). (D-F) To induce ET formation, cells were stimulated with PMA (100 ng/mL) for 4 hours, and (D) DNA release was measured in real-time by Sytox Green Nucleic Acid Stain (mean + standard deviation, n = 4 for controls, n = 3 for ELANE patient) and (E) ETs were visualized by staining for neutrophil elastase (NE, green, 488), DNA (Hoechst, blue, 405), and myeloperoxidase (MPO, magenta, 633). Images were acquired using a Leica SP8 confocal microscope, original magnification ×400. Scale bar = 50 μm. Results are representative of 3 independent experiments. (F) NETosis dynamics upon PMA stimulation were assessed by live cell imaging using the permeable DNA dye DRAQ5 (cyan) and the impermeable DNA dye Sytox Green (magenta). Asterisk indicates an eosinophil. Time is displayed in hours, scale bar = 20 μm. Refer to supplemental Video 8. Results are representative of 2 independent experiments. (A) Statistics were performed by unpaired t test; ∗∗P < .01; ∗∗∗P < .001.
Because transduction of primary human eosinophils with serine proteases to study the effects of proteolytic enzymes in the process of DNA release will not be possible, we investigated neutrophils and eosinophils from a patient with an autosomal dominant mutation in ELANE (the gene encoding NE),10 causing severe congenital neutropenia.29 The granulocyte fraction of the ELANE patient consisted of eosinophils (59%) and neutrophils (12%), and contaminating lymphocytes (29%) were also present, as observed microscopically by cytospins. The granulocyte fraction of controls almost exclusively consisted of neutrophils (Figure 3B). Serine protease activity upon degranulation of granulocytes was assessed and confirmed strongly diminished proteolytic activity by the patient granulocytes, indicative of reduced NE activity (Figure 3C), which is consistent with previous reports on mutant NE.30 We evaluated the ability of these NE-deficient patient cells to release ETs, and although Sytox Green fluorescence intensity increased upon PMA stimulation, we did not observe web-like DNA structures in the extracellular environment (Figure 3D-E). To determine the contribution of eosinophils or neutrophils to the Sytox Green fluorescence signal, we performed live cell imaging with confocal microscopy. Neutrophils and eosinophils could easily be distinguished morphologically, as neutrophils have a segmented nucleus vs the bilobular nucleus of eosinophils and the more densely packed granules in eosinophils. Similar to control eosinophils, we observed that the nucleus of eosinophils from the patient who was NE-deficient became positive for Sytox Green fluorescence upon PMA stimulation, indicative of permeability of the plasma membrane (Figure 3F; supplemental Video 8). NE-deficient neutrophils did not undergo NETosis upon PMA stimulation, which is in concordance with our negative immunostaining for DNA and myeloperoxidase (Figure 3E) and previous observations in NE knockout mice.31,32
Discussion
In conclusion, we have shown using live cell imaging that human eosinophils do not form ETs and hence do not undergo EETosis upon PMA stimulation, as well as after exposure to MSU crystals and opsonized C. albicans. The impermeable nucleic acid stain Sytox Green, commonly used as a marker for ETosis, does, however, enter the cell and binds to DNA, resulting in a fluorescent signal. Therefore, our study emphasizes the need for multiple techniques to identify ETs, as one cannot rely on the Sytox Green fluorescence signal as the sole indicator for ET formation as it is unable to distinguish between intracellular and extracellular DNA when the plasma membrane is compromised.
As indicated by live cell imaging, the nuclei of eosinophils morphologically altered upon stimulation, as their typical bilobed nuclei structure was lost to a single nuclear structure. However, there was no full chromatin expansion observed, as would occur during ETosis. For end point visualization of ETs, some eosinophil nuclei showed decondensation, whereas their DNA remained inside the cells (Figure 1E). Considering that fixation with PFA increases the permeability of the plasma membrane,33 we hypothesize that, because the plasma membrane of eosinophils is already compromised upon stimulation, PFA is able to reach and permeabilize the nuclear membrane, explaining our observed decondensation of DNA in fixated eosinophils as an artifact.
It has been described that under static culture conditions, EETs are hardly observed, and therefore it was recommended to apply experimental shear flow upon incubation of eosinophils, that is, culture plates were shaken for up to 120 seconds at 1000 rpm to visualize EETs.17 However, we hypothesize that when you apply this much mechanical force on fragile eosinophils (because of a permeable plasma membrane, as indicated by Sytox staining), DNA will be shaken out of the cell into the extracellular space. In our opinion, this is an artifact and cannot be interpreted as a natural process of EETosis.
We have observed that the Sytox Green fluorescence signal was absent when eosinophils were pretreated with the NADPH oxidase inhibitor DPI, indicating that ROS production is the necessary mediator for the plasma membrane of eosinophils to become compromised upon PMA stimulation. Eosinophils are known to produce a very strong respiratory burst, even stronger than neutrophils, upon activation by PMA (supplemental Figure 1A).34-36
Although we cannot exclude other proteases from being involved and facilitating the process of DNA release, we hypothesize that the lack of NE activity in human eosinophils37 is the reason why ET formation is not observed. In neutrophils, NE is important for the cleavage of histones to induce chromatin decondensation,21,26 which is the process that seems to be lacking in eosinophils. We confirmed that NE is essential for NETosis, as NE-deficient neutrophils were unable to release NETs.
Acknowledgments
The authors are most grateful to the patient and parents for their collaboration.
E.G.G.S. and T.W.K. were partially supported by funds from the European Union’s Horizon 2020 Research and Innovation Programme under grant agreement number 668303 and T.W.K. was partially funded by the E-Rare ZonMW grant #90030376506.
Authorship
Contribution: E.G.G.S. and T.W.K. wrote the manuscript; E.G.G.S., R.v.B., and T.W.K. designed the experiments; E.G.G.S., I.G., A.T.J.T., S.F.H., and M.H. performed experiments; and E.G.G.S. analyzed the data; all authors read, revised, and approved the final version of the manuscript.
Conflict-of-interest disclosure: The authors declare no competing financial interests.
Correspondence: Evelien G.G. Sprenkeler, Department of Molecular Hematology, Sanquin Research, Amsterdam University Medical Center, University of Amsterdam, Amsterdam 1066CX, The Netherlands; e-mail: evelien.sprenkeler@radboudumc.nl.
References
Author notes
∗E.G.G.S. and I.G. contributed equally to this work.
Data are available on request from the corresponding author, Evelien G.G. Sprenkeler evelien.sprenkeler@radboudumc.nl
The full-text version of this article contains a data supplement.

